. 2020 Oct 20;33(3):108296.
doi: 10.1016/j.celrep.2020.108296.

SCLC-CellMiner: A Resource for Small Cell Lung Cancer Cell Line Genomics and Pharmacology Based on Genomic Signatures

Affiliations

SCLC-CellMiner: A Resource for Small Cell Lung Cancer Cell Line Genomics and Pharmacology Based on Genomic Signatures

Camille Tlemsani et al. Cell Rep. .

Abstract

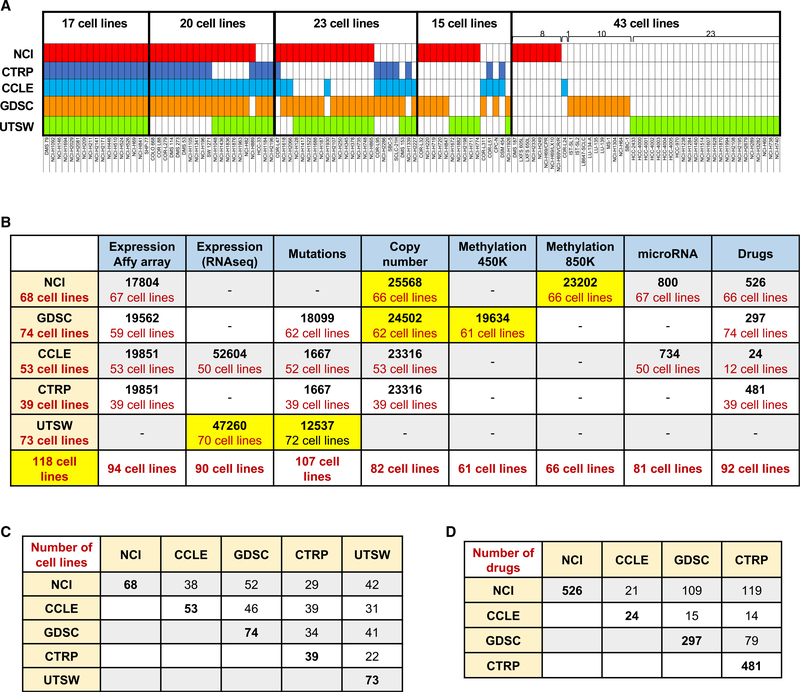
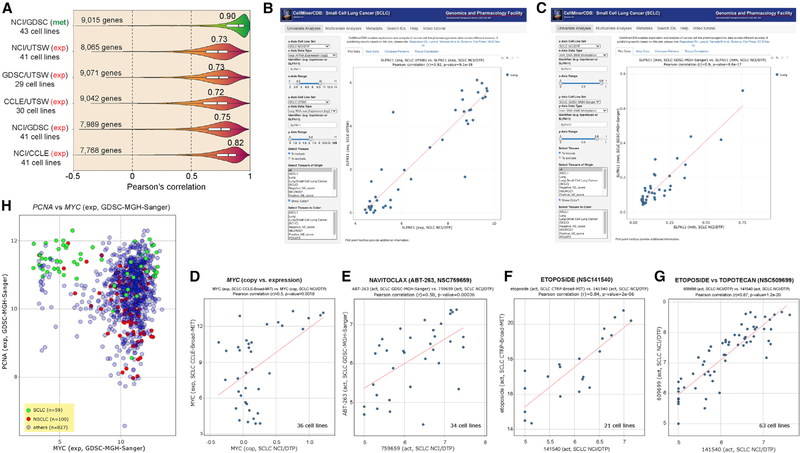
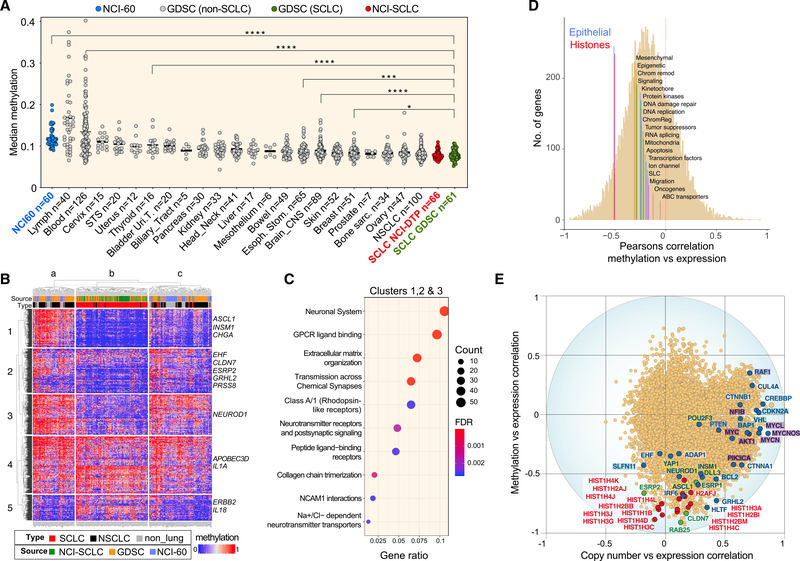
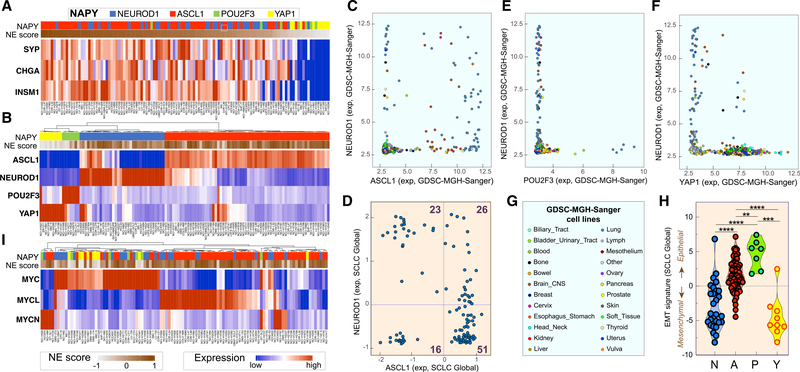
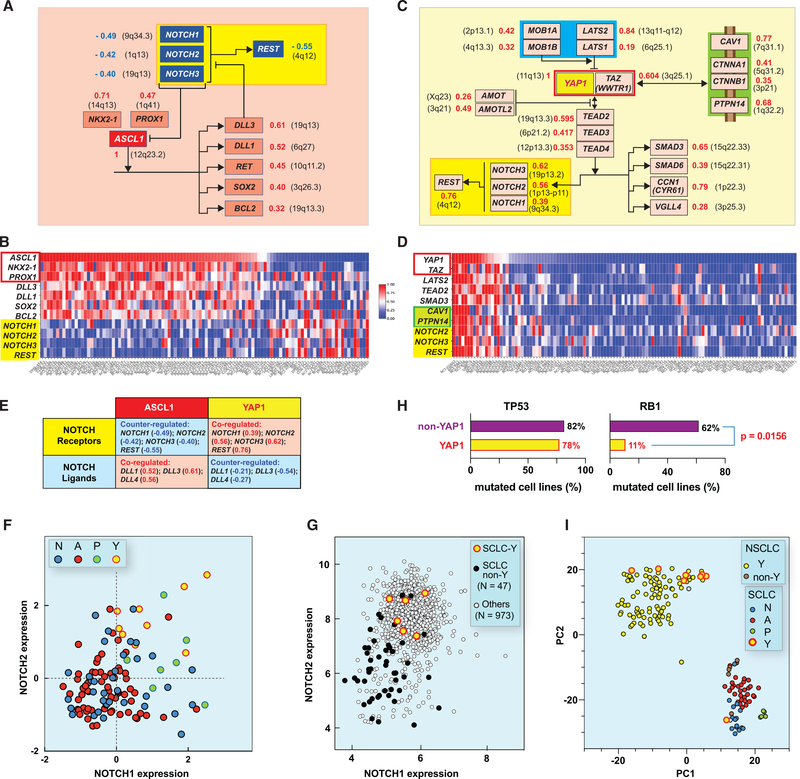
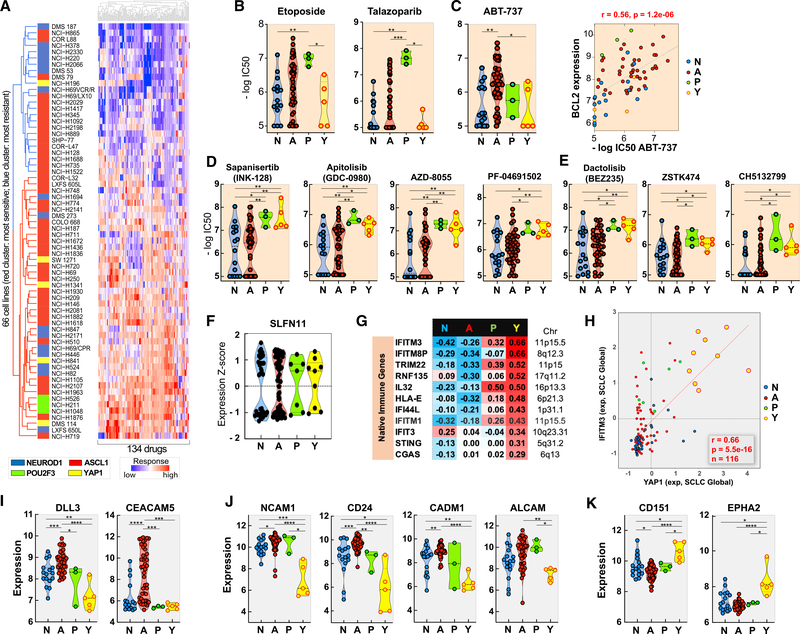
CellMiner-SCLC (https://discover.nci.nih.gov/SclcCellMinerCDB/) integrates drug sensitivity and genomic data, including high-resolution methylome and transcriptome from 118 patient-derived small cell lung cancer (SCLC) cell lines, providing a resource for research into this "recalcitrant cancer." We demonstrate the reproducibility and stability of data from multiple sources and validate the SCLC consensus nomenclature on the basis of expression of master transcription factors NEUROD1, ASCL1, POU2F3, and YAP1. Our analyses reveal transcription networks linking SCLC subtypes with MYC and its paralogs and the NOTCH and HIPPO pathways. SCLC subsets express specific surface markers, providing potential opportunities for antibody-based targeted therapies. YAP1-driven SCLCs are notable for differential expression of the NOTCH pathway, epithelial-mesenchymal transition (EMT), and antigen-presenting machinery (APM) genes and sensitivity to mTOR and AKT inhibitors. These analyses provide insights into SCLC biology and a framework for future investigations into subtype-specific SCLC vulnerabilities.

Keywords: PARP; SLFN11; STING; Schlafen; genomics; immune checkpoints; mutations; native immune response; neuroendocrine tumors; replication.


Conflict of interest statement

Declaration of Interests The authors declare no competing interests.

Figures

Figure 1.
Figure 1.. Summary of the Data Included in SCLC-CellMiner and Resources
(A) Cell line overlap between the data sources. Cell lines in red are from the NCI database (n = 68), dark blue from CTRP (n = 39), light blue from CCLE (n = 53),orange from GDSC (n = 74), and green from UTSW (n = 73). Cell line details are provided in Table S1. (B) Summary of the genomic and drug activities data in SCLC-CellMiner (https://discover.nci.nih.gov/SclcCellMinerCDB/). For microarray, mutations, copy number, and promoter methylation data, the numbers indicate the number of genes. For RNA-seq data, the numbers indicate the number of transcripts. The bottom row shows the total number of cell lines (N = 118) integrated in SCLC-CellMiner. New data analyses are highlighted in yellow. (C) Cell line overlap between data sources (see Table S1 for details). (D) Drug overlap between data sources.
Figure 2.
Figure 2.. Validation and Reproducibility of the SCLC-CellMiner Data and Snapshots of Representative Outputs of SCLC-CellMiner (https://discover.nci.nih.gov/SclcCellMinerCDB/)
(A) Reproducibility between data sources. Pearson’s correlations are indicated above violin plots. (B) Snapshot showing the reproducibility of SLFN11 gene expression across the 41 common cell lines (AffyArray for NCI/DTP on the x axis versus RNA-seq for UTSW). Each dot is a cell line. The data can also be readily displayed in tabular form and downloaded in tab-delimited format by clicking on the “View Data” tab to the right of the default “Plot Data” tab. (C) Snapshot showing the reproducibility of SLFN11 promoter methylation across the 43 common cell lines independently of the methods used (850K Illumina Infinium MethylationEPIC BeadChip array for NCI/DTP versus Illumina HumanMethylation 450K BeadChip array for GDSC). (D) Highly significant correlation between MYC copy number (NCI/DTP) and MYC expression (CCLE) for the 36 common SCLC cell lines. (E–G) Examples of drug activity across databases for the common cell lines. (H) High proliferation signature of SCLC cell lines on the basis of high PCNA and MYC expression. Snapshot shows that SCLC (green) overexpress PCNA and fall into two groups with respect to MYC.
Figure 3.
Figure 3.. Methylation Profile of SCLC Cell Lines
(A) Global hypomethylation in SCLC cell lines. Each point represents the median methylation level of individual cell lines for the total set of 17,559 genes. Twenty-one cancer subtypes from GDSC are ranked according their global methylation levels. SCLC cell lines are in red (NCI) and green (GDSC). (B) Comparison of promoter methylation profiles for 287 cell lines including SCLC (NCI and GDSC), NSCLC (GDSC and NCI-60), and non-lung cancer cell lines from the NCI-60. The heatmap displays the levels of methylation of 1,813 genes with high dynamic range. Examples of genes are indicated at right and details provided in Table S3. Clusters a, b, and c include 68, 117, and 102 cell lines, respectively. (C) Pathway analysis. (D) Functional categories with significant correlation between gene expression and promoter methylation for the NCI-SCLC cell lines (n = 66). Median values transcript expression versus DNA methylation level correlations of 20 functional groups including 17,144 genes (Table S5). (E) Correlations between gene expression and predictive values of DNA copy number. R values of −1 and +1 indicate perfect negative and positive predictive power, respectively. Each point represents 1 of a total of 14,046 genes analyzed. Oncogenes and tumor suppressor genes (highlighted in purple and in blue, respectively) are driven primarily by copy number. Histone genes (red) and epithelial genes (green) are driven primarily by DNA methylation (Table S5). SCLC key genes (ASCL1, NEUROD1, POU2F3, and YAP1) are also labeled.
Figure 4.
Figure 4.. SCLC Genomic Molecular Classifications
(A) NE classification. Cell lines with high and low NE score are in dark brown and gray, respectively (n = 116 cell lines; CellMiner-Global). CHGA, SYP, and INSM1 expression after Z score normalization. (B) NAPY classification for the 116 SCLC cell lines. Expression values across the five data sources were obtained after normalization by Z score (Table S3). (C) NEUROD1 and ASCL1 expression are specific for both SCLC and brain tumor cell lines (GDSC database; each point is a cell line; n = 986). (D) POU2F3 is selectively expressed in SCLC but not in brain tumor cell lines (GDSC; n = 986). (E) YAP1 shows a high range of expression across different cell line subtypes (GDSC; n = 986). (C)–(E) are snapshots (https://discover.nci.nih.gov/cellminercdb). (F) Co-expression of NEUROD1 and ASCL1 in SCLC-Global. (G) Subtypes of cell lines in GDSC. (H) EMT signature and NAPY classification in CellMiner-Global. (I) Classification based on expression of the three MYC genes in 106 SCLC cell lines across the five data sources after Z score normalization.
Figure 5.
Figure 5.. Integration of the Transcriptional Networks of the SCLC-A and SCLC-Y Cell Lines with the NOTCH Pathway for the 116 Cell Lines Derived from SCLC-Global Analyses
(A) Highly significant correlations between ASCL1 expression and NKX2–1 and PROX1 and downstream transcriptional targets (bayonet arrows). Numbers to the right indicate the significantly positive Pearson’s correlations coefficients (red) (https://discover.nci.nih.gov/SclcCellMinerCDB/) irrespective of chromosome locations (black in parenthesis). The NOTCH receptor network with its transcriptional target REST (yellow box) shows significant negative Pearson’s correlations (blue). (B) Correlations between the expression of ASCL1 and the genes shown in (A) (snapshot from the multivariate analysis tool of SCLC-CellMiner). (C and D) Same as (A) and (B) except for YAP1. (E) Correlations between the NOTCH receptors and ligands genes and ASCL1 versus YAP1. Pearson’s correlation coefficients are indicated in parenthesis. (F) Correlation between NOTCH1 and NOTCH2 expression. YAP1 cells show significantly high expression of both NOTCH1 and NOTCH2. (G) Correlation between NOTCH1 and NOTCH2 expression across the 1,036 cell lines of the CCLE. SCLC-Y cells have highest expression. (H) SCLC-Y cells have significantly fewer RB1 mutations. (I) t-Distributed stochastic neighbor embedding clustering plot using gene expression data of 60 SCLC and 100 NSCLC cell lines (microarray; GDSC data source).
Figure 6.
Figure 6.. Predictive Biomarkers for SCLC Responses
(A) Global response of the NCI-SCLC cell lines (NAPY classification to the left). (B) SCLC-P cells are the most sensitive to etoposide and talazoparib. SCLC-Y cell lines are the most resistant. (C) Selective activity of the BCL2-BCL-XL inhibitor in a subset of the SCLC-A cells and highly significant correlation with BCL2 expression (right). (D) Activity of mTOR/AKT inhibitors in a subset of non-NE cells. (E) Activity of the PI3K inhibitors in non-NE SCLC cells. (F) SLFN11 expression across the 116 SCLC cells exhibits bimodal distribution in all four SCLC subsets and is predictive of response to DNA damaging chemotherapeutics (Figure S6). (G) Selective expression of native immune pathway genes in SCLC-Y (correlations between each of the NAPY genes and the listed native immune response genes. Significantly positive and negative correlations are in red and blue, respectively. (H) Snapshot from SCLC-CellMiner illustrating the correlation between the YAP1 and IFITM3 transcripts across the 116 cell lines of SCLC-Global (Figure S6). (I) Selective expression of the DLL3 and CEACAM5 (Figure S6). (J) Potential surface biomarker targets for NE-SCLC and SCLC-P cells. (K) Potential surface biomarkers for SCLC-Y cells. Data in (A)–(E) and (I)–(K) are from the 66 cell lines from the NCI-DTP drug and genomic database.

Similar articles

Cited by

References

    1. Andersson ER, Sandberg R, and Lendahl U (2011). Notch signaling: simplicity in design, versatility in function. Development 138, 3593–3612. - PubMed
    1. Bacher F (1980). Introduction to bivariate and multivariate-analysis - Lindman,Rh, Merenda,Pf, Gold,Rz. Ann Psychol 83, 265–266.
    1. Barretina J, Caponigro G, Stransky N, Venkatesan K, Margolin AA, Kim S, Wilson CJ, Lehár J, Kryukov GV, Sonkin D, et al. (2012). The Cancer Cell Line Encyclopedia enables predictive modelling of anticancer drug sensitivity. Nature 483, 603–607. - PMC - PubMed
    1. Bullard JH, Purdom E, Hansen KD, and Dudoit S (2010). Evaluation of statistical methods for normalization and differential expression in mRNA-Seq experiments. BMC Bioinformatics 11, 94. - PMC - PubMed
    1. Chalishazar MD, Wait SJ, Huang F, Ireland AS, Mukhopadhyay A, Lee Y, Schuman SS, Guthrie MR, Berrett KC, Vahrenkamp JM, et al. (2019). MYC-driven small-cell lung cancer is metabolically distinct and vulnerable to arginine depletion. Clin. Cancer Res 25, 5107–5121. - PMC - PubMed

Publication types

MeSH terms

Substances