. 2021 Jan 1:171:112686.
doi: 10.1016/j.bios.2020.112686. Epub 2020 Oct 3.

Magnetic beads combined with carbon black-based screen-printed electrodes for COVID-19: A reliable and miniaturized electrochemical immunosensor for SARS-CoV-2 detection in saliva

Affiliations

Magnetic beads combined with carbon black-based screen-printed electrodes for COVID-19: A reliable and miniaturized electrochemical immunosensor for SARS-CoV-2 detection in saliva

Laura Fabiani et al. Biosens Bioelectron. .

Abstract

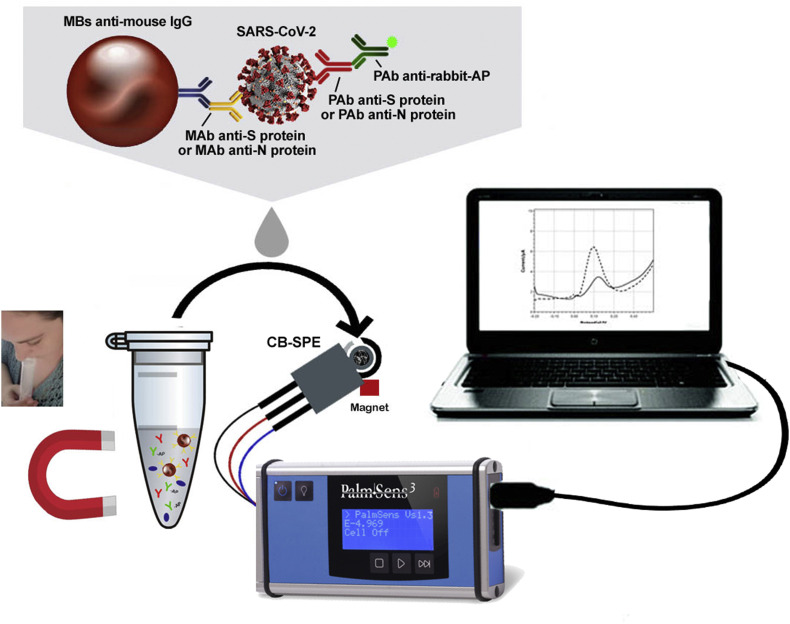
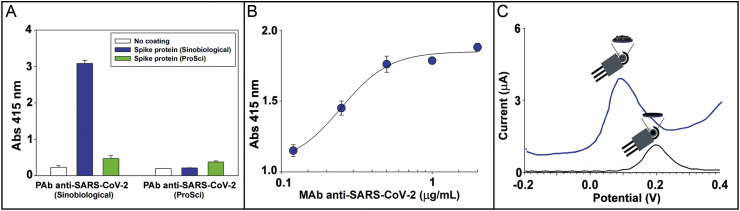
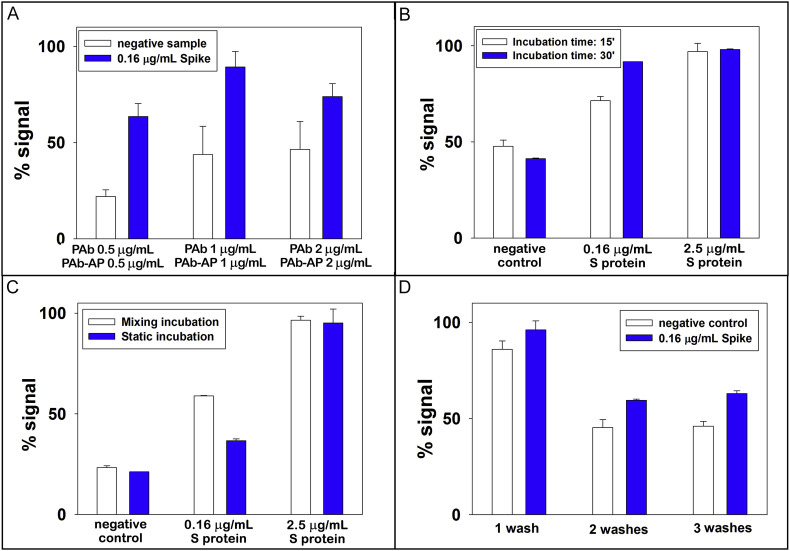
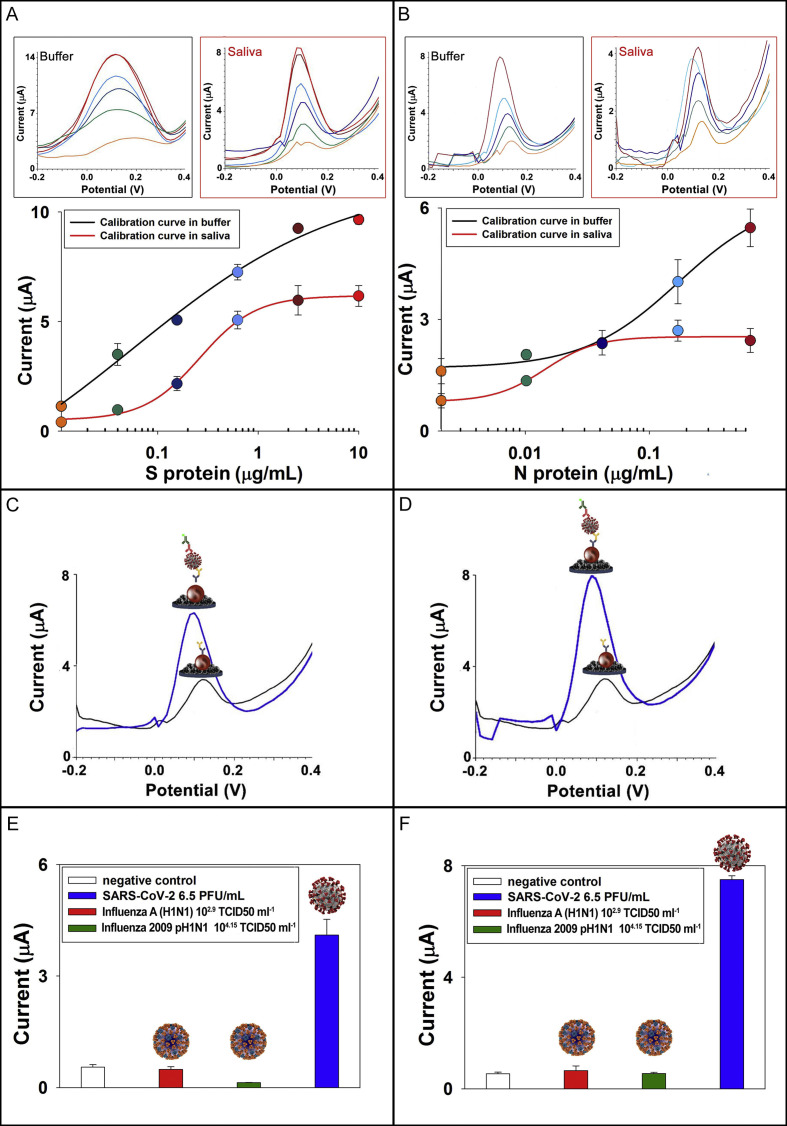
The diffusion of novel SARS-CoV-2 coronavirus over the world generated COVID-19 pandemic event as reported by World Health Organization on March 2020. The huge issue is the high infectivity and the absence of vaccine and customised drugs allowing for hard management of this outbreak, thus a rapid and on site analysis is a need to contain the spread of COVID-19. Herein, we developed an electrochemical immunoassay for rapid and smart detection of SARS-CoV-2 coronavirus in saliva. The electrochemical assay was conceived for Spike (S) protein or Nucleocapsid (N) protein detection using magnetic beads as support of immunological chain and secondary antibody with alkaline phosphatase as immunological label. The enzymatic by-product 1-naphtol was detected using screen-printed electrodes modified with carbon black nanomaterial. The analytical features of the electrochemical immunoassay were evaluated using the standard solution of S and N protein in buffer solution and untreated saliva with a detection limit equal to 19 ng/mL and 8 ng/mL in untreated saliva, respectively for S and N protein. Its effectiveness was assessed using cultured virus in biosafety level 3 and in saliva clinical samples comparing the data using the nasopharyngeal swab specimens tested with Real-Time PCR. The agreement of the data, the low detection limit achieved, the rapid analysis (30 min), the miniaturization, and portability of the instrument combined with the easiness to use and no-invasive sampling, confer to this analytical tool high potentiality for market entry as the first highly sensitive electrochemical immunoassay for SARS-CoV-2 detection in untreated saliva.

Keywords: Carbon black; Differential pulse voltammetry; Immunosensors; Magnetic beads; Screen-printed electrodes.


Conflict of interest statement

The authors declare that they have no known competing financial interests or personal relationships that could have appeared to influence the work reported in this paper.

Figures

Fig. 1
Fig. 1
The MBs-based assay for SARS-CoV-2 detection in untreated saliva.
Fig. 2
Fig. 2
A) ELISA response for two different PAb anti-SARS-CoV-2 1 μg/mL (Sinobiological and ProSci) towards two different Spike proteins coated at 2 ng/mL. B) Binding curve of colorimetric ELISA for MAb anti-SARS-CoV-2 ranging from 0.12 – 2 μg/mL. Coating of Spike protein: 2 ng/mL. C) Electrochemical response using the MBs-based assay using CB-based modified electrode (blue line) and bare electrode (black line). The mean value (n = 3) with the corresponding standard deviation was reported for each measurement. (For interpretation of the references to color in this figure legend, the reader is referred to the Web version of this article.)
Fig. 3
Fig. 3
A) Study of the signal response for evaluating PAb concentration. 10 μL of MBs, 200 μL of PAb anti SARS-CoV-2 0.5, 1, and 2 μg/mL (in PBS) + 200 μL of PAb-AP anti rabbit IgG 0.5, 1, and 2 μg/mL (in PBS) + 300 μL of tested sample, incubation time 30 min without stirring, 3 washing steps, testing a negative control and 0.16 μg/mL of S protein. B) Study of the signal response for evaluating the effect of incubation time. 10 μL of MBs, 200 μL of PAb anti SARS-CoV-2 1 μg/mL (in PBS) + 200 μL of PAb-AP anti rabbit IgG 1 μg/mL (in PBS) + 300 μL of tested sample, incubation time (15/30 min) without stirring, 3 washing steps, testing a negative control, 0.16 and 2.5 μg/mL of S protein. C) Study of the signal response as function of mixing during the incubation step. 10 μL of MBs, 200 μL of PAb anti SARS-CoV-2 1 μg/mL (in PBS) + 200 μL of PAb-AP anti rabbit IgG 1 μg/mL (in PBS) + 300 μL of tested sample, incubation time 30 min with and without stirring, 3 washing steps, testing a negative control and 0.16 and 2.5 μg/mL of S protein. D) Study of the signal response for evaluating the effect of number of washing steps. 10 μL of MBs, 200 μL of PAb anti SARS-CoV-2 1 μg/mL (in PBS) + 200 μL of PAb-AP anti rabbit IgG 1 μg/mL (in PBS) + 300 μL of tested sample, incubation time 30 min without stirring, 1/2/3 washing steps, testing a negative control and 0.16 μg/mL of S protein. The mean value (n = 3) with the corresponding standard deviation was reported for each measurement.
Fig. 4
Fig. 4
A) Electrochemical calibration curve (inset the voltammograms) using the optimized parameters for S protein detection in buffer (black line) and in untreated saliva (red line) (n = 3). B) Electrochemical calibration curve (inset the voltammograms) for N protein detection in buffer (black line) and untreated saliva (red line) (n = 3). C) Voltammograms obtained without (black line) and with (blue line) cultured SARS-CoV-2 virus at concentration 6.5 PFU/mL using MBs-based immunoassay for S protein. D) Voltammograms obtained without (black line) and with (blue line) cultured SARS-CoV-2 virus at concentration 6.5 x 10⁴ PFU/mL using MBs-based immunoassay for N protein. E) Exclusivity test on seasonal influenza virus A (H1N1) (102.9 TCID50 mL−1) and Influenza 2009 pH1N1 virus (104.15 TCID50 mL−1) in comparison to SARS-CoV-2 (6.5 PFU/mL) using assay for S protein (n = 3). F) Exclusivity test on seasonal influenza virus A (H1N1) (102.9 TCID50 mL−1) and 2009 influenza virus pH1N1 (104.15 TCID50 mL−1) in comparison to SARS-CoV-2 (6.5 x 10⁴ PFU/mL) using assay for N protein (n = 3). (For interpretation of the references to color in this figure legend, the reader is referred to the Web version of this article.)

References

    1. Ackerman C.M., Myhrvold C., Thakku S.G., Freije C.A., Metsky H.C., Yang D.K., Ye S., Boehm C.K., Kosoko-Thoroddsen T.-S., Kehe J., Nguyen T., Carter A., Kulesa A., Barnes J., Dugan V., Hung D., Blainey P., Sabeti P. Nature. 2020;582:277–282. - PMC - PubMed
    1. Ahmadivand A., Gerislioglu B., Ramezani Z., Kaushik A., Manickam P., Ghoreishi S.A. 2020. Preprint arXiv:2006. - PMC - PubMed
    1. Alizargar J., Sh M.E., Aghamohammadi M., Hatefi S. J. Formos. Med. Assoc. 2020;119:1234–1235. - PMC - PubMed
    1. Antuña-Jiménez D., González-García M.B., Hernández-Santos D., Fanjul-Bolado P. Biosensors. 2020;10:9. - PMC - PubMed
    1. Arduini F., Amine A., Majorani C., Di Giorgio F., De Felicis D., Cataldo F., Moscone D., Palleschi G. Electrochem. Commun. 2010;12:346–350.

Publication types

MeSH terms