

A Bioinformatic Pipeline Places STAT5A as a miR-650 Target in Poorly Differentiated Aggressive Breast Cancer
- PMID: 33086498
- PMCID: PMC7589888
- DOI: 10.3390/ijms21207720
A Bioinformatic Pipeline Places STAT5A as a miR-650 Target in Poorly Differentiated Aggressive Breast Cancer
Abstract
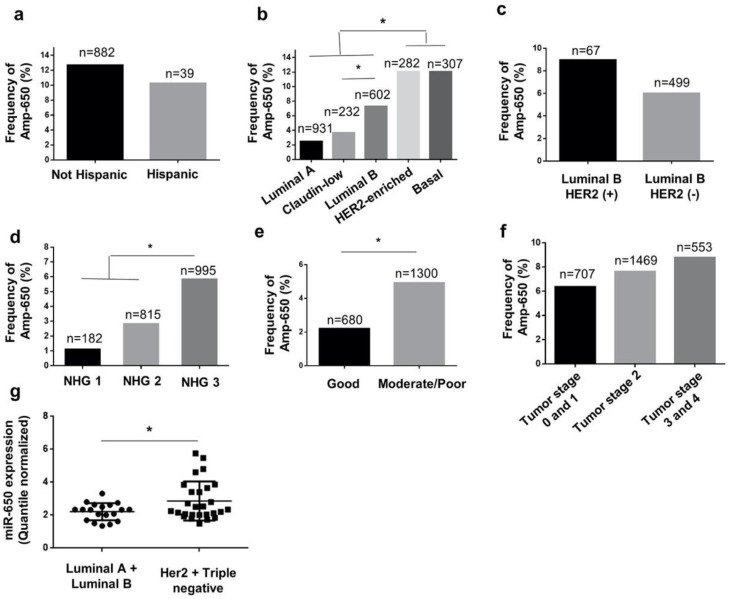
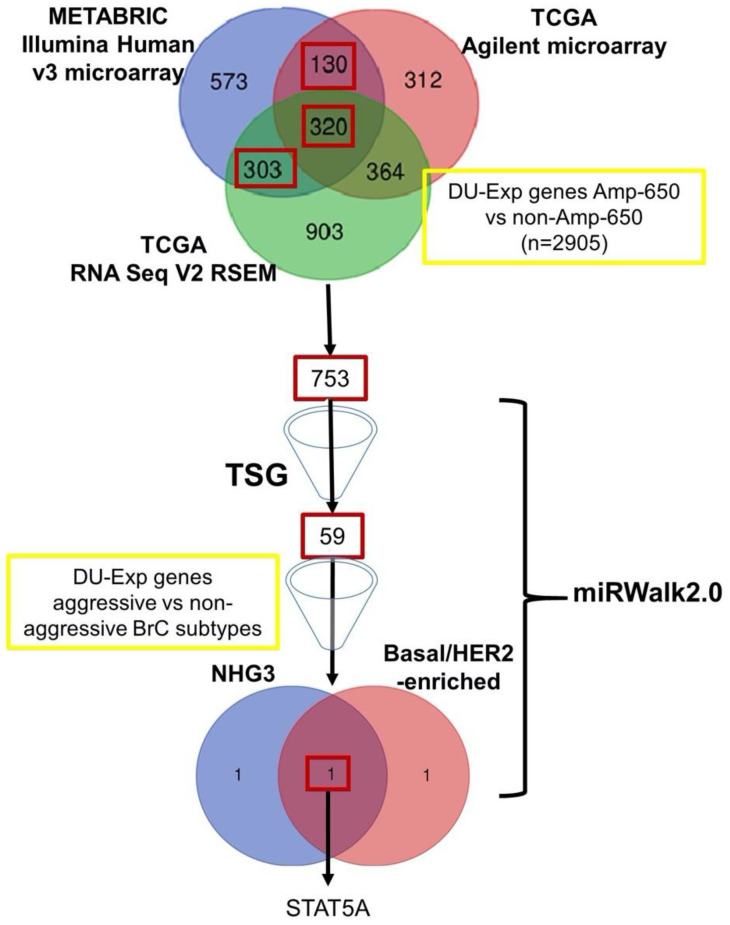
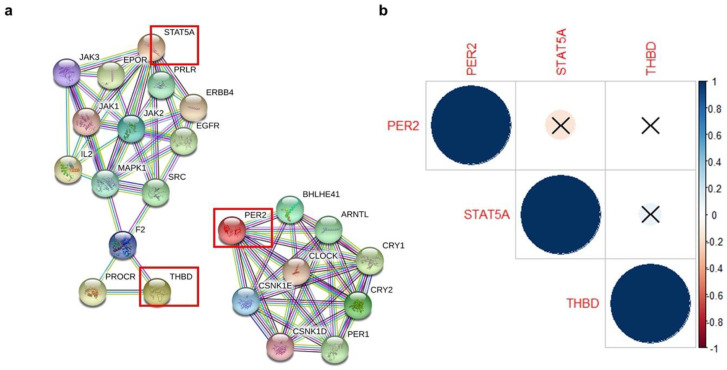
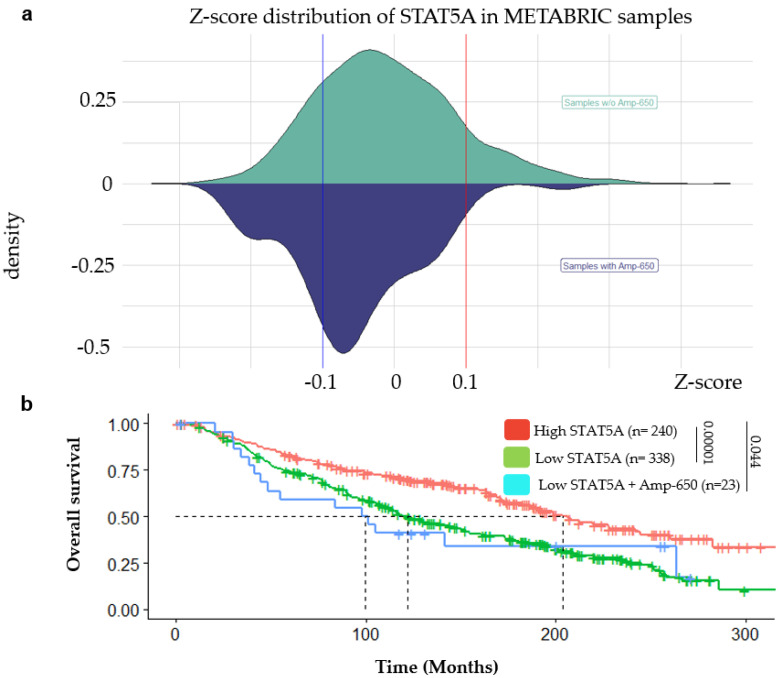
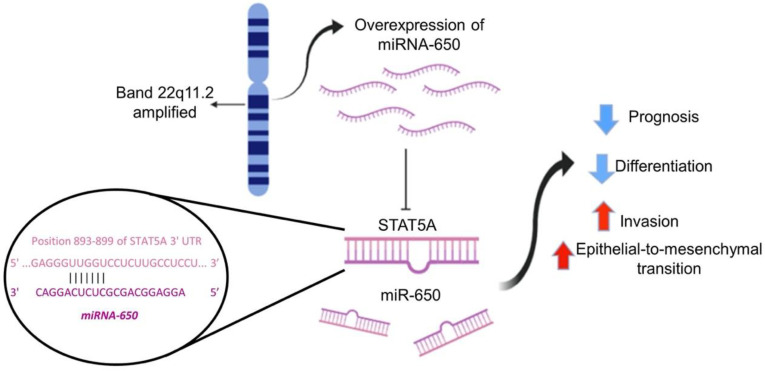
Breast cancer (BRCA) is a leading cause of mortality among women. Tumors often acquire aggressive features through genomic aberrations affecting cellular programs, e.g., the epithelial to mesenchymal transition (EMT). EMT facilitates metastasis leading to poor prognosis. We previously observed a correlation between an amplification of miR-650 (Amp-650) and EMT features in BRCA samples isolated from Mexican patients. In this study, we explored the cBioportal database aiming to extend that observation and better understand the importance of Amp-650 for BRCA aggressiveness. We found that Amp-650 is more frequent in aggressive molecular subtypes of BRCA, as well as in high grade poorly differentiated tumors, which we confirmed in an external miRNA expression database. We performed differential expression analysis on samples harboring Amp-650, taking advantage of gene target prediction tools and tumor suppressor gene databases to mine several hundreds of differentially underexpressed genes. We observed STAT5A as a likely putative target gene for miR-650 in aggressive poorly differentiated BRCA. Samples with both Amp-650 and low expression of STAT5A had less overall survival than samples with either or none of the alterations. No target gene has been described for miR-650 in BRCA, thus, this bioinformatic study provides valuable information that should be corroborated experimentally.
Keywords: STAT5A; amplification; bioinformatic; breast cancer; miR-650; target.
Conflict of interest statement
The authors declare no conflict of interest. The funders had no role in the design of the study; in the collection, analyses, or interpretation of data; in the writing of the manuscript, or in the decision to publish the results.
Figures
Similar articles
-
miR-223 is a coordinator of breast cancer progression as revealed by bioinformatics predictions.PLoS One. 2014 Jan 6;9(1):e84859. doi: 10.1371/journal.pone.0084859. eCollection 2014. PLoS One. 2014. PMID: 24400121 Free PMC article.
-
miR-221/222 control luminal breast cancer tumor progression by regulating different targets.Cell Cycle. 2014;13(11):1811-26. doi: 10.4161/cc.28758. Epub 2014 Apr 15. Cell Cycle. 2014. PMID: 24736554 Free PMC article.
-
Tumor-promoting properties of miR-8084 in breast cancer through enhancing proliferation, suppressing apoptosis and inducing epithelial-mesenchymal transition.J Transl Med. 2018 Feb 23;16(1):38. doi: 10.1186/s12967-018-1419-5. J Transl Med. 2018. PMID: 29471858 Free PMC article.
-
Progesterone downregulation of miR-141 contributes to expansion of stem-like breast cancer cells through maintenance of progesterone receptor and Stat5a.Oncogene. 2015 Jul;34(28):3676-87. doi: 10.1038/onc.2014.298. Epub 2014 Sep 22. Oncogene. 2015. PMID: 25241899 Free PMC article.
-
Signal transducer and activator of transcription 5a/b: biomarker and therapeutic target in prostate and breast cancer.Int J Biochem Cell Biol. 2011 Oct;43(10):1417-21. doi: 10.1016/j.biocel.2011.06.007. Epub 2011 Jun 17. Int J Biochem Cell Biol. 2011. PMID: 21704724 Free PMC article. Review.
Cited by
-
miR-1247-3p targets STAT5A to inhibit lung adenocarcinoma cell migration and chemotherapy resistance.J Cancer. 2022 Mar 28;13(7):2040-2049. doi: 10.7150/jca.65167. eCollection 2022. J Cancer. 2022. PMID: 35517418 Free PMC article.
References
MeSH terms
Substances
Grants and funding
LinkOut - more resources
Full Text Sources
Medical
Miscellaneous
