

Use of Metabolomic Profiling to Understand Variability in Adiposity Changes Following an Intentional Weight Loss Intervention in Older Adults
- PMID: 33086512
- PMCID: PMC7603124
- DOI: 10.3390/nu12103188
Use of Metabolomic Profiling to Understand Variability in Adiposity Changes Following an Intentional Weight Loss Intervention in Older Adults
Abstract
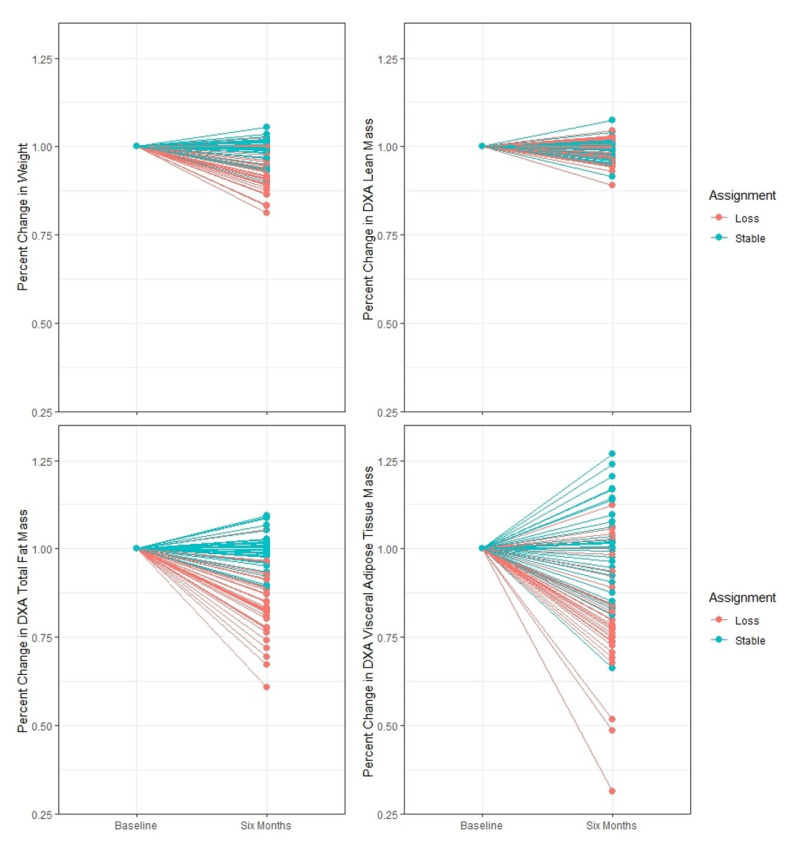
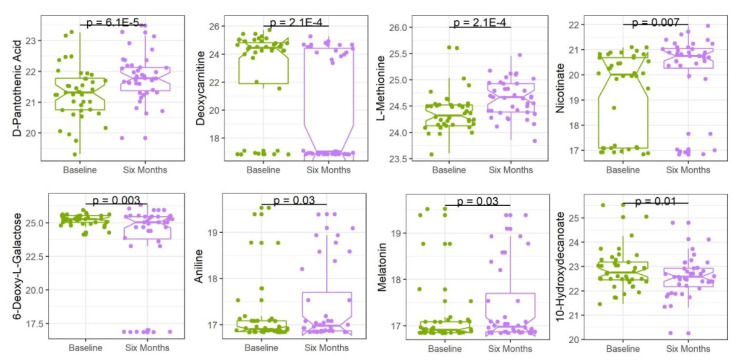
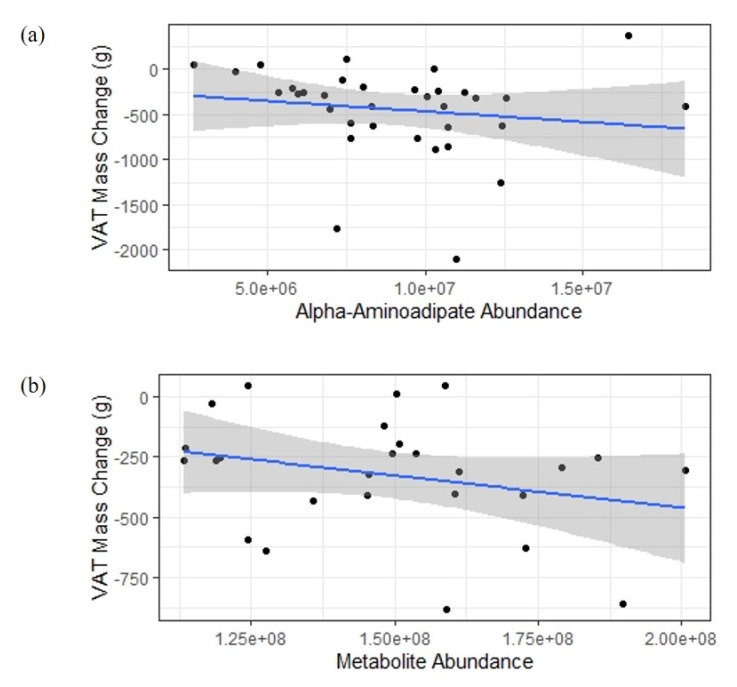
Inter-individual response to dietary interventions remains a major challenge to successful weight loss among older adults. This study applied metabolomics technology to identify small molecule signatures associated with a loss of fat mass and overall weight in a cohort of older adults on a nutritionally complete, high-protein diet. A total of 102 unique metabolites were measured using liquid chromatography-mass spectrometry (LC-MS) for 38 adults aged 65-80 years randomized to dietary intervention and 36 controls. Metabolite values were analyzed in both baseline plasma samples and samples collected following the six-month dietary intervention to consider both metabolites that could predict the response to diet and those that changed in response to diet or weight loss.Eight metabolites changed over the intervention at a nominally significant level: D-pantothenic acid, L-methionine, nicotinate, aniline, melatonin, deoxycarnitine, 6-deoxy-L-galactose, and 10-hydroxydecanoate. Within the intervention group, there was broad variation in the achieved weight-loss and dual-energy x-ray absorptiometry (DXA)-defined changes in total fat and visceral adipose tissue (VAT) mass. Change in the VAT mass was significantly associated with the baseline abundance of α-aminoadipate (p = 0.0007) and an additional mass spectrometry peak that may represent D-fructose, myo-inositol, mannose, α-D-glucose, allose, D-galactose, D-tagatose, or L-sorbose (p = 0.0001). This hypothesis-generating study reflects the potential of metabolomic biomarkers for the development of personalized dietary interventions.
Keywords: aging; body composition; heterogeneity; metabolomics; weight loss.
Conflict of interest statement
Medifast, Inc. provided partial funding for the study and made an in-kind product donation for the meal replacements used in the study. The terms of this arrangement were reviewed and approved by Wake Forest University Health Sciences in accordance with its conflict of interest policies. The funders had no role in the design of the study; in the collection, analyses, or interpretation of data; in the writing of the manuscript, or in the decision to publish the results.
Figures
References
-
- Batsis J.A., Gill L.E., Bs R.K.M., Adachi-Mejia A.M., Blunt H.B., Bagley P.J., Lopez-Jimenez F., Bartels S.J. Weight Loss Interventions in Older Adults with Obesity: A Systematic Review of Randomized Controlled Trials Since 2005. J. Am. Geriatr. Soc. 2016;65:257–268. doi: 10.1111/jgs.14514. - DOI - PMC - PubMed
Publication types
MeSH terms
Substances
Grants and funding
LinkOut - more resources
Full Text Sources
Medical
