Review
. 2020 Oct 19;20(20):5901.
doi: 10.3390/s20205901.

Label-Free Optical Resonator-Based Biosensors

Affiliations
Review

Label-Free Optical Resonator-Based Biosensors

Donggee Rho et al. Sensors (Basel). .

Abstract

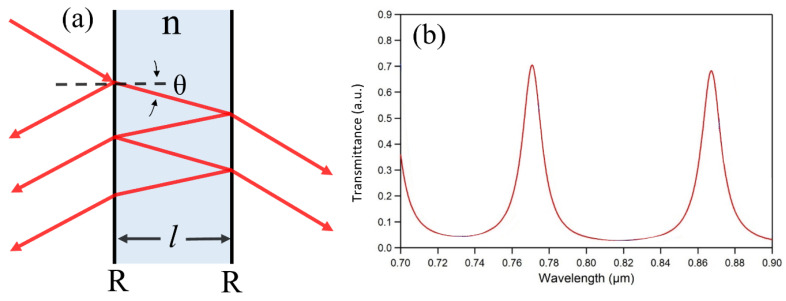
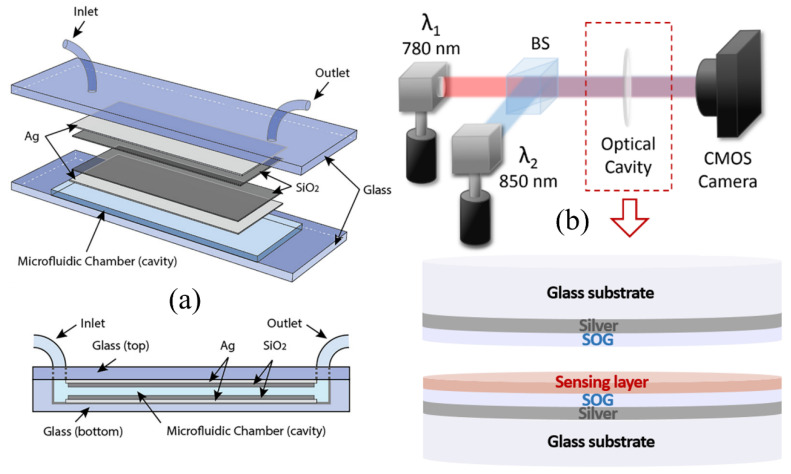
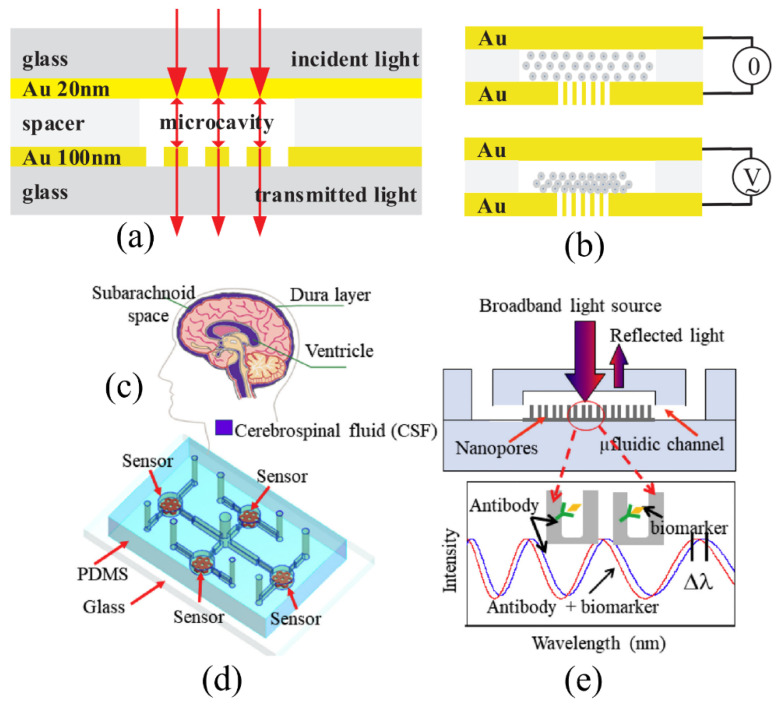
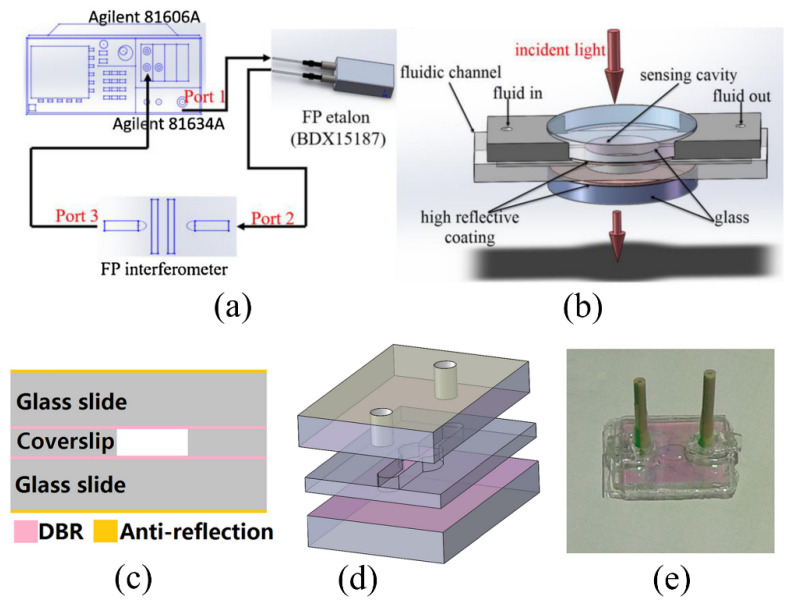
The demand for biosensor technology has grown drastically over the last few decades, mainly in disease diagnosis, drug development, and environmental health and safety. Optical resonator-based biosensors have been widely exploited to achieve highly sensitive, rapid, and label-free detection of biological analytes. The advancements in microfluidic and micro/nanofabrication technologies allow them to be miniaturized and simultaneously detect various analytes in a small sample volume. By virtue of these advantages and advancements, the optical resonator-based biosensor is considered a promising platform not only for general medical diagnostics but also for point-of-care applications. This review aims to provide an overview of recent progresses in label-free optical resonator-based biosensors published mostly over the last 5 years. We categorized them into Fabry-Perot interferometer-based and whispering gallery mode-based biosensors. The principles behind each biosensor are concisely introduced, and recent progresses in configurations, materials, test setup, and light confinement methods are described. Finally, the current challenges and future research topics of the optical resonator-based biosensor are discussed.

Keywords: Fabry-Perot interferometer; label-free biosensors; optical resonators; whispering gallery mode resonators.


Conflict of interest statement

The authors declare no conflict of interest.

Figures

Figure 1
Figure 1
(a) Structure of FPI. (b) Transmission spectrum of FPI.
Figure 2
Figure 2
The FPI-based biosensors with two planar-parallel reflecting surfaces. (a) Structure of the proposed biosensor in 3D and cross-sectional views. Reproduced from ref. [37] with permission from Elsevier. (b) Schematic diagram of the proposed device with the optical cavity structure. Reproduced from ref. [41] with permission © The Optical Society of America.
Figure 3
Figure 3
Nanostructures employed at one side of the FPI. (a) Schematic of the μFPI. (b) Concept of DEP. Reproduced from ref. [43] with permission from Elsevier. (c) The indicated location of CSF. (d) Schematic of a chip with four nanoFPIs. (e) The working principle of nanoFPI. Reproduced from ref. [45] with permission from Elsevier.
Figure 4
Figure 4
(a) Schematic of the two cascaded FPIs system. (b) The sensing FPI. Reproduced from ref. [52] with permission from Elsevier. (c) Schematic of the FPI employing two DBRs. (d) Fabrication process. (e) Image of the fabricated sensor. Reproduced from ref. [36] with permission © The Optical Society of America.
Figure 5
Figure 5
Schematics of the FPI-incorporated surface stress sensor. (a) Transducing procedure showing the deflection of the movable membrane film as target molecules adsorb to it. (b) Anti-BSA immobilization. (c) Spectrum measurement. Reproduced from ref. [40] with permission from IOPscience.
Figure 6
Figure 6
(a) Schematic of the biolayer created on the microarray biochip. (b) Schematic of the optical system for the proposed biosensor. Reproduced from ref. [53] with permission from Elsevier.
Figure 7
Figure 7
(a) (left) Current density used to fabricate two DBRs. (middleright) Narrow resonance peak using the PSM structure of 8 layers for DBR1 and 20 layers for DBR2. (b) SEM images of the PSM. (c) PSM measurement results for bacteria concentrations. Reproduced from ref. [58] with permission from IOPscience. (d) PSM measurement results for DNA concentrations. Reproduced from ref. [55] with permission from Elsevier.
Figure 8
Figure 8
(a) Schematic of the spectrometer-free PSM method. (b) Shift in transmission angular spectrum during the surface functionalization. (c) Shift by the antigen-antibody. (d) Measurement results for the concentrations of the hydatid antigen. Reproduced from Open Access Article [61] in Springer Nature.
Figure 9
Figure 9
(a) Detection of the atrazine pesticide in two different buffers. Reproduced from Open Access Article [59] in IOP Publishing. (b) Measured resonance peak in real-time as water infiltrated to PSM. Reproduced from Open Access Article [56] in MDPI. (c) Schematic of the smartphone-based system. (d) BPF spectrum and the change in normalized transmittance with the adsorption. (e) Measurement results for the concentration of streptavidin. Reproduced from ref. [60] with permission from The Royal Society of Chemistry.
Figure 10
Figure 10
Schematic of the optical fiber FPI. Reproduced from ref. [70] with permission from Elsevier.
Figure 11
Figure 11
(a) Schematic of optical fiber FPI-based sensor using hydrogel. Reproduced from ref. [71] with permission from IEEE. (b) Schematic of optical fiber FPI-based sensor using PDMS. Reproduced from ref. [72] with permission © The Optical Society of America.
Figure 12
Figure 12
Schematic of BLI. Reproduced from ref. [90] with permission from Elsevier.
Figure 13
Figure 13
Real-time detection using the tip immobilization procedure. Reproduced from Open Access Article [89] in Frontiers © 2020 Müller-Esparza, Osorio-Valeriano, Steube, Thanbichler and Randau.
Figure 14
Figure 14
(a) Real-time detection after introduction of GTX1/4 at concentrations in between 0.2 and 200 ng/mL. (b) Response versus concentrations. (c) Evaluation on specificity of the sensor using other toxins. Reproduced from ref. [92] with permission from Elsevier. (d) Binding of RepA protein to the dsDNA OP1. (e) Measurement results of testosterone. Reproduced from ref. [93] with permission from Elsevier.
Figure 15
Figure 15
(a) Schematic of the needle-type BLI sensor. (b) Real-time detection results with a glucose concentration of 500 mg/dL. (c) Responses for the different sizes of membrane pore. Reproduced from Open Access Article [96] in MDPI.
Figure 16
Figure 16
Coupling methods for WGM resonators. Reproduced from ref. [103] with permission from Elsevier.
Figure 17
Figure 17
Example WGM resonator system. Reproduced from Open Access Article [107] in MDPI.
Figure 18
Figure 18
(a) Schematic of the CMRR setup. (b,d) SEM images of the grating used as couplers in different areas of the sensor, and (c) SEM of the reference ring coupled to the input waveguide. (e) Output power changes as a result of varying concentrations of progesterone (red), testosterone (black), and the NIP control (white), to demonstrate specificity. (f) Linear fit of power versus progesterone concentration. Reproduced from ref. [112] with permission © The Optical Society of America.
Figure 19
Figure 19
(a) SEM overview of the slotted ring coupled to the input and output waveguides. (b) a magnified image of the coupling point between the ring and the input waveguide. (c) Schematic of the procedure for PSA detection using protein G. Reproduced from ref. [114] with permission from Elsevier.
Figure 20
Figure 20
(a) SEM images of SWG ring resonator. (b) Wavelength shifts as a result of anti-streptavidin (A), BSA (B), streptavidin (C), and biotinylated BSA (D) as the target analyte. The shaded gray lines along the graph indicate PBS rinsing. Reproduced from ref. [129] with permission © The Optical Society of America.
Figure 21
Figure 21
(a,b) SEM image of the microdisk resonator with a slot. (c) Intensity profile between the disks. (d) Microfluidic channel with the microdisk arrays. (e) Schematic of the proposed system. (f) Schematic of the system based on LED source. Reproduced from ref. [130] with permission © The Optical Society of America.
Figure 22
Figure 22
(a) HD structure. (b) mode field location based on simulations. (c) Shift in spectrum with human IgG in PBS. (d) Shift in spectra for human IgG in artificial serum. Reproduced from ref. [116] with permission from John Wiley and Sons.
Figure 23
Figure 23
Frequency shifts as a result of protein rhS100A4 binding. (a) depicts the low set of concentrations ranging from 0–30 nM, while (b) depicts higher order concentrations up to 3000 nM. (c) is the calibration curve for log concentrations versus the total frequency shift. Reproduced from ref. [117] with permission © The Optical Society of America.
Figure 24
Figure 24
(a) Wavelength shifts from Target ssDNA binding over time. (b) Target ssDNA wavelength shifts compared to equal concentrations of non-complementary strands and (c) single nucleotide mismatch strands from. Reproduced from ref. [137] with permission from the author.
Figure 25
Figure 25
(a) Schematic of 5CB microdroplets detecting heavy metal ions. (b) Wavelength shifts associated with increasing concentrations of Cu(II) ions. (c) Schematic of the experimental setup used for HM ion detection. Droplets are fixed to the capillary connected to a syringe pump to control the droplet size in the medium. It is pumped by the laser shown through a tapered optical fiber. (d) specificity results for other heavy metals (blue), Cu(II), and acceptable minerals found in water (gray) at 400 pM concentrations. Reproduced from ref. [119] with permission © The Optical Society of America.
Figure 26
Figure 26
(a) Spectral shifts for corresponding configurations. (b) shift response for increasing concentrations of AChE. Reproduced from ref. [118] with permission from Elsevier.
Figure 27
Figure 27
(a) Real-time responses of 2 different α-Exotoxin A conjugated microtoroid batches to Exotoxin A infusions in artificial sputum. (b) Wavelength shifts as a function of increased Exotoxin A concentration in artificial sputum. Adapted from ref. [140] with permission from ACS Publications.
Figure 28
Figure 28
(a) Corresponding wavelength shifts over 20 s for concentrations of hCG, ranging from 100 aM to 10 nM. (b) Schematic of the microtoroid chamber and optical fiber. (c) concentration curve resulting from (a). Reproduced from ref. [121] with permission from ACS Publications.
Figure 29
Figure 29
(a) Microscope image of the microcapillary resonator. (b) linear fitting for glucose concentration test performed in (c). (c) Measurement results for glucose detection. Reproduced from ref. [141] with permission © The Optical Society of America.

Similar articles

Cited by

References

    1. Quesada-González D., Merkoçi A. Nanomaterial-based devices for point-of-care diagnostic applications. Chem. Soc. Rev. 2018;47:4697–4709. doi: 10.1039/C7CS00837F. - DOI - PubMed
    1. Cheng N., Du D., Wang X., Liu D., Xu W., Luo Y., Lin Y. Recent advances in biosensors for detecting cancer-derived exosomes. Trends Biotechnol. 2019;37:1236–1254. doi: 10.1016/j.tibtech.2019.04.008. - DOI - PubMed
    1. Shandilya R., Bhargava A., Bunkar N., Tiwari R., Goryacheva I.Y., Mishra P.K. Nanobiosensors: Point-of-care approaches for cancer diagnostics. Biosens. Bioelectron. 2019;130:147–165. doi: 10.1016/j.bios.2019.01.034. - DOI - PubMed
    1. Kirsch J., Siltanen C., Zhou Q., Revzin A., Simonian A. Biosensor technology: Recent advances in threat agent detection and medicine. Chem. Soc. Rev. 2013;42:8733–8768. doi: 10.1039/c3cs60141b. - DOI - PubMed
    1. Kozma P., Kehl F., Ehrentreich-Forster E., Stamm C., Bier F.F. Integrated planar optical waveguide interferometer biosensors: A comparative review. Biosens. Bioelectron. 2014;58:287–307. doi: 10.1016/j.bios.2014.02.049. - DOI - PubMed

MeSH terms

LinkOut - more resources