. 2020 Oct 19;10(10):1459.
doi: 10.3390/biom10101459.

Analysis of Amygdalin in Various Matrices Using Electrospray Ionization and Flowing Atmospheric-Pressure Afterglow Mass Spectrometry

Affiliations

Analysis of Amygdalin in Various Matrices Using Electrospray Ionization and Flowing Atmospheric-Pressure Afterglow Mass Spectrometry

Maria Guć et al. Biomolecules. .

Abstract

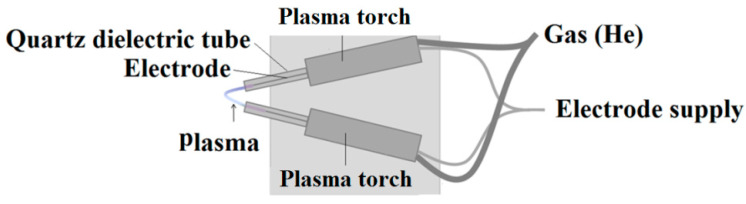
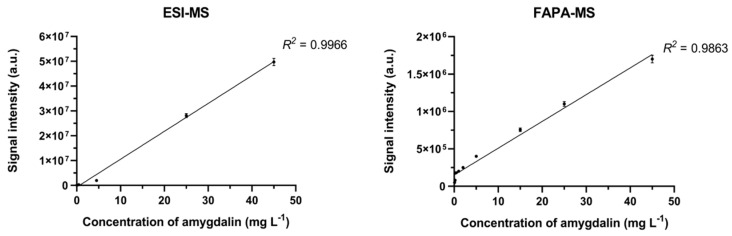
Amygdalin is a natural cyanogenic compound that plants produce in the fight against insects and herbivores. Excessive amounts of amygdalin by animals and humans can potentially lead to fatal intoxication. However, studies confirm that amygdalin has antitumor properties, including the ability to inhibit the proliferation of cancer cells and to induce their apoptosis. The analysis of amygdalin in various matrices is an important analytical problem today. The publication presents the methodology of direct determination of amygdalin in water, sewage, and biological materials using electrospray ionization mass spectrometry (ESI-MS) and a new analytical method using flowing atmospheric-pressure afterglow mass spectrometry (FAPA-MS). The methods of analyte pre-concentration using a magnetic, molecularly imprinted polymer (mag-MIP) and the influence of interferents on the recorded spectra were discussed. Analytical parameters in ESI-MS and FAPA-MS methods were established. The linearity range was 4.5 µg L-1-45 mg L-1 in positive mode ESI-MS and FAPA-MS. The limit of detection (LOD) for ESI-MS was 0.101 ± 0.003 µg L-1 and the limit of quantification (LOQ) was 0.303 ± 0.009 µg L-1. In FAPA-MS, the LOD was 0.050 ± 0.002 µg L-1 and the LOQ was 0.150 ± 0.006 µg L-1. The content of amygdalin in various matrices was determined.

Keywords: ESI-MS; FAPA-MS; amygdalin; mag-MIP.


Conflict of interest statement

The authors declare no conflict of interest.

Figures

Figure 1
Figure 1
Amygdalin structural formula.
Figure 2
Figure 2
Scheme of V-FAPA (flowing atmospheric-pressure afterglow) ambient plasma source.
Figure 3
Figure 3
The measuring system: plasma torch, heated sample holder, and amaZon SL mass spectrometer.
Figure 4
Figure 4
The electrospray ionization mass spectrometry (ESI-MS) spectrum of amygdalin performed in a buffer solution of pH 7.0 (disodium hydrogen phosphate and citric acid): (a) positive mode, (b) negative mode.
Figure 5
Figure 5
The ESI-MS spectrum of amygdalin performed in a buffer solution of pH 2.0 (hydrochloric acid, sodium chloride, and aminoacetic acid): (a) positive mode, (b) negative mode.
Figure 6
Figure 6
The ESI-MS spectrum of amygdalin performed in a buffer solution of pH 10.0 (boric acid, potassium chloride, and sodium hydroxide): (a) positive mode, (b) negative mode.
Figure 7
Figure 7
The ESI-MS spectrum of amygdalin performed in solutions with the addition of various ions: (a) Cu2+, (b) Pb2+, (c) Ca2+, (d) Na+, (e) K+.
Figure 7
Figure 7
The ESI-MS spectrum of amygdalin performed in solutions with the addition of various ions: (a) Cu2+, (b) Pb2+, (c) Ca2+, (d) Na+, (e) K+.
Figure 8
Figure 8
The positive mode FAPA-MS spectrum of amygdalin in 45 mg L-1 aqueous solution.
Figure 9
Figure 9
Dependence of signal intensity vs. amygdalin concentration in the sample.
Figure 10
Figure 10
HPLC-diode array chromatogram of amygdalin solution (0.5 mg mL−1).
Figure 11
Figure 11
UV spectrum of amygdalin, HPLC retention time tR = 6.33 min.
Figure 12
Figure 12
Full scan spectrum of amygdalin, HPLC retention time tR = 6.33 min, m/z 456 [M − H], m/z 950 [2M + Cl], m/z 492 [M + Cl], m/z 475 [M + Na]+, m/z 496 [M + K]+, and m/z 938 [2M + Na]+.
Figure 13
Figure 13
Dependence of signal intensity vs. amygdalin concentration in the sample.
Figure 14
Figure 14
Scheme of Fe3O4@SiO2@VIN@MIP synthesis.
Figure 15
Figure 15
Release and binding of amygdalin in Fe3O4@SiO2@VIN@MIP-amygdalin/Fe3O4@SiO2@VIN@MIP.
Figure 16
Figure 16
X-ray fluorescence (XRF) spectrum of Fe3O4@SiO2@VIN@MIP.
Figure 17
Figure 17
The concentration of amygdalin over time in solution after addition of Fe3O4@SiO2@VIN@MIP. C0 = 45 mg L−1 (a), 0.45 mg L−1 (b), and 4.5 μg L−1 (c).
Figure 18
Figure 18
The amount of amygdalin released over time in solution after addition Fe3O4@SiO2@VIN@MIP-amygdalin.
Figure 19
Figure 19
FAPA-MS2 fragmentation spectrum of the m/z 313 ion observed for amygdalin.
Figure 20
Figure 20
FAPA-MS spectrum of amygdalin in human serum at 200 °C.
Figure 21
Figure 21
FAPA-MS spectrum of amygdalin in human serum at 340 °C.

References

    1. Bolarinwa I.F., Orfila C., Morgan M.R.A. Amygdalin content of seeds, kernels and food products commercially-available in the UK. Food Chem. 2014;152:133–139. doi: 10.1016/j.foodchem.2013.11.002. - DOI - PubMed
    1. Cairns T., Froberg J.E., Gonzales S., Langham W.S., Stamp J.J., Howie J.K., Sawyer D.T. Analytical Chemistry of Amygdalin. Anal. Chem. 1978;50:317–322. doi: 10.1021/ac50024a037. - DOI
    1. Wahab M.F., Breitbach Z.S., Armstrong D.W., Strattan R., Berthod A. Problems and Pitfalls in the Analysis of Amygdalin and Its Epimer. J. Agric. Food Chem. 2015;63:8966–8973. doi: 10.1021/acs.jafc.5b03120. - DOI - PubMed
    1. Akah P., Alemji J. Studies on the effects of Vernonia amygdalina leaf extract and fractions on biochemical and hematological parameters in diabetic rats. Planta Med. 2009:75–82. doi: 10.1055/s-0029-1234707. - DOI
    1. Alara O.R., Kholijah S., Mudalip A., Olalere O.A. Phytochemical And Pharmacological Properties Of Vernonia amygdalina: A Review Ultrasonic assisted crystallization process View project Biological activity of mushrooms extracts adsorbed on SZN View project. J. Chem. Eng. Ind. Biotechnol. Open Access. 2017;2:80–96.

Publication types

MeSH terms