

Effect of Gosha-Jinki-Gan on Levels of Specific mRNA Transcripts in Mouse Testes after Busulfan Treatment
- PMID: 33086656
- PMCID: PMC7603379
- DOI: 10.3390/biomedicines8100432
Effect of Gosha-Jinki-Gan on Levels of Specific mRNA Transcripts in Mouse Testes after Busulfan Treatment
Abstract
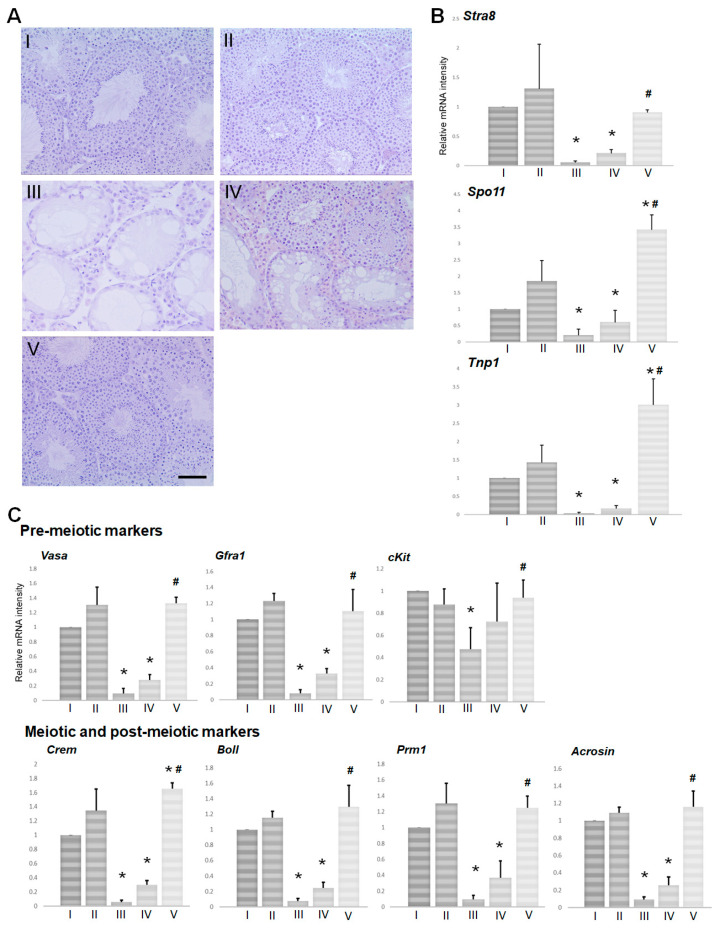
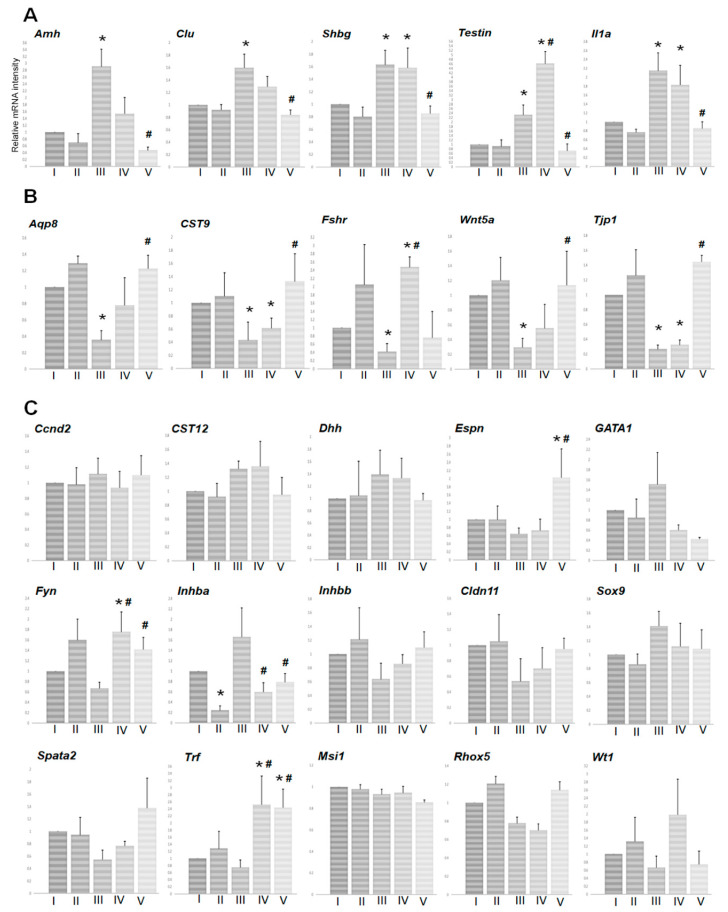
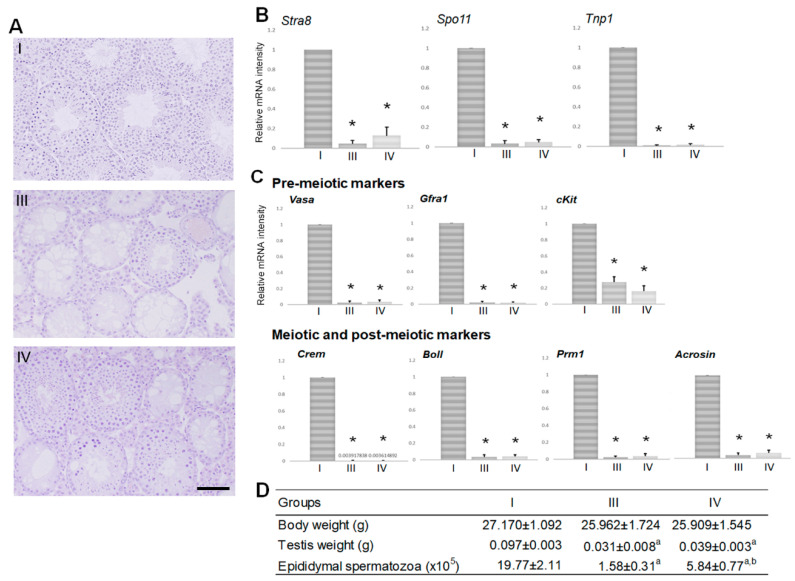
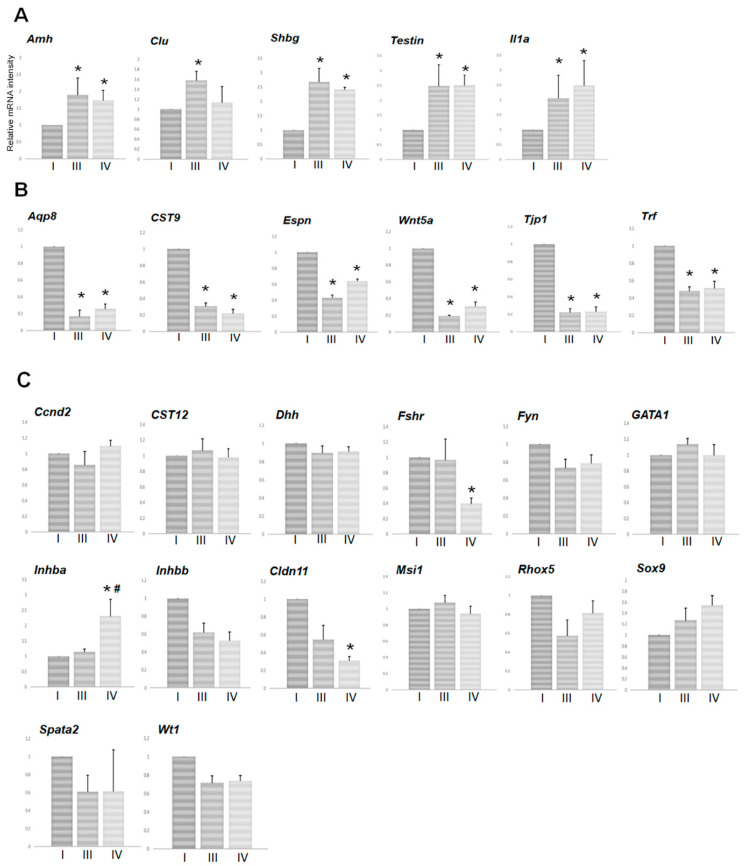
With the increase in survival rates of cancer patients in recent years, infertility caused by anticancer treatments has become a significant concern for cancer survivors. Some studies have suggested that Sertoli cells play a key role in mediating testicular immunology in busulfan-induced aspermatogenesis. We recently demonstrated that Gosha-jinki-gan (TJ107), a traditional Japanese medicine, can completely recover injured spermatogenesis in mice 60 days after busulfan injection. In the present study, we sought to examine the levels of mRNA transcripts encoding markers of 25 Sertoli cell-specific products and 10 markers of germ cell differentiation. Our results demonstrated that only supplementation of TJ107 at day 60 after busulfan injection could significantly recover the increase in five mRNA species (Amh, Clu, Shbg, Testin, and Il1a) and the decrease in four mRNA species (Aqp8, CST9, Wnt5a, and Tjp1) in response to Busulfan (BSF) at day 120, with the increase of all examined spermatogenic markers.
Keywords: anticancer treatment; aspermatogenesis; oriental medicine; specific mRNA transcript.
Conflict of interest statement
The authors declare no conflict of interest. The funders had no role in the design of the study; in the collection, analyses, or interpretation of data; in the writing of the manuscript; or in the decision to publish the results.
Figures
Similar articles
-
Gosha-Jinki-Gan Recovers Spermatogenesis in Mice with Busulfan-Induced Aspermatogenesis.Int J Mol Sci. 2018 Sep 3;19(9):2606. doi: 10.3390/ijms19092606. Int J Mol Sci. 2018. PMID: 30177609 Free PMC article.
-
Co-Administration of the Traditional Medicines Hachimi-Jio-Gan and Hochu-Ekki-To Can Reverse Busulfan-Induced Aspermatogenesis.Int J Mol Sci. 2020 Mar 3;21(5):1716. doi: 10.3390/ijms21051716. Int J Mol Sci. 2020. PMID: 32138301 Free PMC article.
-
The effectiveness of traditional Japanese medicine Goshajinkigan in irradiation-induced aspermatogenesis in mice.BMC Complement Altern Med. 2019 Dec 11;19(1):362. doi: 10.1186/s12906-019-2786-z. BMC Complement Altern Med. 2019. PMID: 31829240 Free PMC article.
-
Effect of Gosha-jinki-gan, a blended herbal medicine, on bladder activity in rats.J Urol. 2007 Feb;177(2):762-5. doi: 10.1016/j.juro.2006.09.077. J Urol. 2007. PMID: 17222677
-
Nociceptin and meiosis during spermatogenesis in postnatal testes.Vitam Horm. 2015;97:167-86. doi: 10.1016/bs.vh.2014.10.003. Epub 2015 Jan 14. Vitam Horm. 2015. PMID: 25677772 Review.
Cited by
-
Pharmacological Effects and Immune Mechanisms of Oriental Medicines in Restoring Male Infertility.Int J Mol Sci. 2025 May 13;26(10):4642. doi: 10.3390/ijms26104642. Int J Mol Sci. 2025. PMID: 40429786 Free PMC article. Review.
-
Changes in Expression of Specific mRNA Transcripts after Single- or Re-Irradiation in Mouse Testes.Genes (Basel). 2022 Jan 15;13(1):151. doi: 10.3390/genes13010151. Genes (Basel). 2022. PMID: 35052491 Free PMC article.
References
-
- Choi Y.J., Ok D.W., Kwon D.N., Chung J.I., Kim H.C., Yeo S.M., Kim T., Seo H.G., Kim J.H. Murine male germ cell apoptosis induced by busulfan treatment correlates with loss of c-kit-expression in a Fas/FasL- and p53-independent manner. FEBS Lett. 2004;575:41–51. doi: 10.1016/j.febslet.2004.08.034. - DOI - PubMed
LinkOut - more resources
Full Text Sources
Research Materials
Miscellaneous
