. 2020 Oct 19;9(10):2323.
doi: 10.3390/cells9102323.

Clock-Controlled Mitochondrial Dynamics Correlates with Cyclic Pregnenolone Synthesis

Affiliations

Clock-Controlled Mitochondrial Dynamics Correlates with Cyclic Pregnenolone Synthesis

Melissa Witzig et al. Cells. .

Abstract

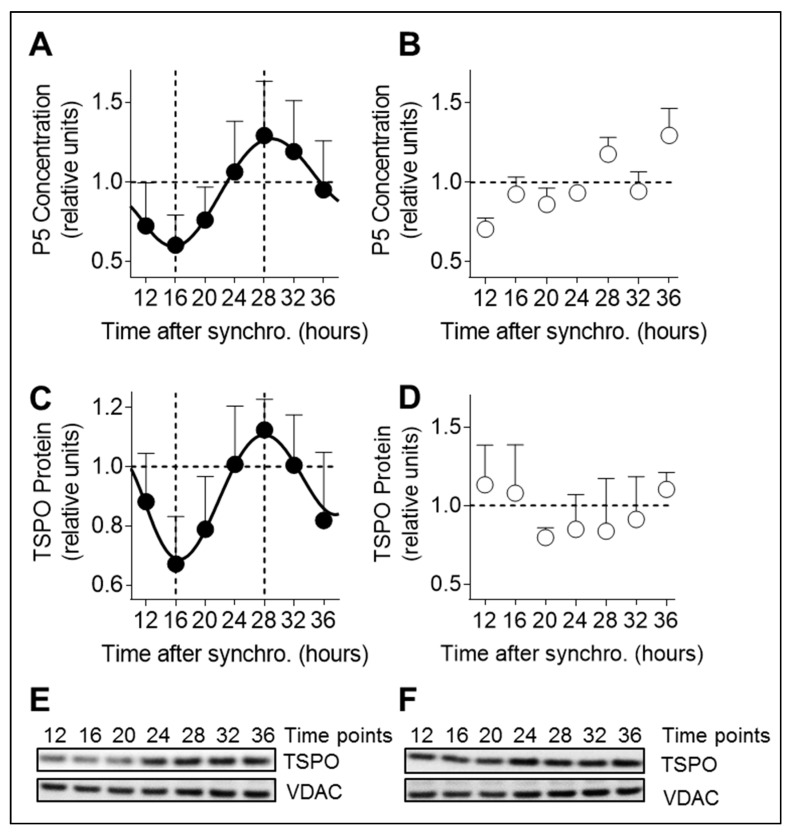
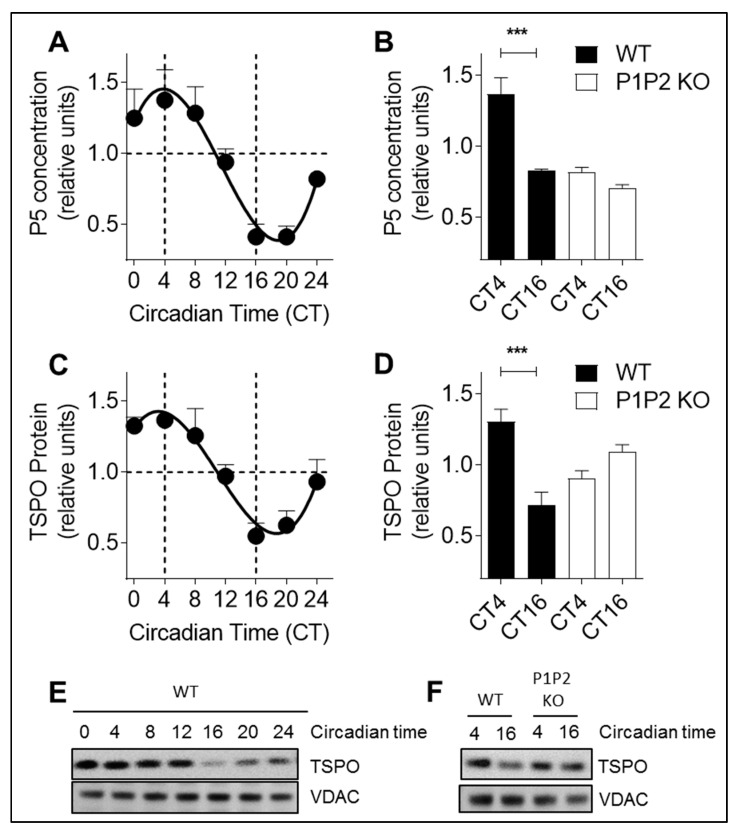
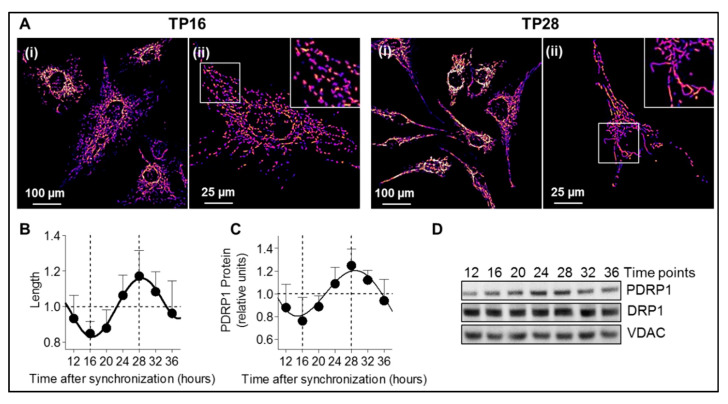
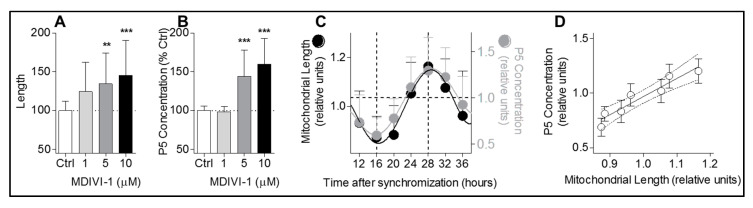
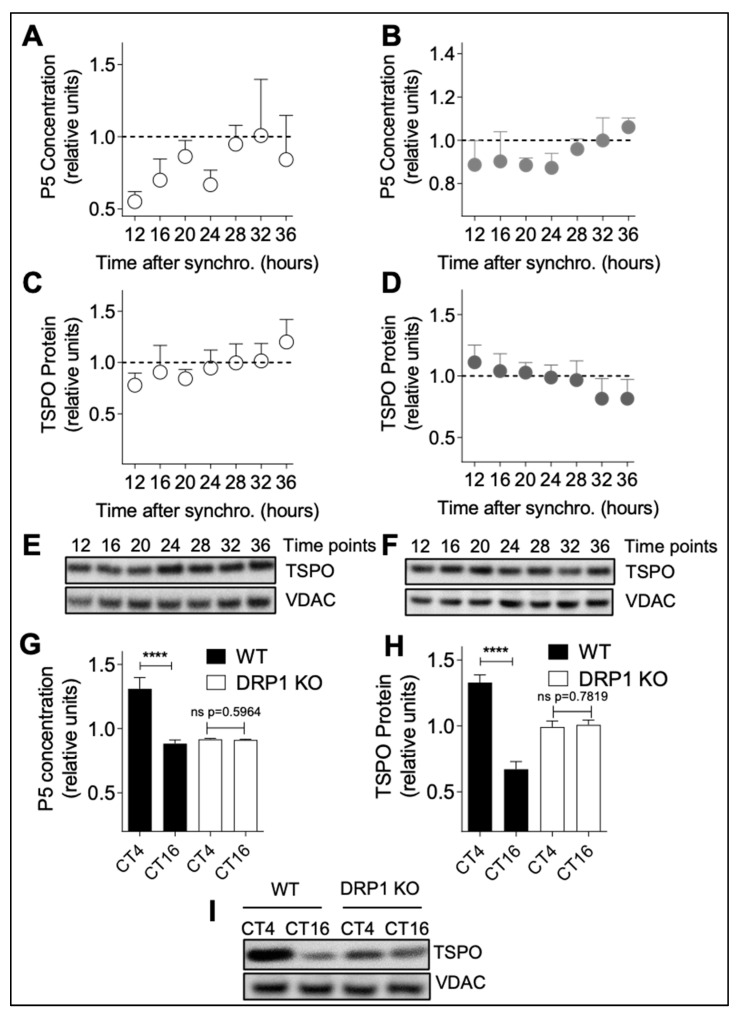
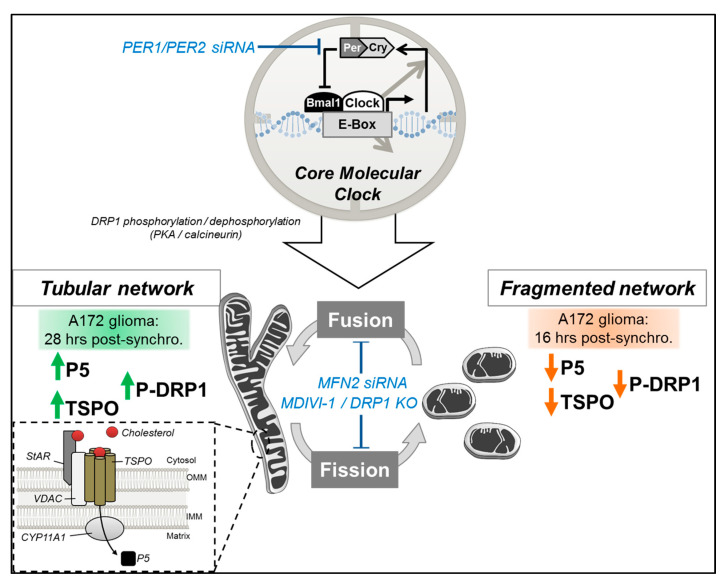
Neurosteroids are steroids synthetized in the nervous system, with the first step of steroidogenesis taking place within mitochondria with the synthesis of pregnenolone. They exert important brain-specific functions by playing a role in neurotransmission, learning and memory processes, and neuroprotection. Here, we show for the first time that mitochondrial neurosteroidogenesis follows a circadian rhythm and correlates with the rhythmic changes in mitochondrial morphology. We used synchronized human A172 glioma cells, which are steroidogenic cells with a functional core molecular clock, to show that pregnenolone levels and translocator protein (TSPO) are controlled by the clock, probably via circadian regulation of mitochondrial fusion/fission. Key findings were recapitulated in mouse brains. We also showed that genetic or pharmacological abrogation of fusion/fission activity, as well as disturbing the core molecular clock, abolished circadian rhythms of pregnenolone and TSPO. Our findings provide new insights into the crosstalk between mitochondrial function (here, neurosteroidogenesis) and circadian cycles.

Keywords: circadian clock; mitochondrial dynamics; neurosteroid; pregnenolone.


Conflict of interest statement

The authors declare no conflict of interest.

Figures

Figure 1
Figure 1
Pregnenolone and TSPO oscillations are dependent on a functional circadian clock in A172 cells. (A) P5 (pregnenolone) concentration was quantified in lysates from synchronized A172 glioma cells using a direct pregnenolone ELISA test. Time points from 12 to 36 h post-synchronization are shown. All data are normalized to 1 and presented as mean ± SD (three independent experiments, seven time points, n = 12 for each time point). (B) P5 concentration in synchronized PER1/PER2 siRNA transfected A172 glioma cells. Time points from 12 to 36 h post-synchronization are shown. All data are normalized to 1 and presented as mean ± SD (three independent experiments, seven time points, n = 3–5 for each time point). (C) Translocator protein (TSPO) levels were analyzed in cell lysates from synchronized A172 glioma cells by immunoblotting. Time points from 12 to 36 h post-synchronization are shown. All data are normalized to 1 and presented as mean ± SD (three independent experiments, seven time points, n = 4–6 for each time point). (D) TSPO protein levels in synchronized PER1/PER2 siRNA transfected A172 glioma cells. Time points from 12 to 36 h post-synchronization are shown. All data are normalized to 1 and presented as mean ± SD (two independent experiments, seven time points, n = 3–5 for each time point). (E) Representative immunoblots of synchronized A172 glioma cell lysates stained with antibodies specific for TSPO and VDAC (voltage-dependent anion-selective channel = control). Time points from 12 to 36 h post-synchronization are shown. (F) Representative immunoblots of synchronized PER1/PER2 siRNA transfected A172 cells stained with antibodies specific for TSPO and VDAC (control). Time points from 12 to 36 h post-synchronization are shown.
Figure 2
Figure 2
Pregnenolone and TSPO oscillations are dependent on a functional circadian clock in mouse brains. (A) P5 concentration was quantified in brain homogenates from non-fasted wild-type mice kept in constant darkness using a direct pregnenolone ELISA test. Circadian times from CT0 to CT24 are shown. All data are normalized to 1 and presented as mean ± SEM (one experiment, seven time points, n = 3–4 for each time point). (B) Variations in P5 concentration are abolished in PER1/PER2 (P1P2) knock-out (P1P2 KO) mice. P5 levels at peak and trough corresponding to CT4 and CT16 from brain homogenates of wild-type (WT) mice compared to P1P2 KO mice. All data are normalized to 1 and presented as mean ± SEM (WT and P1P2 KO: one experiment, two time points, nWT = 8 and nP1P2 KO = 3–4 for each time point). *** p < 0.001 (unpaired Student’s t-test). (C) TSPO protein levels were analyzed in brain homogenates from non-fasted wild-type mice kept in constant darkness by immunoblotting. Circadian times from CT0 to CT24 are shown. All data are normalized to 1 and presented as mean ± SEM (one experiment, seven time points, n = 2–3 for each time point). (D) Variations in TSPO protein levels are abolished in PER1/PER2 (P1P2) knock-out (P1P2 KO) mice. TSPO levels at peak and trough corresponding to CT4 and CT16 from brain homogenates of WT mice compared to P1P2 KO mice. All data are normalized to 1 and presented as mean ± SEM (WT and P1P2 KO: one experiment, two time points, nWT = 8 and nP1P2 KO = 3–4 for each time point). *** p < 0.001 (unpaired Student’s t-test). (E,F) Representative immunoblots of brain lysates from non-fasted wild-type mice kept in constant darkness stained with antibodies specific for TSPO and VDAC (control). (E) Circadian times from CT0 to CT24 are shown for wild-type animals (WT). (F) Circadian times CT4 and CT 16 (corresponding to peak and trough) are shown for WT and PER1/PER2 knock-out (P1P2 KO) animals.
Figure 3
Figure 3
Mitochondrial network morphology shows a circadian rhythmicity in A172 glioma cells. (A) Mitochondrial network morphology assessed in synchronized A172 glioma cells transfected with mitochondrially-targeted GFP (false color “fire”) at 16 h and 28 h, corresponding to a fragmented network and a tubular network, respectively. For each representative image, a zoom-in image is shown (400%). Scale bars: 100 µm (i) and 25 µm (ii). The complete cycle (from time point 12 to 36) is shown in Supplementary Figure S2. (B) Quantification of mitochondrial length in synchronized A172 glioma cells transfected with mitochondrially-targeted GFP from 12 to 36 h post-synchronization. All data are normalized to 1 and presented as mean ± SD (two independent experiments, seven time points). About 40 images containing 3000–5000 mitochondria were analyzed per time point. (C) Phospho-DRP1 (PDRP1 = dynamin-related protein 1 phosphorylated at serine 637) protein level was analyzed in cell lysates from synchronized A172 glioma cells by immunoblotting. Time points from 12 to 36 h post-synchronization are shown. All data are normalized to 1 and presented as mean ± SD (three independent experiments, seven time points, n = 4–6 for each time point). (D) Representative immunoblots of synchronized A172 glioma cell lysates stained with antibodies specific for phospho-DRP1 (PDRP1), DRP1 (total DRP1), and VDAC (control). Time points from 12 to 36 h post-synchronization are shown.
Figure 4
Figure 4
Changes in mitochondrial morphology correlate with rhythmic pregnenolone production. (A) Mitochondrial length was quantified after MDIVI-1 (1, 5, and 10 μM) treatment in A172 glioma cells transfected with mitochondrially-targeted green fluorescent protein (GFP). All data are normalized to untreated control (100%) and presented as mean ± SD (two independent experiments, n = 33–37 cells for each condition). ** p < 0.01, *** p < 0.001 (one way-ANOVA with Dunnett’s multiple comparison test versus control (Ctrl)). (B) Quantification of P5 concentration in supernatant of A172 cells after MDIVI-1 administration (1, 5, and 10 μM) compared to untreated control. All data are normalized on untreated control (100%) and represent mean ± SD (two independent experiments, n = 6–10 for each condition). *** p < 0.01 (one way-ANOVA with Dunnett’s multiple comparison test versus control (Ctrl)). (C) Mitochondrial length and P5 levels cycles are in-phase. Combined graph of P5 concentration (Figure 1A) and mitochondrial length (Figure 3B). Time points from 12 to 36 h post-synchronization are shown. (D) P5 levels correlate with mitochondrial length. Graph represents the values of mitochondrial length around the clock in abscissa versus the values of P5 concentration around the clock in ordinate. Values represent the mean ± SD of each time point. Pearson correlation r = 0.9539, r2 = 0.91, p-value = 0.0009.
Figure 5
Figure 5
Disrupted mitochondrial dynamics abolish circadian variations of pregnenolone and TSPO. (A) P5 concentration was measured in lysates from synchronized A172 glioma cells chronically treated with 5 μM MDIVI-1. Time points from 12 to 36 h post-synchronization are shown. All data are normalized to 1 and presented as mean ± SD (two independent experiments, seven time points, n = 4–8 for each time point). (B) P5 concentration was measured in lysates from synchronized mitofusion 2 (MFN2) siRNA transfected A172 glioma cells. Time points from 12 to 36 h post-synchronization are shown. All data are normalized to 1 and presented as mean ± SD (two experiment, seven time points, n = 4–5 for each time point). (C) TSPO protein levels were analyzed by immunoblotting in lysates from synchronized A172 glioma cells chronically treated with 5 μM MDIVI-1. Time points from 12 to 36 h post-synchronization are shown. All data are normalized to 1 and presented as mean ± SD (two independent experiments, seven time points, n = 6–8 for each time point). (D) TSPO protein expression was analyzed by immunoblotting in lysates from synchronized A172 glioma cells transfected with MFN2 siRNA. Time points from 12 to 36 h post-synchronization are shown. All data are normalized to 1 and presented as mean ± SD (two experiments, seven time points, n = 3–6 for each time point). (E,F) Representative immunoblots of lysates from synchronized MDIVI-1 treated A172 glioma cells (E) and MFN2 siRNA transfected cells (F) stained with antibodies specific for TSPO and VDAC (control). Time points from 12 to 36 h post-synchronization are shown. (G,H) Rhythmic changes in P5 levels (G) and TSPO protein expression (H) are abolished in DRP1 knock-out mice. TSPO levels at peak and trough corresponding to CT4 and CT16 from brain homogenates of wild-type mice compared to DRP1 knock-out (DRP1 KO) mice. All data are normalized to 1 and presented as mean ± SEM (WT and DRP1 KO: two time points, nWT = 5 and nDRP1 KO = 9 for each time point). **** p < 0.0001 (unpaired Student’s t-test). (I) Representative immunoblots of brain lysates from wild-type (WT) and Drp1 knockout (DRP1 KO) mice stained with antibodies specific for TSPO and VDAC (control). Time points CT4 and CT16 are shown.
Figure 6
Figure 6
Schematic representation of the relationship between the core molecular clock, mitochondrial dynamics, and neurosteroid synthesis. The clock-controlled mitochondrial morphology correlate with mitochondrial neurosteroidogenesis, with high P5 and TSPO levels detected after fusion (increased P-DRP1 and mitochondrial elongation), and low P5 and TSPO levels after fission (decreased P-DRP1 and mitochondrial fragmentation). Circadian variations of P5 and TSPO are abolished when mitochondrial dynamics are disturbed (e.g., by MFN2 siRNA or MDIVI-1) or when the core molecular clock is affected (siRNA-mediated knockdown of PER1/PER2). CYP11A1: cytochrome P450 side-chain cleavage enzyme, IMM: inner mitochondrial membrane, OMM: outer mitochondrial membrane, MFN2: mitofusin 2, P5: pregnenolone, P-DRP1: dynamin-related protein 1 phosphorylated at serine 637, PER1/PER2: Period 1/2, TSPO: translocator protein, StAR: steroidogenic acute regulatory protein; “T” symbol: inhibition; ↑: increase, ↓: decrease.

Similar articles

Cited by

References

    1. Jordan S.D., Lamia K.A. AMPK at the crossroads of circadian clocks and metabolism. Mol. Cell. Endocrinol. 2013;366:163–169. doi: 10.1016/j.mce.2012.06.017. - DOI - PMC - PubMed
    1. Ko C.H., Takahashi J.S. Molecular components of the mammalian circadian clock. Hum. Mol. Genet. 2006;15(Suppl. 2):R271–R277. doi: 10.1093/hmg/ddl207. - DOI - PubMed
    1. Albrecht U. Timing to Perfection: The Biology of Central and Peripheral Circadian Clocks. Neuron. 2012;74:246–260. doi: 10.1016/j.neuron.2012.04.006. - DOI - PubMed
    1. Corpechot C., Robel P., Axelson M., Sjovall J., Baulieu E.E. Characterization and measurement of dehydroepiandrosterone sulfate in rat brain. Proc. Natl. Acad. Sci. USA. 1981;78:4704–4707. doi: 10.1073/pnas.78.8.4704. - DOI - PMC - PubMed
    1. Melcangi R.C., Giatti S., Garcia-Segura L.M. Levels and actions of neuroactive steroids in the nervous system under physiological and pathological conditions: Sex-specific features. Neurosci. Biobehav. Rev. 2016;67:25–40. doi: 10.1016/j.neubiorev.2015.09.023. - DOI - PubMed

Publication types

LinkOut - more resources