

Improved personalized survival prediction of patients with diffuse large B-cell Lymphoma using gene expression profiling
- PMID: 33087075
- PMCID: PMC7579992
- DOI: 10.1186/s12885-020-07492-y
Improved personalized survival prediction of patients with diffuse large B-cell Lymphoma using gene expression profiling
Abstract
Background: Thirty to forty percent of patients with Diffuse Large B-cell Lymphoma (DLBCL) have an adverse clinical evolution. The increased understanding of DLBCL biology has shed light on the clinical evolution of this pathology, leading to the discovery of prognostic factors based on gene expression data, genomic rearrangements and mutational subgroups. Nevertheless, additional efforts are needed in order to enable survival predictions at the patient level. In this study we investigated new machine learning-based models of survival using transcriptomic and clinical data.
Methods: Gene expression profiling (GEP) of in 2 different publicly available retrospective DLBCL cohorts were analyzed. Cox regression and unsupervised clustering were performed in order to identify probes associated with overall survival on the largest cohort. Random forests were created to model survival using combinations of GEP data, COO classification and clinical information. Cross-validation was used to compare model results in the training set, and Harrel's concordance index (c-index) was used to assess model's predictability. Results were validated in an independent test set.
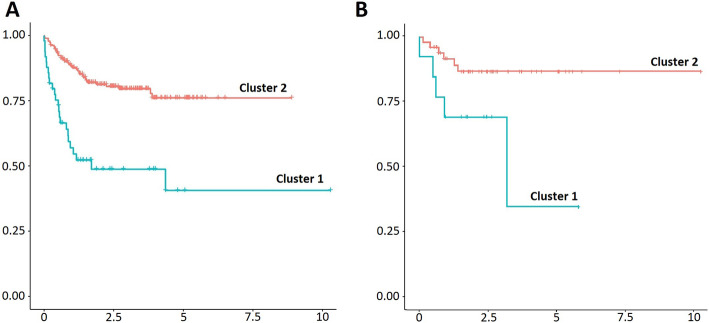
Results: Two hundred thirty-three and sixty-four patients were included in the training and test set, respectively. Initially we derived and validated a 4-gene expression clusterization that was independently associated with lower survival in 20% of patients. This pattern included the following genes: TNFRSF9, BIRC3, BCL2L1 and G3BP2. Thereafter, we applied machine-learning models to predict survival. A set of 102 genes was highly predictive of disease outcome, outperforming available clinical information and COO classification. The final best model integrated clinical information, COO classification, 4-gene-based clusterization and the expression levels of 50 individual genes (training set c-index, 0.8404, test set c-index, 0.7942).
Conclusion: Our results indicate that DLBCL survival models based on the application of machine learning algorithms to gene expression and clinical data can largely outperform other important prognostic variables such as disease stage and COO. Head-to-head comparisons with other risk stratification models are needed to compare its usefulness.
Keywords: DLBCL; Lymphoma; Prediction; Survival; Transcriptomics.
Conflict of interest statement
The authors declare no competing interests.
Figures


References
MeSH terms
Substances
LinkOut - more resources
Full Text Sources
Research Materials
