

Airborne particulate matter, population mobility and COVID-19: a multi-city study in China
- PMID: 33087097
- PMCID: PMC7576551
- DOI: 10.1186/s12889-020-09669-3
Airborne particulate matter, population mobility and COVID-19: a multi-city study in China
Abstract
Background: Coronavirus disease 2019 (COVID-19) is an emerging infectious disease, which has caused numerous deaths and health problems worldwide. This study aims to examine the effects of airborne particulate matter (PM) pollution and population mobility on COVID-19 across China.
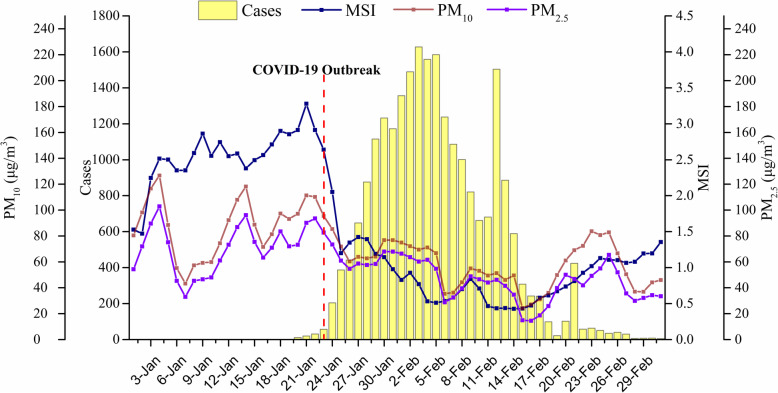
Methods: We obtained daily confirmed cases of COVID-19, air particulate matter (PM2.5, PM10), weather parameters such as ambient temperature (AT) and absolute humidity (AH), and population mobility scale index (MSI) in 63 cities of China on a daily basis (excluding Wuhan) from January 01 to March 02, 2020. Then, the Generalized additive models (GAM) with a quasi-Poisson distribution were fitted to estimate the effects of PM10, PM2.5 and MSI on daily confirmed COVID-19 cases.
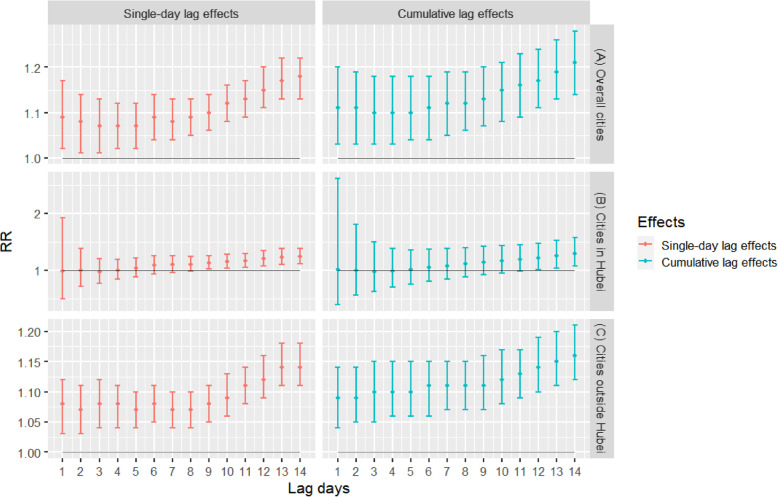
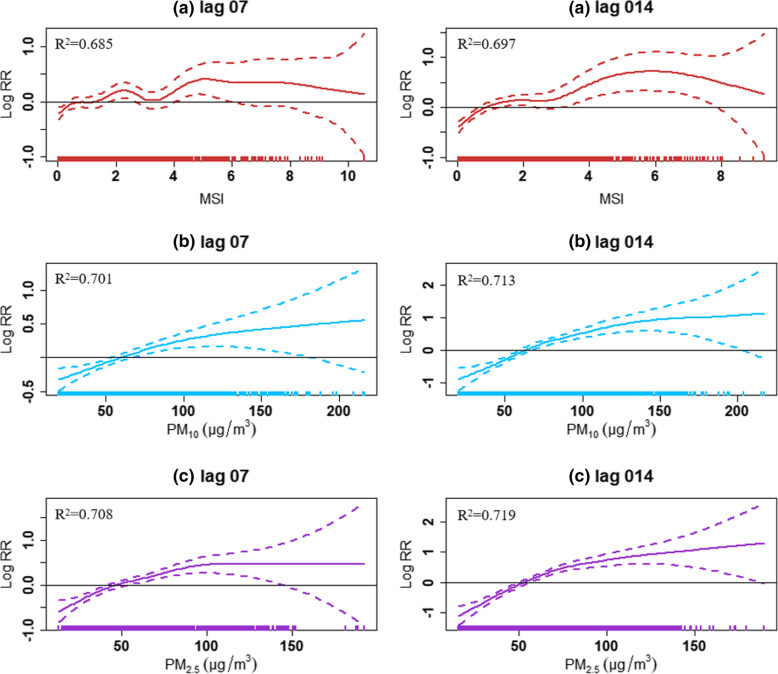
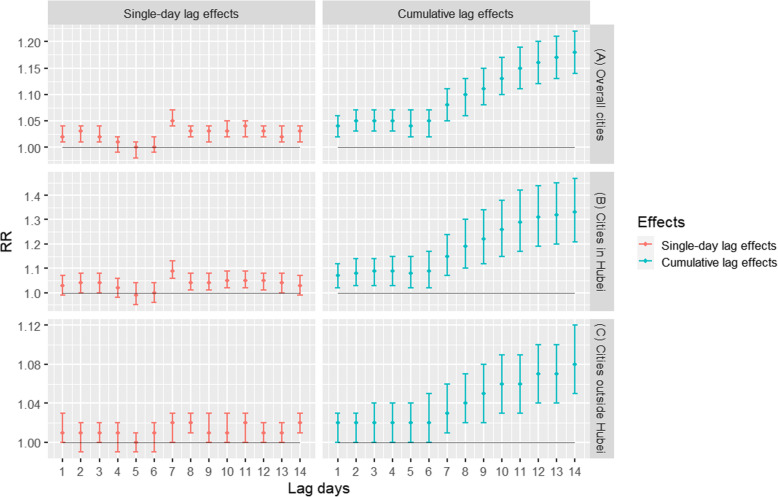
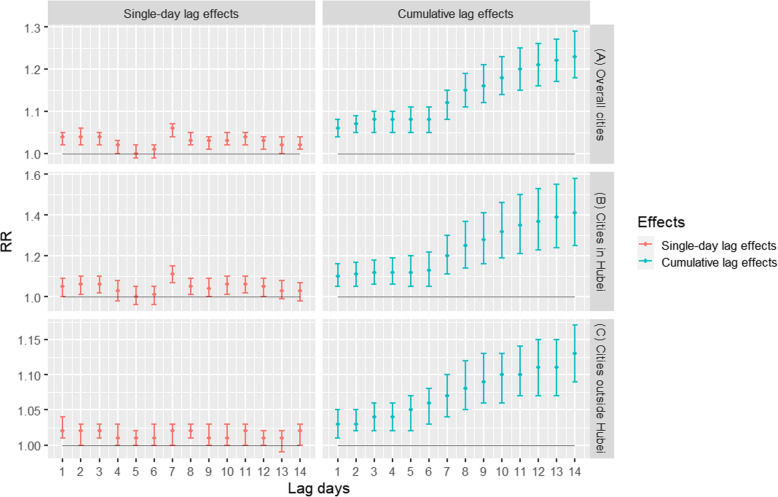
Results: We found each 1 unit increase in daily MSI was significantly positively associated with daily confirmed cases of COVID-19 in all lag days and the strongest estimated RR (1.21, 95% CIs:1.14 ~ 1.28) was observed at lag 014. In PM analysis, we found each 10 μg/m3 increase in the concentration of PM10 and PM2.5 was positively associated with the confirmed cases of COVID-19, and the estimated strongest RRs (both at lag 7) were 1.05 (95% CIs: 1.04, 1.07) and 1.06 (95% CIs: 1.04, 1.07), respectively. A similar trend was also found in all cumulative lag periods (from lag 01 to lag 014). The strongest effects for both PM10 and PM2.5 were at lag 014, and the RRs of each 10 μg/m3 increase were 1.18 (95% CIs:1.14, 1.22) and 1.23 (95% CIs:1.18, 1.29), respectively.
Conclusions: Population mobility and airborne particulate matter may be associated with an increased risk of COVID-19 transmission.
Keywords: COVID-19; Generalized additive models; Particulate matter; Population mobility.
Conflict of interest statement
The authors declare that they have no conflict of interest.
Figures
Similar articles
-
Assessing the relationship between surface levels of PM2.5 and PM10 particulate matter impact on COVID-19 in Milan, Italy.Sci Total Environ. 2020 Oct 10;738:139825. doi: 10.1016/j.scitotenv.2020.139825. Epub 2020 Jun 2. Sci Total Environ. 2020. PMID: 32512362 Free PMC article.
-
How Did Distribution Patterns of Particulate Matter Air Pollution (PM2.5 and PM10) Change in China during the COVID-19 Outbreak: A Spatiotemporal Investigation at Chinese City-Level.Int J Environ Res Public Health. 2020 Aug 28;17(17):6274. doi: 10.3390/ijerph17176274. Int J Environ Res Public Health. 2020. PMID: 32872261 Free PMC article.
-
Effect of ambient air pollutants and meteorological variables on COVID-19 incidence.Infect Control Hosp Epidemiol. 2020 Sep;41(9):1011-1015. doi: 10.1017/ice.2020.222. Epub 2020 May 11. Infect Control Hosp Epidemiol. 2020. PMID: 32389157 Free PMC article.
-
Air pollution and COVID-19: Is the connect worth its weight?Indian J Public Health. 2020 Jun;64(Supplement):S132-S134. doi: 10.4103/ijph.IJPH_466_20. Indian J Public Health. 2020. PMID: 32496243 Review.
-
An updated systematic review on the association between atmospheric particulate matter pollution and prevalence of SARS-CoV-2.Environ Res. 2021 Apr;195:110898. doi: 10.1016/j.envres.2021.110898. Epub 2021 Feb 18. Environ Res. 2021. PMID: 33610583 Free PMC article.
Cited by
-
Exploring the association between ambient air pollution and COVID-19 risk: A comprehensive meta-analysis with meta-regression modelling.Heliyon. 2024 Jun 6;10(12):e32385. doi: 10.1016/j.heliyon.2024.e32385. eCollection 2024 Jun 30. Heliyon. 2024. PMID: 39183866 Free PMC article.
-
The Geographical Distribution and Influencing Factors of COVID-19 in China.Trop Med Infect Dis. 2022 Mar 6;7(3):45. doi: 10.3390/tropicalmed7030045. Trop Med Infect Dis. 2022. PMID: 35324592 Free PMC article.
-
Bidirectional association between COVID-19 and the environment: A systematic review.Environ Res. 2021 Mar;194:110692. doi: 10.1016/j.envres.2020.110692. Epub 2020 Dec 29. Environ Res. 2021. PMID: 33385384 Free PMC article.
-
Environmental Determinants of Coronavirus Disease 2019 (COVID-19).Curr Allergy Asthma Rep. 2021 Mar 5;21(3):15. doi: 10.1007/s11882-021-00993-1. Curr Allergy Asthma Rep. 2021. PMID: 33666783 Free PMC article. Review.
-
Assessing the Impact of Non-Pharmaceutical Interventions on Consumer Mobility Patterns and COVID-19 Transmission in the US.Int J Environ Res Public Health. 2024 Jan 7;21(1):67. doi: 10.3390/ijerph21010067. Int J Environ Res Public Health. 2024. PMID: 38248532 Free PMC article.
References
-
- World Health Organization: WHO Director-General's opening remarks at the media briefing on COVID-19. 2020. https://www.who.int/dg/speeches/detail/who-director-general-s-opening-re.... Accessed 4 Apr 2020.
MeSH terms
Substances
Grants and funding
LinkOut - more resources
Full Text Sources
