. 2020 Oct 21;39(1):222.
doi: 10.1186/s13046-020-01734-4.

UBE2T-regulated H2AX monoubiquitination induces hepatocellular carcinoma radioresistance by facilitating CHK1 activation

Affiliations

UBE2T-regulated H2AX monoubiquitination induces hepatocellular carcinoma radioresistance by facilitating CHK1 activation

Jingyuan Sun et al. J Exp Clin Cancer Res. .

Abstract

Background: Radioresistance is the major obstacle in radiation therapy (RT) for hepatocellular carcinoma (HCC). Dysregulation of DNA damage response (DDR), which includes DNA repair and cell cycle checkpoints activation, leads to radioresistance and limits radiotherapy efficacy in HCC patients. However, the underlying mechanism have not been clearly understood.

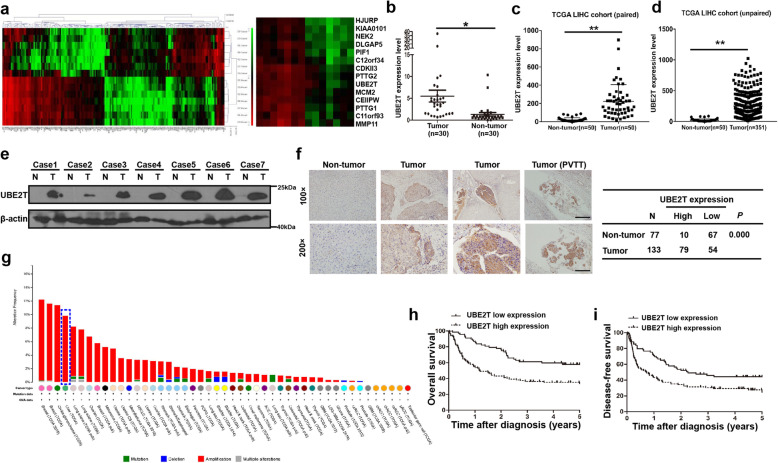
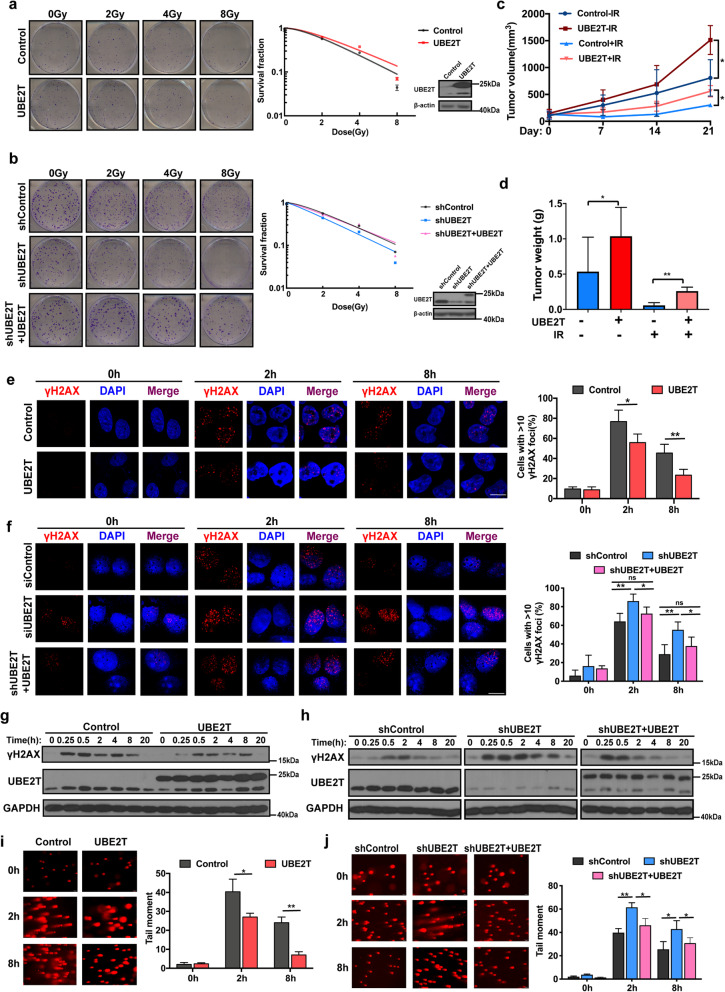
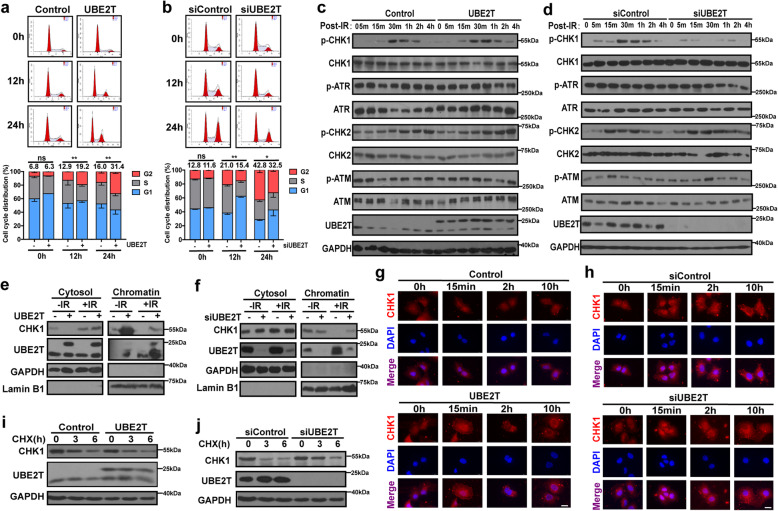
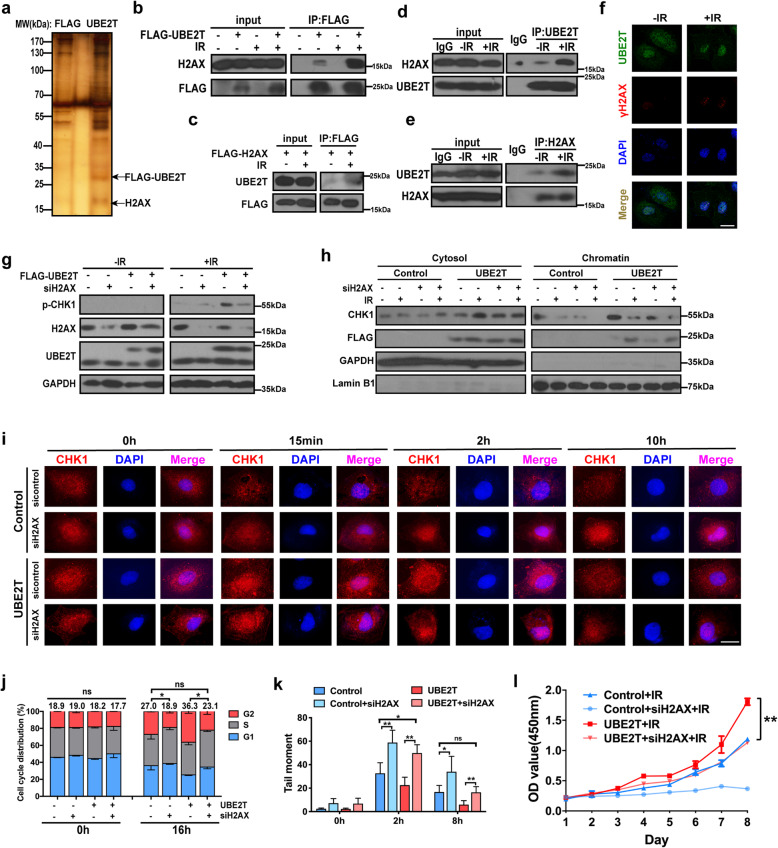
Methods: We obtained 7 pairs of HCC tissues and corresponding non-tumor tissues, and UBE2T was identified as one of the most upregulated genes. The radioresistant role of UBE2T was examined by colony formation assays in vitro and xenograft tumor models in vivo. Comet assay, cell cycle flow cytometry and γH2AX foci measurement were used to investigate the mechanism by which UBE2T mediating DDR. Chromatin fractionation and immunofluorescence staining were used to assess cell cycle checkpoint kinase 1(CHK1) activation. Finally, we analyzed clinical data from HCC patients to verify the function of UBE2T.

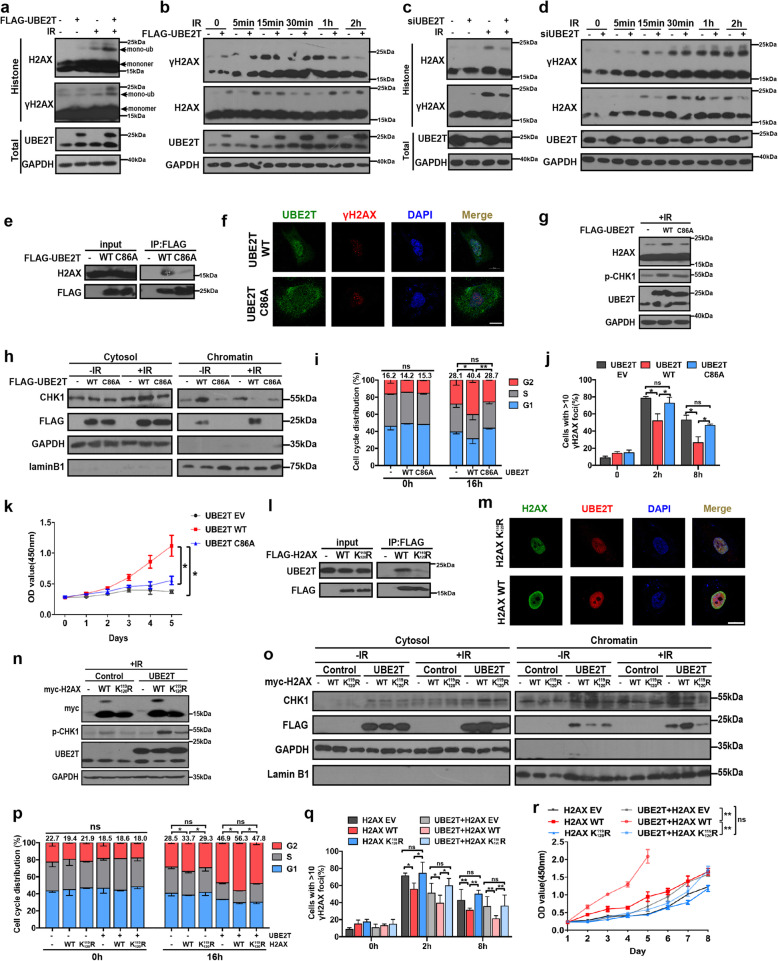
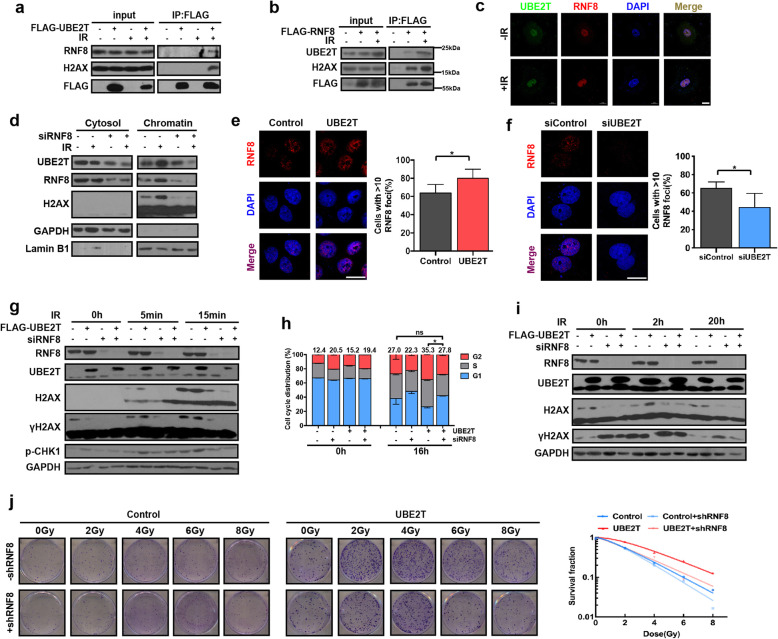
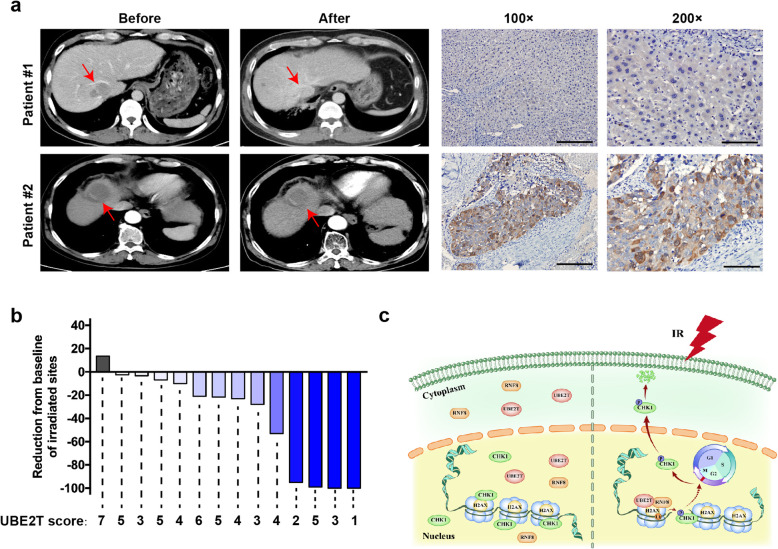
Results: Here, we found that ubiquitin-conjugating enzyme E2T (UBE2T) was upregulated in HCC tissues, and the HCC patients with higher UBE2T levels exhibited poorer outcomes. Functional studies indicated that UBE2T increased HCC radioresistance in vitro and in vivo. Mechanistically, UBE2T-RNF8, was identified as the E2-E3 pair, physically bonded with and monoubiquitinated histone variant H2AX/γH2AX upon radiation exposure. UBE2T-regulated H2AX/γH2AX monoubiquitination facilitated phosphorylation of CHK1 for activation and CHK1 release from the chromatin to cytosol for degradation. The interruption of UBE2T-mediated monoubiquitination on H2AX/γH2AX, including E2-enzyme-deficient mutation (C86A) of UBE2T and monoubiquitination-site-deficient mutation (K119/120R) of H2AX, cannot effectively activate CHK1. Moreover, genetical and pharmacological inhibition of CHK1 impaired the radioresistant role of UBE2T in HCC. Furthermore, clinical data suggested that the HCC patients with higher UBE2T levels exhibited worse response to radiotherapy.

Conclusion: Our results revealed a novel role of UBE2T-mediated H2AX/γH2AX monoubiquitination on facilitating cell cycle arrest activation to provide sufficient time for radiation-induced DNA repair, thus conferring HCC radioresistance. This study indicated that disrupting UBE2T-H2AX-CHK1 pathway maybe a promising potential strategy to overcome HCC radioresistance.

Keywords: Cell cycle arrest; H2AX monoubiquitination; Hepatocellular carcinoma; Radioresistance; Ubiquitin-conjugating enzyme E2T.


Conflict of interest statement

The authors declare that they have no competing interest.

Figures

Fig. 1
Fig. 1
UBE2T was upregulated in HCC and was associated with survival of patients with HCC. a Heatmap of mRNA-Seq analysis of differentially expressed genes (two-fold change and FDR < 0.01) between specimens of 7 patients with HCC and paired non-tumor specimens (left). The upregulated genes are shown on the right. b UBE2T mRNA level in 30 HCC tissues was compared with that in matched non-tumor tissues. c UBE2T mRNA expression level in paired HCC and non-tumor tissues from the TCGA database. d UBE2T mRNA expression level in unpaired HCC and non-tumor tissues from the TCGA database. e Immunoblotting of UBE2T protein in 13 pairs of HCC tissues (T) and matched non-tumorous liver tissues (N) was performed. f UBE2T expression in 133 HCC tissues and 77 non-tumor tissues was analyzed by immunohistochemistry. g The alteration frequency of UBE2T in varied types of cancers from TCGA database at cBioPortal website. Blue frame indicates the status of UBE2T in liver cancer. h Kaplan-Meier survival analysis of UBE2T expression for OS in 133 patients with HCC. i Kaplan-Meier survival analysis of UBE2T expression for DFS in 133 HCC patients. In (b) and (c), data represent the mean ± SD. *P < 0.05, **P < 0.01, by 2-tailed paired Student’s t test. In (d), data represent the mean ± SD. *P < 0.05, by 2-tailed unpaired Student’s t test
Fig. 2
Fig. 2
UBE2T promotes radioresistance and improves DDR of HCC after IR exposure. a Colony formation assays were employed in MHCC-97H cells with stable UBE2T overexpression (left, representative images of colony formation; right, survival curve and immunoblotting). b MHCC-97H cells were transfected with a control shRNA lentiviral vector (shControl) or shRNA lentiviral vectors targeting UBE2T (shUBE2T). Lentivirus carrying UBE2T with synonymous mutation which cannot be recognized by shUBE2T was transfected into shUBE2T MHCC-97H cells (shUBE2T + UBE2T). Colony formation assays were conducted. c Transplanted xenografts were established with UBE2T overexpressing (UBE2T) and vector transduced (Control) MHCC-97H cells. Tumor volumes of the xenografts from were measured for 21 days. d Tumor weights of the removed xenografts from panel c were measured. e MHCC-97H cells stably overexpressing UBE2T and control cells were exposed to IR (4 Gy). Cells were prepared for immunofluorescence analysis of γH2AX nuclear foci. The 0 timepoint indicated no IR. Representative images and quantification are shown. Scale bar: 20 μM. f shControl, shUBE2T and shUBE2T + UBE2T MHCC-97H cells were treated and analyzed in the same way as that in panel e. Scale bar: 20 μM. g Cell lysates from the cells with the same treatment as that in panel e were made for immunoblotting of γH2AX and GAPDH. h Cell lysates from the cells with the same treatment as that in panel f were made for immunoblotting of γH2AX and GAPDH. i Comet assay was performed in UBE2T overexpressing MHCC-97H cells at the indicated timepoints after IR treatment. (left, representative images; right, bar charts indicating the average tail moment per cell). j Cells were treated as that in panel f and made for comet assay at the indicated timepoints after IR treatment. Data represent the mean ± SD. In (d), (e), (f), (i) and (j), *P < 0.05 and **P < 0.01, by one-way ANOVA. In (c), *P < 0.05, by two-way ANOVA
Fig. 3
Fig. 3
UBE2T facilitates CHK1 activation, release form chromatin to cytosol for turnover upon IR in HCC cells. a Cell cycle distribution was detected in MHCC-97H cells overexpressing UBE2T at indicated timepoints after IR (4 Gy). The number above the bar indicated the average percentage numbers of cells arrested in the G2 phase from triplicate experiments. b MHCC-97H cells with UBE2T knockdown was treated and analyzed as panel a. c Immunoblotting analysis of total lysates from IR (4 Gy) treated UBE2T overexpressing and control MHCC-97H cells for the indicated proteins. d Total protein lysates were extracted from IR (4 Gy) treated UBE2T silencing MHCC-97H cells and control cells for immunoblotting of the indicated proteins. e The cytosol and chromatin protein fractions of IR (4 Gy) treated UBE2T overexpressing MHCC-97H cells were isolated and analyzed. f The cytosol and chromatin protein fractions of IR (4 Gy) treated UBE2T silencing MHCC-97H cells were isolated and analyzed. g Immunofluorescence staining was used to determine the location of CHK1 in UBE2T overexpressing MHCC-97H cells at indicated timepoints after IR (4 Gy). Scale bar: 20 μM. h Immunofluorescent staining of CHK1 (red) in UBE2T silencing cells at indicated timepoints after IR (4 Gy). i UBE2T-overexpressing MHCC-97H cells were treated with IR (4 Gy) and 160 mM CHX for the indicated timepoints and immunoblotted with CHK1. j UBE2T-silencing MHCC-97H cells were treated with IR (4 Gy) and 160 mM CHX for the indicated timepoints and immunoblotted with CHK1. Scale bar: 20 μM. Data represent the mean ± SD. In (a) and (b), ns, not significant, *P < 0.05 and **P < 0.01, by one-way ANOVA
Fig. 4
Fig. 4
Genetical and pharmacological inhibition of CHK1 impairs UBE2T-induced DDR and radioresistance in HCC. a UBE2T stably overexpressing were transfected with siRNA targeting CHK1 and treated with IR (4 Gy). Cells were prepared for immunofluorescence analysis of γH2AX foci. b γH2AX level of lysates from cells treated as that in panel a was determined by immunoblotting. c Comet assay was conducted in cells with same treatment as that in panel a at indicated timepoints after IR. The quantification of the tail moment is shown. d Colony formation assays were conducted in UBE2T stably overexpressing MHCC-97H cells transduced with lentivirus shRNA targeting CHK1. The representative images and survival curve are shown. e UBE2T stably overexpression MHCC-97H cells were treated with 2 μM MK-8776 1 h before IR, and analyzed for γH2AX foci by immunofluorescence staining. f γH2AX level of lysates from cells treated as that in panel e was determined by immunoblotting. g Comet assay was conducted in cells with same treatment as that in panel e at indicated timepoints after IR. h Colony formation assays were conducted in UBE2T stably overexpressing MHCC-97H cells treated with 2 μM MK-8776. The representative images and survival curve are shown. i Transplanted xenografts were established with UBE2T overexpressing (UBE2T) and vector transduced (Control) MHCC-97H cells, and treated with IR and injected with MK-8776 (50 mg/kg) intraperitoneally for 3 days. Tumor volumes from each group were tracked for 21 days, the representative tumor samples from each group are shown. j Tumor volumes of the xenografts from panel i were measured. k Tumor weights of the removed xenografts from panel i were measured. Data represent the mean ± SD. In (a), (c), (e), and (g), ns, not significant, *P < 0.05 and **P < 0.01, by one-way ANOVA. In (j), **P < 0.01, by two-way ANOVA
Fig. 5
Fig. 5
UBE2T binds with H2AX/γH2AX, and promotes CHK1 activation, DDR and HCC radioresistance via H2AX/γH2AX. a FLAG-UBE2T complexes were purified from 293 T cells transfected with the indicated plasmids and then treated with or without IR (4 Gy). The indicated bands were the distinct bands stained by silver stain and then identified by mass spectrometry. b Immunoprecipitation of H2AX with UBE2T from 293 T cells transfected with FLAG-UBE2T after IR (4 Gy). c Immunoprecipitation of UBE2T with H2AX from 293 T cells transfected with plasmids encoding FLAG-H2AX was analyzed by immunoblotting after IR (4 Gy). d-e The MHCC-97H cells treated with or without IR and made for immunoprecipitation by using anti-UBE2T antibody (d) or anti-H2AX antibody (e). f MHCC-97H cells were transfected with FLAG-UBE2T and were treated with IR, FLAG-UBE2T (green), or γH2AX (red) were analyzed with immunofluorescence assay. Scale bar: 20 μM. g UBE2T overexpressing or control MHCC-97H cells transfected with H2AX siRNA or control siRNA, and then treated with IR (4 Gy). Total cell lysates were analyzed by immunoblotting analysis. h Cells were treated as panel g. The cytosol and chromatin fractionation of the cells were isolated and analyzed by immunoblotting. i Cells were treated as panel g. Cells were harvested at indicated timepoints, and stained for CHK1, representative images of immunofluorescence staining were shown. Scale bar: 20 μM. j Cells were treated as panel g. Cell cycle distribution was analyzed by flow cytometry. The average numbers of % cells in the G2 phase are shown above the bars. k Cells were treated as panel g. Quantification of comet assays is shown. l Cells were treated as panel g. Cell survival was assessed by CCK-8 assay. Data represent the mean ± SD. In (j) and (k), ns, not significant, *P < 0.05 and **P < 0.01, by one-way ANOVA. In (l), **P < 0.01, by two-way ANOVA
Fig. 6
Fig. 6
UBE2T promotes CHK1 activation, DDR and HCC radioresistance via monoubiquitinating H2AX/γH2AX. a Histone fraction from MHCC-97H cells transfected with FLAG-UBE2T was exposed to IR (4 Gy) and analyzed for H2AX/γH2AX monoubiquitination. b Immunoblotting of MHCC-97H cells expressing FLAG-UBE2T at the indicated timepoints after IR. c Histone fraction from MHCC-97H cells transfected with siRNA-UBE2T was exposed to IR and analyzed for H2AX/γH2AX monoubiquitination. d Immunoblotting of UBE2T silencing MHCC-97H cells at the indicated timepoints after IR. e Cell extracts from 293 T cells expressing FLAG-UBE2T WT or FLAG-UBE2T C86A were treated with IR and immunoprecipitated with anti-FLAG antibodies, followed by immunoblotting with indicated antibodies. f-k Cells with the same treatment as that in panel e. f Cells were stained for γH2AX foci (red) and FLAG-UBE2T (green). Scale bar: 20 μM. g Total cell lysates were analyzed by immunoblotting. h Cytosolic and chromatin fractions were analyzed by immunoblotting. i Cell cycle distribution was analyzed by flow cytometry. j Immunofluorescence staining was performed for γH2AX foci analysis. Quantification is shown. k Cell survival was assessed by CCK-8 assay. (l) Cellular extracts from 293 T cells expressing FLAG-H2AX WT or FLAG-H2AX K119/120R were treated with IR and immunoprecipitated with anti-FLAG antibodies, followed by immunoblotting with indicated antibodies. m Cells with the same treatment as that in panel l. Cells were stained for FLAG-H2AX (green) and UBE2T (red). Scale bar: 20 μM. n-r MHCC-97H cells were transfected with myc-tagged adenoviral-control, adenoviral-H2AX WT, adenoviral-H2AX K119/120R, or empty vector, treated with IR. n Total cell lysates were analyzed by immunoblotting. o Cytosolic and chromatin fractions were analyzed by immunoblotting. p Cell cycle distribution was analyzed by flow cytometry. q Immunofluorescence staining was performed for γH2AX foci analysis. r Cell survival was assessed by CCK-8 assay. Data represent the mean ± SD. In (i), (j), (p), and (q), ns, not significant, *P < 0.05 and **P < 0.01, by one-way ANOVA. In (k) and (r), ns, not significant, *P < 0.05 and **P < 0.01, by two-way ANOVA
Fig. 7
Fig. 7
UBE2T induces HCC cell radioresistance in coordination with RNF8. a 293 T cells were transfected with FLAG-UBE2T and treated with IR (4 Gy). IP was performed by using FLAG antibody, and the IP product was analyzed by immunoblotting. b Immunoblotting analysis of FLAG-IP derived from the irradiated 293 T cells transfected with empty vector or FLAG-RNF8. c Representative images of immunofluorescence staining for UBE2T (green) and RNF8 (red) in MHCC-97H cells treated with IR (4 Gy). d Immunoblotting analysis of the cytosolic and chromatin fractions of IR (4 Gy) treated MHCC-97H cells transfected with siRNA-RNF8 or siRNA-control. e Representative images and quantification of UBE2T overexpressing MHCC-97H cells stained for RNF8 (red) foci before and after IR (4 Gy). f Representative images and quantification of UBE2T silencing MHCC-97H cells stained for RNF8 (red) foci before and after IR (4 Gy). g UBE2T overexpressing cells or control cells were transfected with siRNA-RNF8 or siRNA-control, and harvested at the indicated timepoints after IR (4 Gy). h Cells with the same treatment as that in panel g were collected at the indicated timepoints after IR (4 Gy) to test cell cycle distribution. i Cells with the same treatment as that in panel g were collected at the indicated timepoints after IR to test γH2AX level. j Colony formation assays were conducted in UBE2T stably overexpressing MHCC-97H cells transduced with lentivirus coding control shRNA or shRNA targeting RNF8. Data represent the mean ± SD. In (e) and (f), *P < 0.05, by 2-tailed paired Student’s t test. In (h), ns, not significant, *P < 0.05, by one-way ANOVA
Fig. 8
Fig. 8
UBE2T confers resistance to RT in HCC patients. a CT scan images of a patient with high UBE2T level (upper panel) and a patient with low UBE2T level (lower panel), before and after RT. Red arrows indicate HCC lesions. Representative images of IHC staining for UBE2T were shown. b Tumor burden change from baseline in target lesions in 14 HCC patients received RT. The score of UBE2T in each patient was indicated. c The Working model summarizes the presented findings

References

    1. Bray F, Ferlay J, Soerjomataram I, Siegel RL, Torre LA, Jemal A. Global cancer statistics 2018: GLOBOCAN estimates of incidence and mortality worldwide for 36 cancers in 185 countries. CA Cancer J Clin. 2018;68(6):394–424. - PubMed
    1. Bartkova J, Horejsi Z, Koed K, Kramer A, Tort F, Zieger K, et al. DNA damage response as a candidate anti-cancer barrier in early human tumorigenesis. Nature. 2005;434(7035):864–870. doi: 10.1038/nature03482. - DOI - PubMed
    1. Curtin NJ. DNA repair dysregulation from cancer driver to therapeutic target. Nat Rev Cancer. 2012;12(12):801–817. doi: 10.1038/nrc3399. - DOI - PubMed
    1. Jeggo PA, Pearl LH, Carr AM. DNA repair, genome stability and cancer: a historical perspective. Nat Rev Cancer. 2016;16(1):35–42. doi: 10.1038/nrc.2015.4. - DOI - PubMed
    1. Lord CJ, Ashworth A. The DNA damage response and cancer therapy. Nature. 2012;481(7381):287–294. doi: 10.1038/nature10760. - DOI - PubMed

MeSH terms