. 2020 Oct 21;24(1):619.
doi: 10.1186/s13054-020-03333-3.

COVID-19: What Iodine Maps From Perfusion CT can reveal-A Prospective Cohort Study

Affiliations

COVID-19: What Iodine Maps From Perfusion CT can reveal-A Prospective Cohort Study

Mario G Santamarina et al. Crit Care. .

Abstract

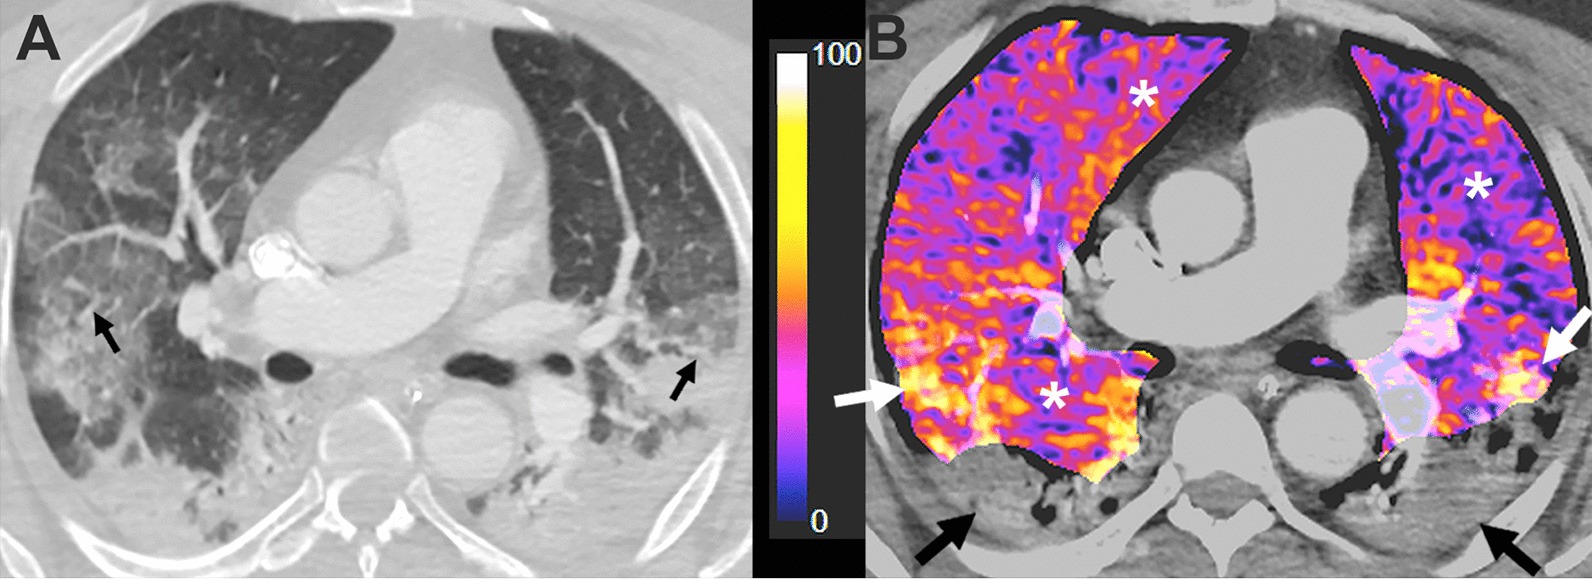
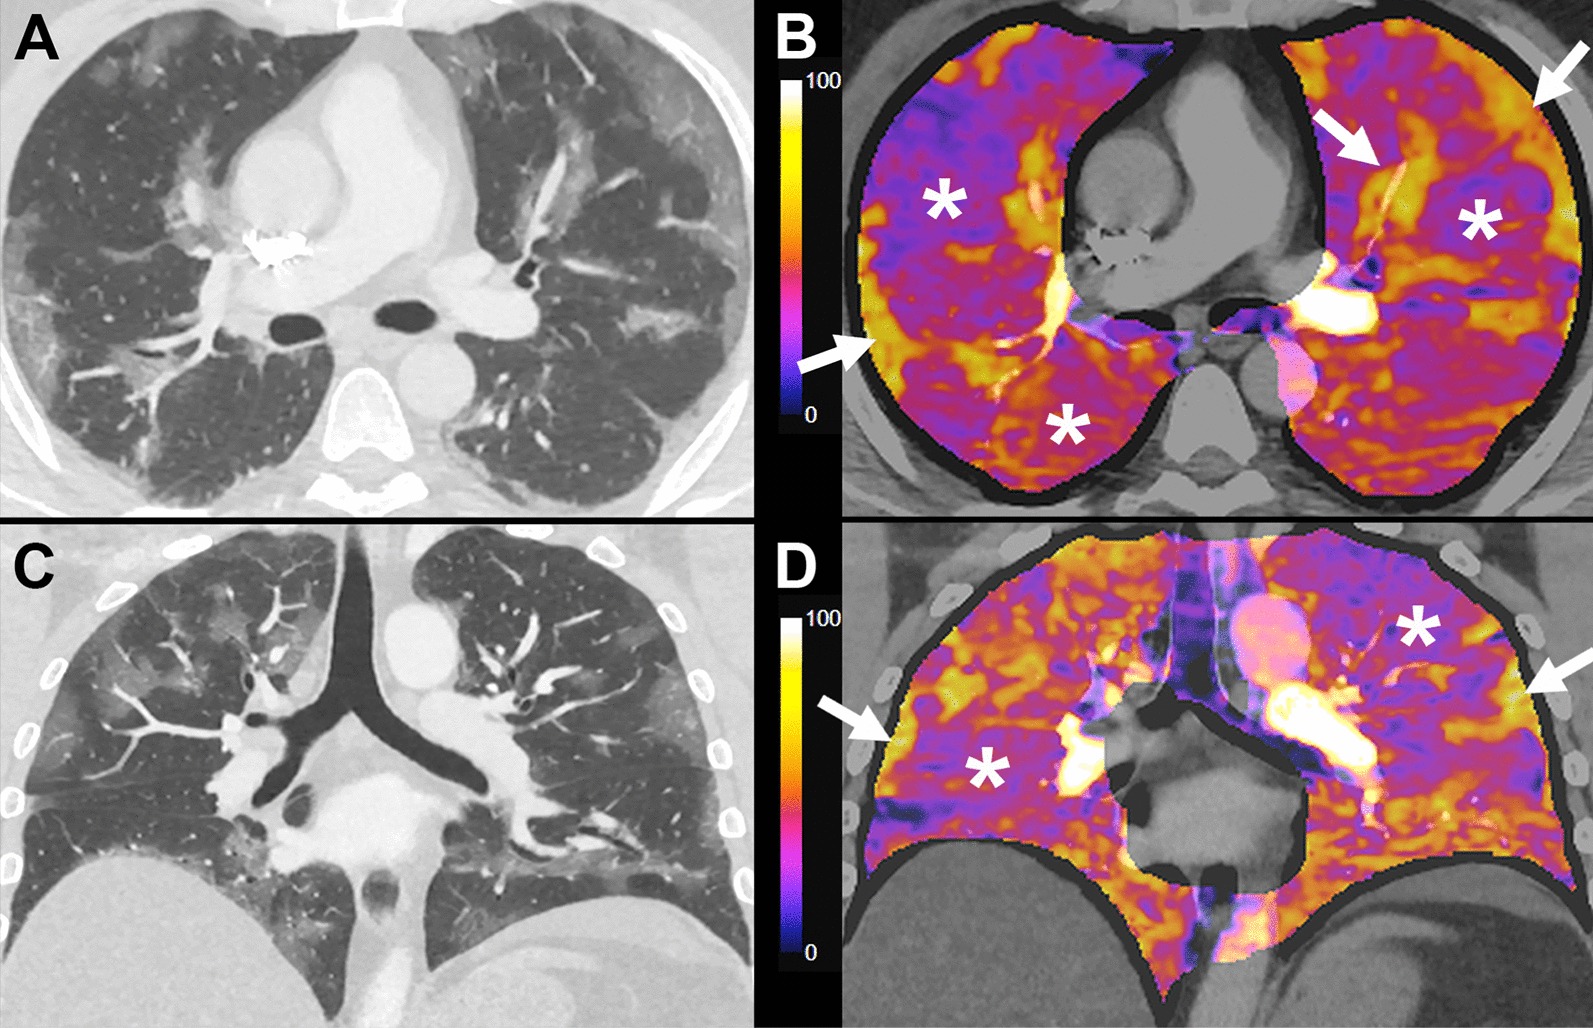
Background: Subtraction CT angiography (sCTA) is a technique used to evaluate pulmonary perfusion based on iodine distribution maps. The aim of this study is to assess lung perfusion changes with sCTA seen in patients with COVID-19 pneumonia and correlate them with clinical outcomes.

Material and methods: A prospective cohort study was carried out with 45 RT-PCR-confirmed COVID-19 patients that required hospitalization at three different hospitals, between April and May 2020. In all cases, a basic clinical and demographic profile was obtained. Lung perfusion was assessed using sCTA. Evaluated imaging features included: Pattern predominance of injured lung parenchyma in both lungs (ground-glass opacities, consolidation and mixed pattern) and anatomical extension; predominant type of perfusion abnormality (increased perfusion or hypoperfusion), perfusion abnormality distribution (focal or diffuse), extension of perfusion abnormalities (mild, moderate and severe involvement); presence of vascular dilatation and vascular tortuosity. All participants were followed-up until hospital discharge searching for the development of any of the study endpoints. These endpoints included intensive-care unit (ICU) admission, initiation of invasive mechanical ventilation (IMV) and death.

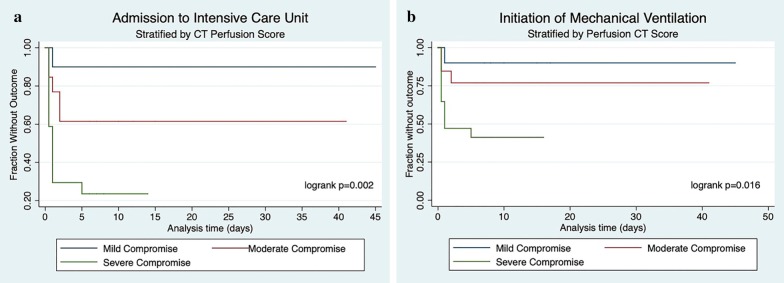
Results: Forty-one patients (55.2 ± 16.5 years, 22 men) with RT-PCR-confirmed SARS-CoV-2 infection and an interpretable iodine map were included. Patients with perfusion anomalies on sCTA in morphologically normal lung parenchyma showed lower Pa/Fi values (294 ± 111.3 vs. 397 ± 37.7, p = 0.035), and higher D-dimer levels (1156 ± 1018 vs. 378 ± 60.2, p < 0.01). The main common patterns seen in lung CT scans were ground-glass opacities, mixed pattern with predominant ground-glass opacities and mixed pattern with predominant consolidation in 56.1%, 24.4% and 19.5% respectively. Perfusion abnormalities were common (36 patients, 87.8%), mainly hypoperfusion in areas of apparently healthy lung. Patients with severe hypoperfusion in areas of apparently healthy lung parenchyma had an increased probability of being admitted to ICU and to initiate IMV (HR of 11.9 (95% CI 1.55-91.9) and HR 7.8 (95% CI 1.05-61.1), respectively).

Conclusion: Perfusion abnormalities evidenced in iodine maps obtained by sCTA are associated with increased admission to ICU and initiation of IMV in COVID-19 patients.

Keywords: Angiotensin II; Angiotensin converting enzyme 2; COVID-19; Computed tomography angiography; Coronavirus; Vasoconstriction; Vasoplegia; Ventilation-perfusion ratio.


Conflict of interest statement

The authors declare that they have no competing interests.

Figures

Fig. 1.
Fig. 1.
78-year-old female patient, RT-PCR-confirmed COVID-19, 8 days since symptom onset, complicated with pulmonary embolism. Admission PaO2/FiO2 ratio was 162, and d-dimer levels > 2000 ng/mL. Admitted to the intensive care unit, managed with invasive mechanical ventilation. She died 2 weeks after admission. a Axial lung-window CT angiography image shows extensive lung involvement with patchy ground-glass opacities in both lungs, with vascular dilatation in small peripheral subsegmental pulmonary arterial branches, some of them with a varicose appearance (black arrows). b Coronal CT angiography image shows pulmonary embolism in the posterior basal segment of the lower left lobe (white arrow). c 5 mm coronal-plane reconstruction of a subtraction iodine map shows moderate to severe hypoperfusion in superior and inferior regions of the lung (*), in areas of apparently healthy lung parenchyma in conventional chest CT images, which is more pronounced in the posterior basal segment of the lower left lobe, in relation to the area of pulmonary embolism. Areas of ground-glass opacities show normal or increased perfusion, most probably due to vasoplegia
Fig. 2.
Fig. 2.
51-year-old male patient, RT-PCR confirmed COVID-19, 3 days since symptom onset. Admission PaO2/FiO2 ratio was 240, and d-dimer level was 480 ng/mL. Admitted to the intensive care unit, managed with invasive mechanical ventilation. a Axial lung-window CT angiography image shows extensive bilateral ground-glass opacities, with areas of posterior subpleural consolidation. There is subtle subsegmental peripheral vascular dilatation of pulmonary arterial branches (small black arrows). b 5 mm axial reconstruction of a subtraction iodine map shows slight to moderate hypoperfusion predominantly in areas of non-injured lung (*), and more prominent areas of increased perfusion in relation to the zones of ground-glass opacities (white arrows). Perfusion was not assessed in the areas of consolidation (black arrows) due to software limitations that exclude these zones. This patient evolved in a similar fashion to the H (type 2) phenotype described by Gattinoni et al.
Fig. 3.
Fig. 3.
37-year-old male patient, RT-PCR-confirmed COVID-19, 10 days since symptom onset. Admission PaO2/FiO2 ratio was 240 and d-dimer level was 480 ng/mL. Admitted to the intensive care unit, managed with invasive mechanical ventilation. a, c Axial and coronal lung-window chest CT angiography images show multiple foci of ground-glass opacities, with a predominantly subpleural distribution, with areas of apparently healthy lung parenchyma. Vascular dilatation can be seen in relation to areas of ground-glass opacities. b, d 5 mm reconstruction images of subtraction iodine maps in corresponding axial and coronal planes, show areas of severe hypoperfusion in the corresponding apparently healthy lung parenchyma (*), with increased perfusion in areas of ground-glass opacities (white arrows). This patient evolved in a similar fashion to the L (type 1) phenotype described by Gattinoni et al.
Fig. 4
Fig. 4
a Admission to Intensive Care Unit. Stratified by CT Perfusion Score. b Initiation of Mechanical Ventilation. Stratified by CT Perfusion Score
Fig. 5.
Fig. 5.
40-year-old male patient, RT-PCR-confirmed COVID-19, 5 days since symptom onset. Admission PaO2/FiO2 ratio was 310, and d-dimer levels < 300 ng/mL. Due to progressive hypoxaemia, he was managed in the intensive care unit with conscious prone position and high flow nasal cannula, with positive tolerance and evolution. a Axial lung-window CT angiography image shows small patchy areas of ground-glass opacities, with slightly dilated small pulmonary arterial branches (small black arrow). b 5 mm axial reconstruction of a subtraction iodine map shows moderate hypoperfusion with a right-sided predominance (*). The ground-glass opacity in the upper right lobe shows decreased perfusion within the opacity, with a peripheral halo of increased perfusion (black arrow). These findings could be explained by physiological hypoxic vasoconstriction. However, the ground-glass opacity in the upper left lobe shows increased perfusion (white arrow)
Fig. 6
Fig. 6
Computed Tomography Severity Scores stratified by Perfusion CT Findings

References

    1. COVID-19 Dashboard by the Center for Systems Science and Engineering (CSSE) at Johns Hopkins University (JHU). https://coronavirus.jhu.edu/map.html. Accessed 22 July 2020.
    1. Wu Z, McGoogan JM. Characteristics of and important lessons from the coronavirus disease 2019 (COVID-19) outbreak in China: summary of a report of 72 314 cases from the Chinese Center for Disease Control and Prevention. JAMA. 2020;323(13):1239–1242. doi: 10.1001/jama.2020.2648. - DOI - PubMed
    1. Gattinoni L, Chiumello D, Rossi S. COVID-19 pneumonia: ARDS or not? Crit Care. 2020;24:154. doi: 10.1186/s13054-020-02880-z. - DOI - PMC - PubMed
    1. Lang M, Som A, Mendoza DP, Flores EJ, Reid N, Carey D, Li MD, Witkin A, Rodriguez-Lopez JM, Shepard JA, Little BP. Hypoxaemia related to COVID-19: vascular and perfusion abnormalities on dual-energy CT. Lancet Infect Dis. 2020 doi: 10.1016/S1473-3099(20)30367-4. - DOI - PMC - PubMed
    1. Oudkerk M, Büller HR, Kuijpers D, van Es N, Oudkerk SF, McLoud TC, Gommers D, van Dissel J, Ten Cate H, van Beek EJ. Diagnosis, prevention, and treatment of thromboembolic complications in COVID-19: report of the National Institute for Public Health of the Netherlands. Radiology. 2020 doi: 10.1148/radiol.2020201629. - DOI - PMC - PubMed