

Reconstructing the early global dynamics of under-ascertained COVID-19 cases and infections
- PMID: 33087179
- PMCID: PMC7577796
- DOI: 10.1186/s12916-020-01790-9
Reconstructing the early global dynamics of under-ascertained COVID-19 cases and infections
Abstract
Background: Asymptomatic or subclinical SARS-CoV-2 infections are often unreported, which means that confirmed case counts may not accurately reflect underlying epidemic dynamics. Understanding the level of ascertainment (the ratio of confirmed symptomatic cases to the true number of symptomatic individuals) and undetected epidemic progression is crucial to informing COVID-19 response planning, including the introduction and relaxation of control measures. Estimating case ascertainment over time allows for accurate estimates of specific outcomes such as seroprevalence, which is essential for planning control measures.
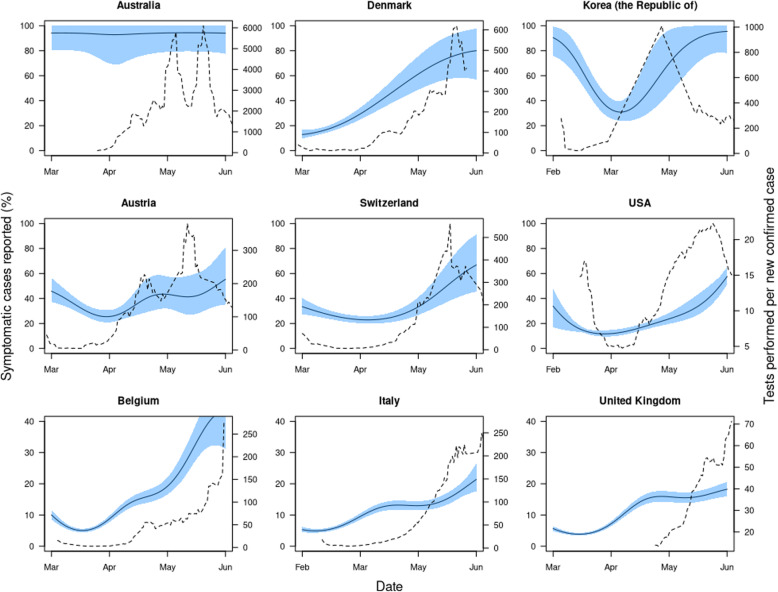
Methods: Using reported data on COVID-19 cases and fatalities globally, we estimated the proportion of symptomatic cases (i.e. any person with any of fever ≥ 37.5 °C, cough, shortness of breath, sudden onset of anosmia, ageusia or dysgeusia illness) that were reported in 210 countries and territories, given those countries had experienced more than ten deaths. We used published estimates of the baseline case fatality ratio (CFR), which was adjusted for delays and under-ascertainment, then calculated the ratio of this baseline CFR to an estimated local delay-adjusted CFR to estimate the level of under-ascertainment in a particular location. We then fit a Bayesian Gaussian process model to estimate the temporal pattern of under-ascertainment.
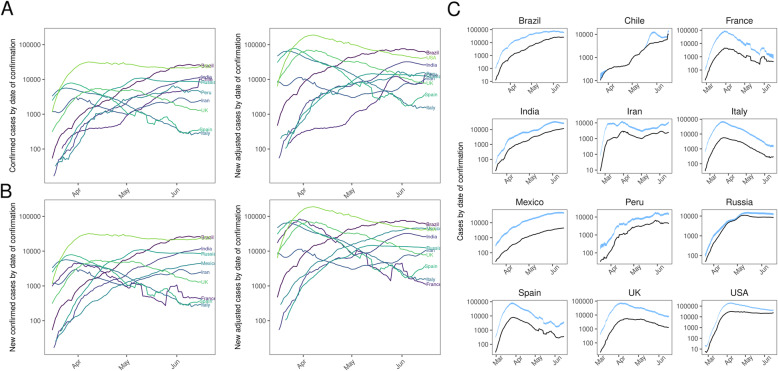
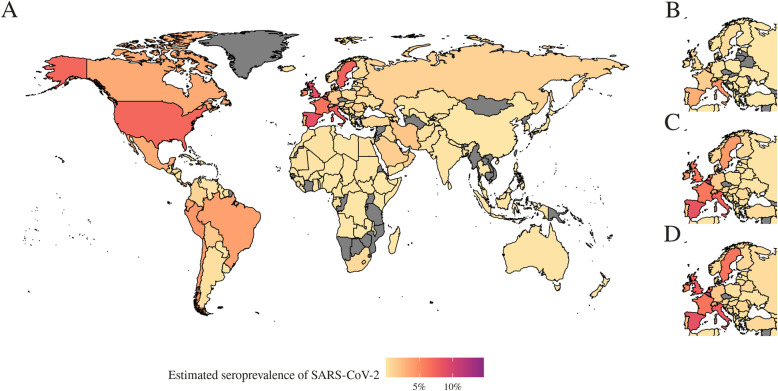
Results: Based on reported cases and deaths, we estimated that, during March 2020, the median percentage of symptomatic cases detected across the 84 countries which experienced more than ten deaths ranged from 2.4% (Bangladesh) to 100% (Chile). Across the ten countries with the highest number of total confirmed cases as of 6 July 2020, we estimated that the peak number of symptomatic cases ranged from 1.4 times (Chile) to 18 times (France) larger than reported. Comparing our model with national and regional seroprevalence data where available, we find that our estimates are consistent with observed values. Finally, we estimated seroprevalence for each country. As of 7 June, our seroprevalence estimates range from 0% (many countries) to 13% (95% CrI 5.6-24%) (Belgium).
Conclusions: We found substantial under-ascertainment of symptomatic cases, particularly at the peak of the first wave of the SARS-CoV-2 pandemic, in many countries. Reported case counts will therefore likely underestimate the rate of outbreak growth initially and underestimate the decline in the later stages of an epidemic. Although there was considerable under-reporting in many locations, our estimates were consistent with emerging serological data, suggesting that the proportion of each country's population infected with SARS-CoV-2 worldwide is generally low.
Keywords: COVID-19; Case ascertainment; Outbreak analysis; SARS-CoV-2; Situational awareness; Surveillance; Under-reporting.
Conflict of interest statement
The authors declare that they have no competing interests.
Figures

References
-
- Hale T, Webster S, Petherick A, Phillips T, Kira B. Oxford COVID-19 Government Response Tracker. Coronavirus Government Response Tracker. 2020. - PubMed
-
- The effect of large-scale anti-contagion policies on the COVID-19 pandemic | Nature. https://www.nature.com/articles/s41586-020-2404-8. Accessed 1 Sept 2020. - PubMed
-
- Imperial College COVID-19 Response Team, Flaxman S, Mishra S, Gandy A, Unwin HJT, Mellan TA, et al. Estimating the effects of non-pharmaceutical interventions on COVID-19 in Europe. Nature. 2020;584:257–61. - PubMed
Publication types
MeSH terms
Grants and funding
LinkOut - more resources
Full Text Sources
Miscellaneous
