. 2021 Feb;11(2):340-361.
doi: 10.1158/2159-8290.CD-20-1092. Epub 2020 Oct 21.

Selection of Oncogenic Mutant Clones in Normal Human Skin Varies with Body Site

Affiliations

Selection of Oncogenic Mutant Clones in Normal Human Skin Varies with Body Site

Joanna C Fowler et al. Cancer Discov. 2021 Feb.

Abstract

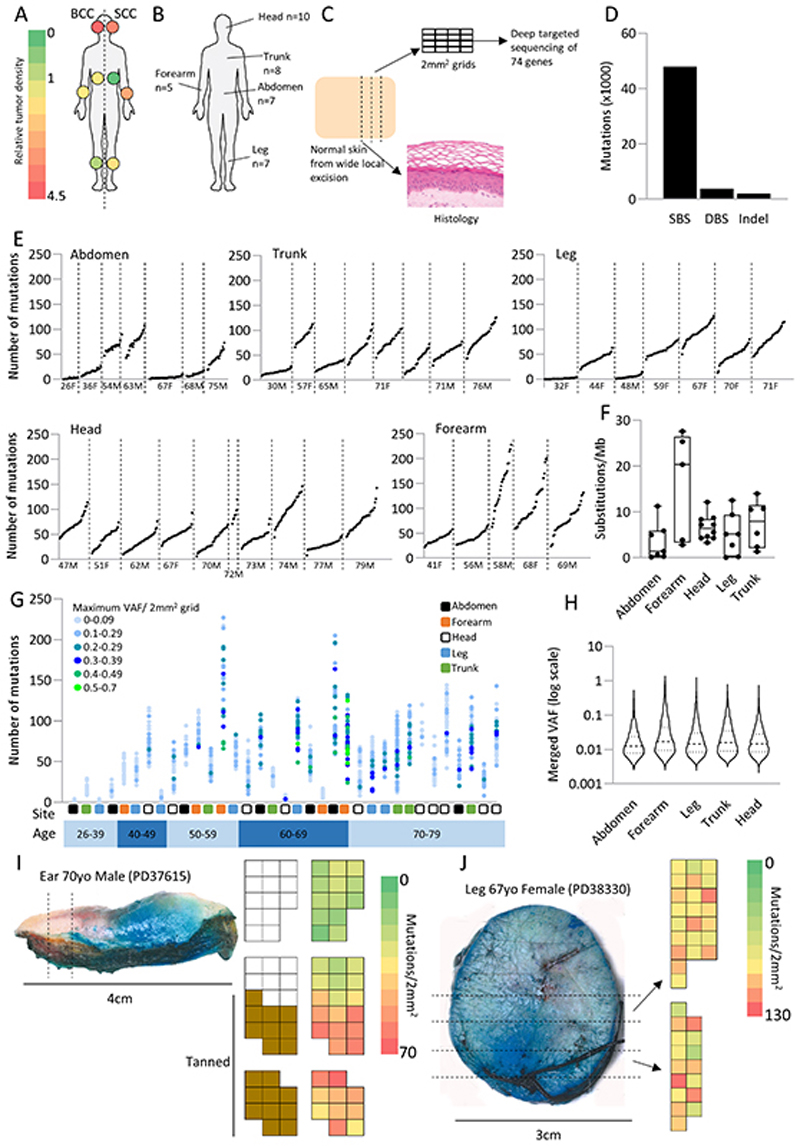
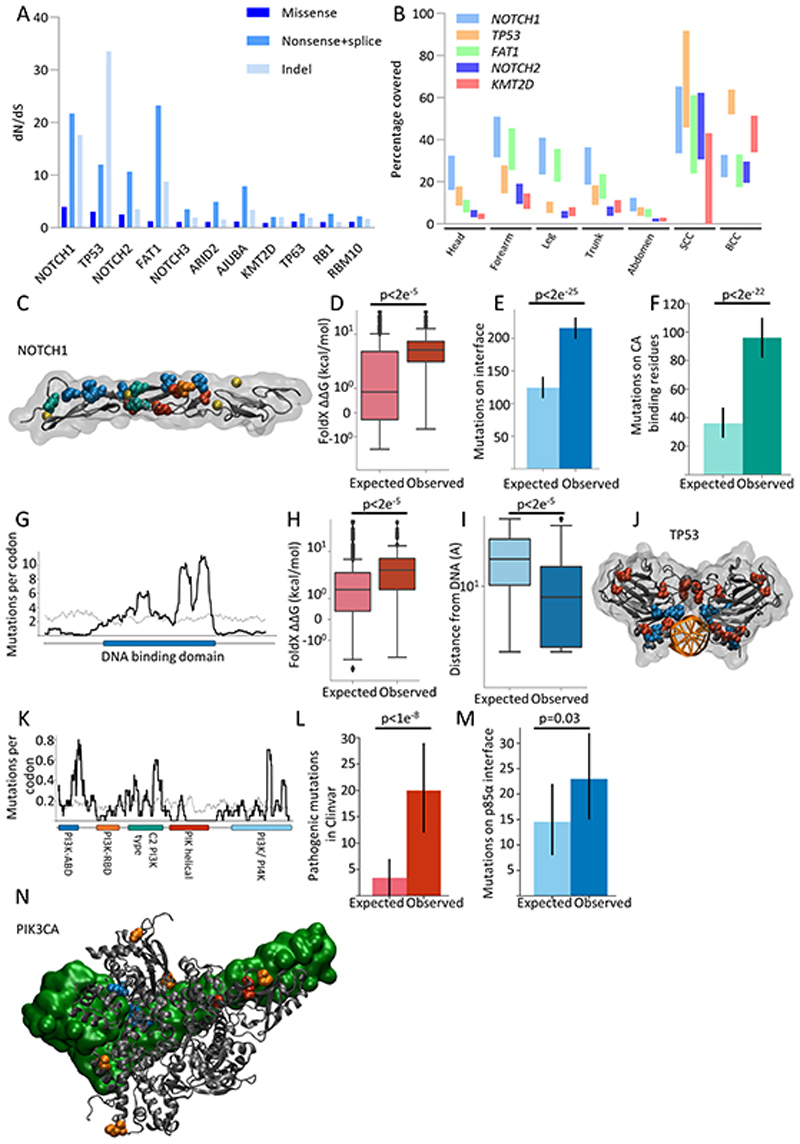
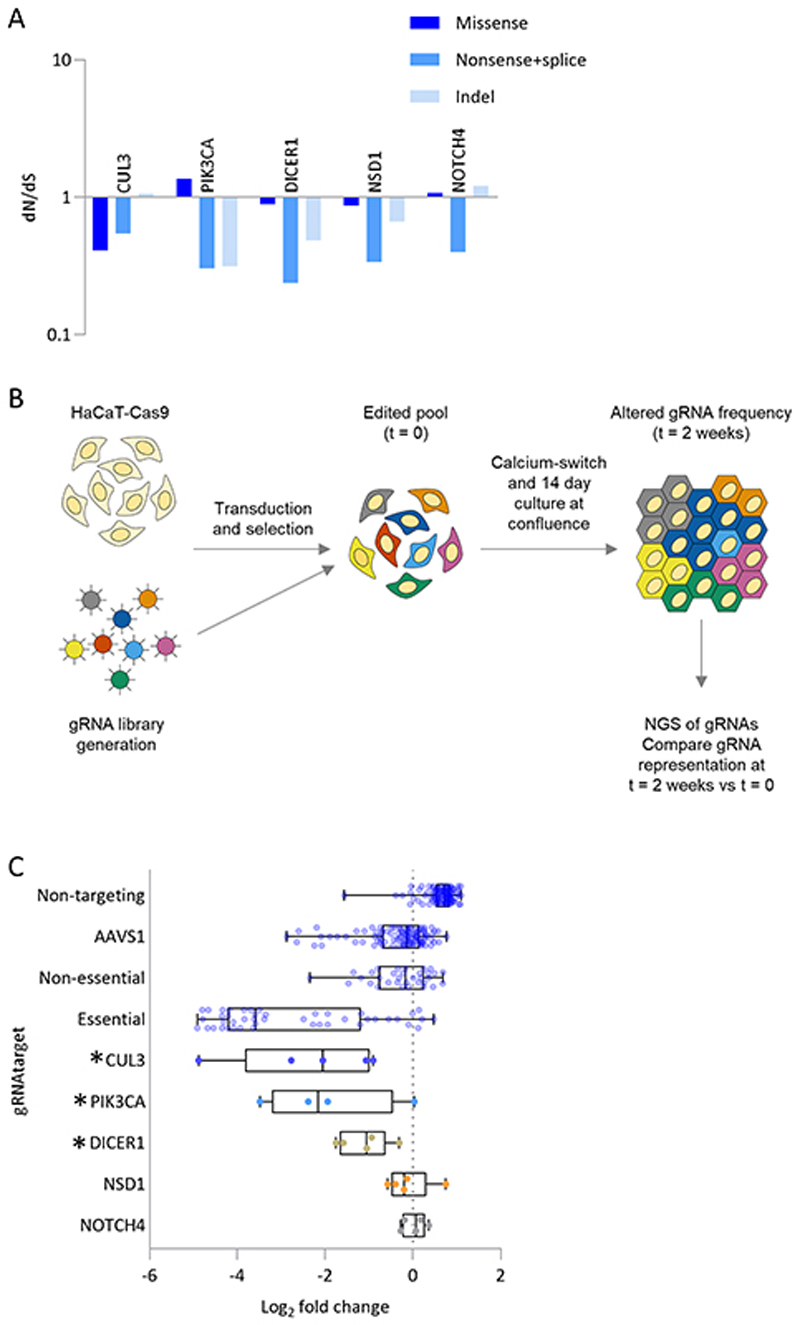
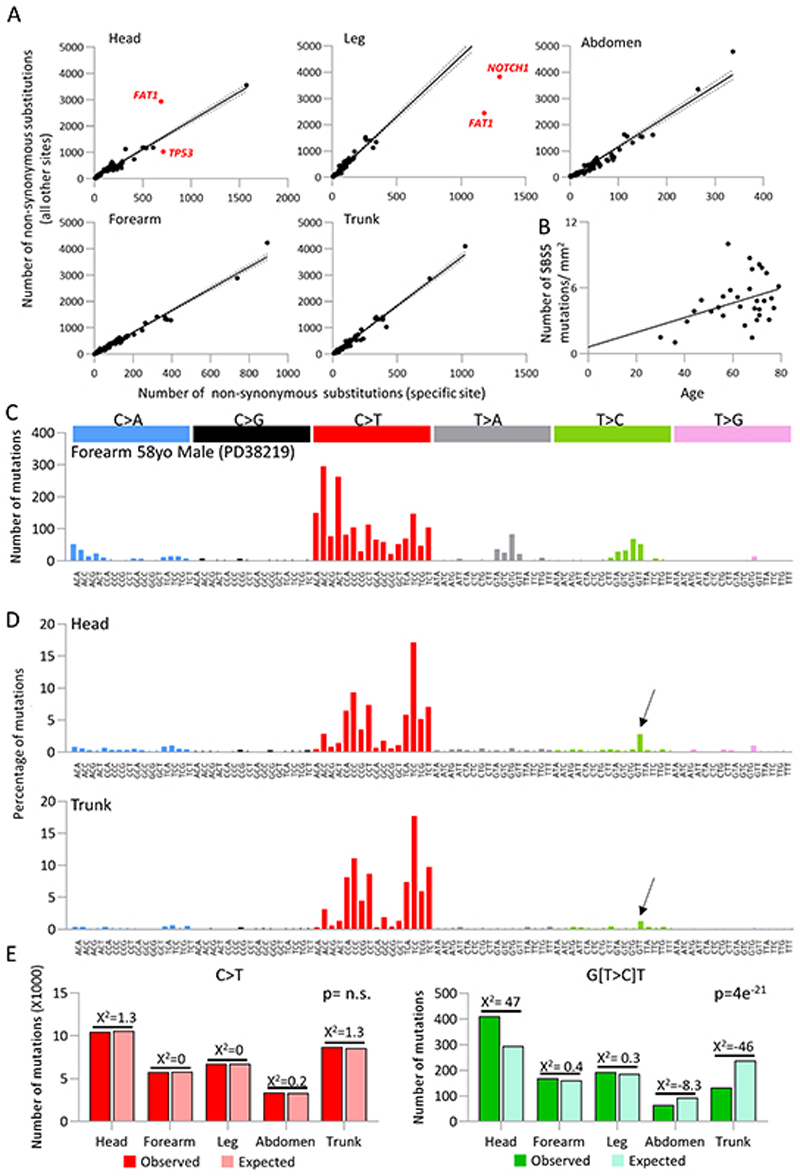
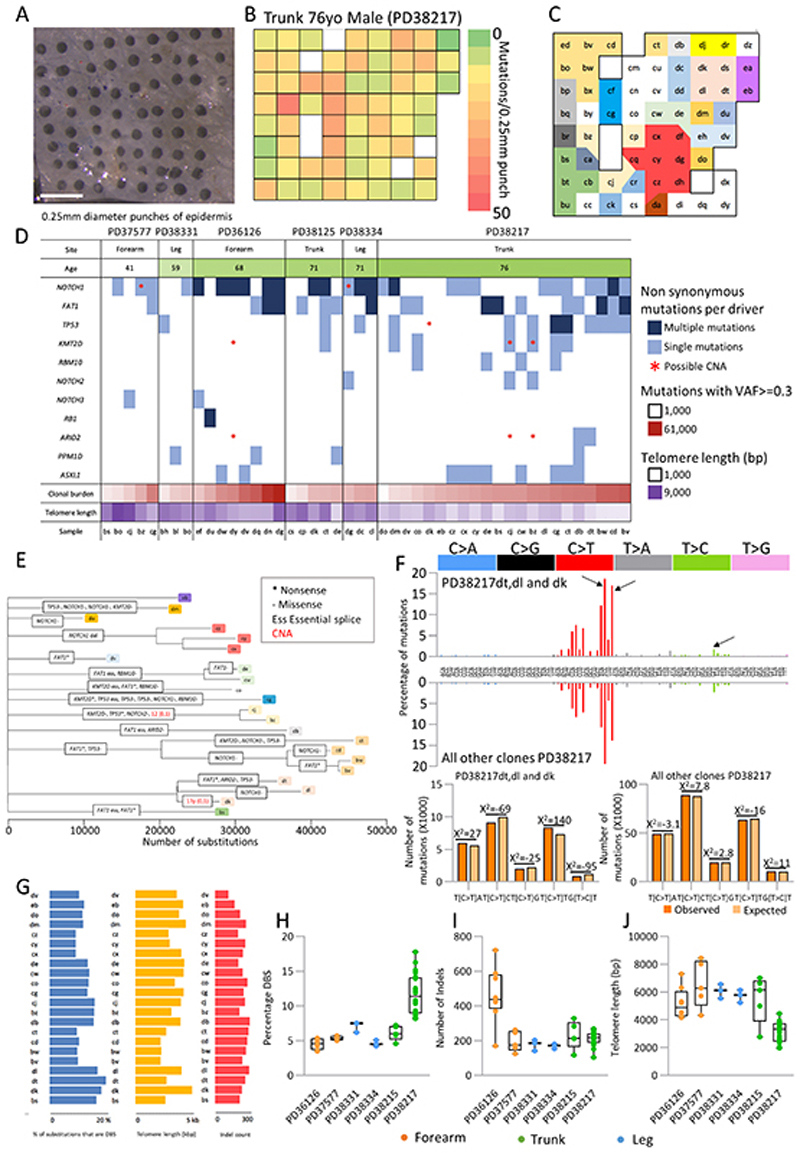
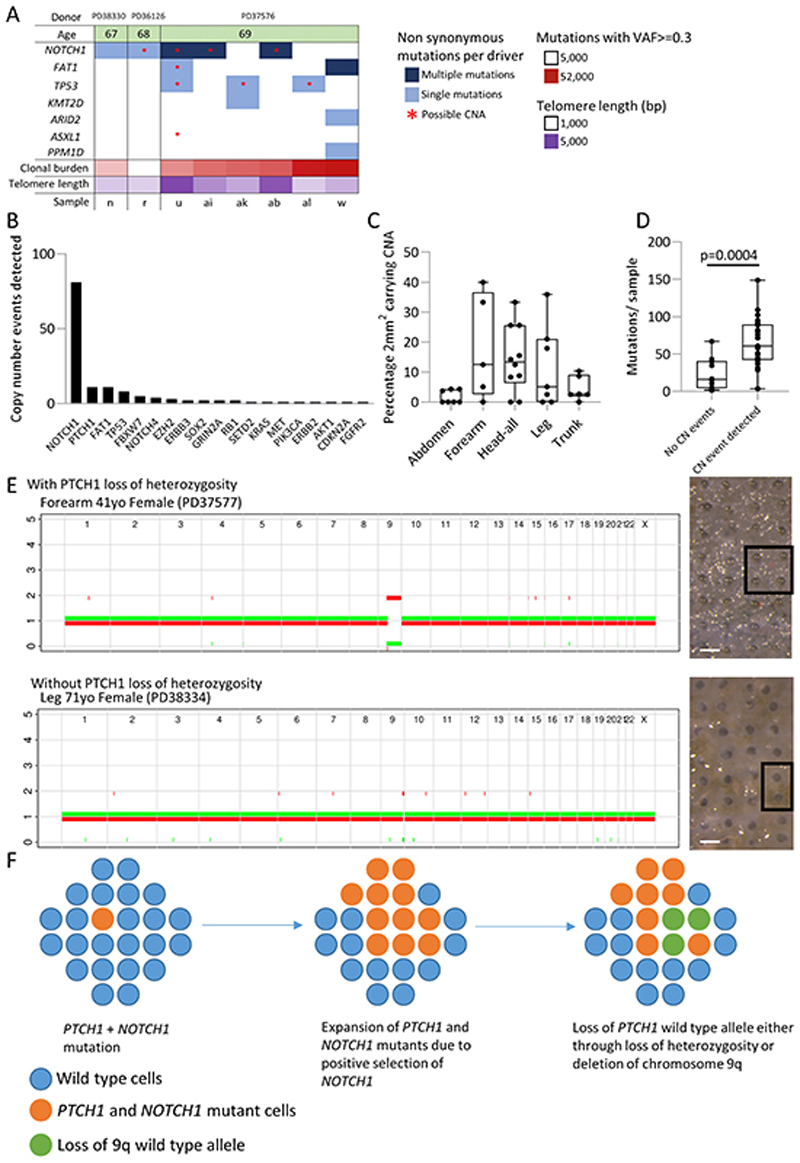
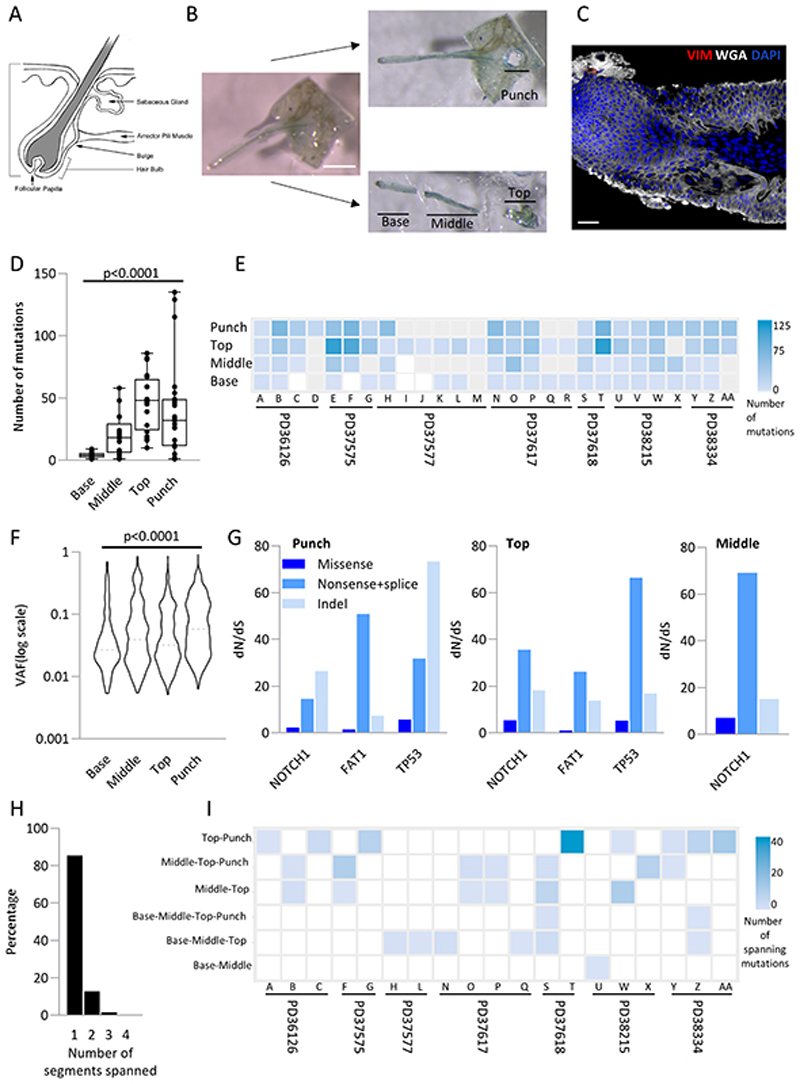
Skin cancer risk varies substantially across the body, yet how this relates to the mutations found in normal skin is unknown. Here we mapped mutant clones in skin from high- and low-risk sites. The density of mutations varied by location. The prevalence of NOTCH1 and FAT1 mutations in forearm, trunk, and leg skin was similar to that in keratinocyte cancers. Most mutations were caused by ultraviolet light, but mutational signature analysis suggested differences in DNA-repair processes between sites. Eleven mutant genes were under positive selection, with TP53 preferentially selected in the head and FAT1 in the leg. Fine-scale mapping revealed 10% of clones had copy-number alterations. Analysis of hair follicles showed mutations in the upper follicle resembled adjacent skin, but the lower follicle was sparsely mutated. Normal skin is a dense patchwork of mutant clones arising from competitive selection that varies by location. SIGNIFICANCE: Mapping mutant clones across the body reveals normal skin is a dense patchwork of mutant cells. The variation in cancer risk between sites substantially exceeds that in mutant clone density. More generally, mutant genes cannot be assigned as cancer drivers until their prevalence in normal tissue is known.See related commentary by De Dominici and DeGregori, p. 227.This article is highlighted in the In This Issue feature, p. 211.


Conflict of interest statement

Declaration of Interests

The authors declare no competing interests.

Conflict of Interest: The authors declare no potential conflicts of interest.

Figures

Figure 1
Figure 1. Human epidermis is a patchwork of small competing mutant clones
a. Tumor density (cancers/unit area) for BCC and SCC across different body sites, whole body = 1.0. Data from (3). b. Samples were collected from a variety of body sites with traditionally differing levels of sun exposure. c. Experimental outline: Normal peeled epidermis was cut into 2mm2 grids and sequenced at high depth using a 74 gene panel bait set. Mutations were called using the ShearwaterML algorithm. A total of 35 patients were sequenced across 37 positions clustered into five main sites; abdomen, head, forearm, leg, and trunk. An average of 39 2mm2 grids were sequenced per position. d. Total number of single base (SBS), double base (DBS) substitutions and insertion/deletion (indel) events across all 2mm2 grid samples from all body sites. e. Number of mutations per 2mm2 grid from all 1261 samples from the 35 patients. Each point represents a single 2mm2 grid. Patients are ordered by age and divided by body site. M = male, F = female. f. Average mutational burden (substitutions/Mb) per patient per site. Identical mutations in adjacent samples of a patient are merged (methods). g. Distribution of the number of mutations and maximum variant allele frequency of all 2mm2 samples per patient. Each point represents a single 2mm2 sample and point colours represent the maximum variant allele frequency in that 2mm2 sample. Patients are ordered by age. h. Variant allele frequency (VAF) distribution ordered by body site. Where adjacent grids share the same mutation this is assumed to be the same clone so the allele frequencies are summed as described in the methods. i and j. Heatmaps showing the variation in the number of mutations across the epidermis. i shows an example, from a contiguous strip of skin divided into three blocks from an ear, where 2mm2 samples carrying a high number of mutations cluster together. This is not the case for the leg sample shown in j. In j the two blocks of samples are approximately 1cm apart. In i the increase in the number of mutations correlates with an increase in the pigmentation seen in the epithelia.
Figure 2
Figure 2. Positive selection of genes linked with cancer in normal skin
a. dN/dS ratios for missense, nonsense/splice substitutions and insertions/deletions (indel) across all body sites for genes under significant (global q <0.01 and dN/dS>2) positive selection. b. Estimated percentage of cells carrying mutations in the most strongly positively selected genes (NOTCH1, FAT1, TP53 and NOTCH2) for each body site as well as for basal and squamous cell carcinomas (see methods). Upper and lower bound range allows for uncertainty in copy number and biallelic mutations. Upper bound represents no CNA and one mutant allele per gene. c-f: Positive selection of categories of missense mutations in NOTCH1 EGF repeats 11-12 that form part of the ligand binding domain: c. Structure of NOTCH1 EGF11-13 (PDB 2VJ3). Residues containing missense mutations that occur >10 times are highlighted. Ligand binding interface residues, blue; calcium binding residues, green; destabilising residues, red; D464N, orange, does not fit into the previous categories. Calcium ions shown in yellow. d. Missense mutations that are not on ligand-interface or calcium binding residues are significantly more destabilising than would be expected under neutral selection (p<2e−5, n=452, two-tailed Monte Carlo test, methods). e. Non-calcium binding missense mutations with ΔΔG < 2kcal/mol (i.e. are not highly destabilising) occur on the ligand-binding interface significantly more than would be expected under neutral selection (p=2e−25, n=315, two-tailed binomial test, error bars show 95% confidence intervals, methods). f. Missense mutations with ΔΔG < 2kcal/mol (i.e. are not highly destabilising) and that are not on the ligand-binding interface occur on calcium binding residues significantly more than would be expected under neutral selection (p=2e−22, n=195, two-tailed binomial test, error bars show 95% confidence intervals, methods). g-h: Positive selection of missense mutations in TP53 g. Sliding window plot of missense mutations per codon in TP53. Observed counts shown by the black line. Expected counts assuming that missense mutations were distributed across the gene according to the mutational spectrum (methods) shown in grey. DNA-binding domain (DBD) of TP53 shown in blue below the x-axis. h. Missense mutations in the TP53 DBD that are more than 5Å from the DNA are significantly more destabilising than would be expected under neutral selection (p<2e−5, n=760, two-tailed Monte Carlo test, methods). i. Missense mutations with ΔΔG < 2kcal/mol (not highly destabilising) in the TP53 DBD are significantly closer to the DNA than would be expected under neutral selection (p<2e−5, n=395, two-tailed Monte Carlo test, methods). j. Structure of the TP53 DNA-binding domain (PDB 2AC0) bound to DNA (orange). Residues containing missense mutations that occur at least 10 times are highlighted. Highly destabilising mutations (ΔΔG >= 2 kcal/mol) shown in red. Non-destabilising mutations shown in blue. k-n: Positive selection of missense mutations in PIK3CA k. Sliding window plot of missense mutations per codon in PIK3CA. Observed counts shown by the black line. Expected counts assuming that missense mutations were distributed across the gene according to the mutational spectrum (methods) shown in grey. Domains of PIK3CA encoded protein are shown below the x-axis. l. Significantly more single nucleotide substitutions in PIK3CA are annotated as pathogenic/likely pathogenic in the Clinvar database than would be expected under neutral selection (q=1e−8, n=216, two-tailed binomial test, error bars show 95% confidence intervals, methods). m. Significantly more missense mutations in PIK3CA occur in codons at the interface binding PIK3R1 (defined as PIK3CA residues with atoms within 5Å of PIK3R1 in PDB 4L1B) than would be expected under neutral selection (p=0.03, n=157, two-tailed binomial test, error bars show 95% confidence intervals, methods). n. Structure of PIK3CA protein, grey, bound to PIK3R1, green (PDB 4L1B). Residues with mutations occurring at least 3 times are highlighted. Mutations close to PIK3R1 shown in blue, other mutations that are annotated as pathogenic/likely pathogenic shown in red, all others shown in orange.
Figure 3
Figure 3. Human skin shows evidence of negative selection
a. dN/dS ratios for missense, nonsense/ splice substitutions and insertions/deletions (indels) across all body sites for genes under significant negative selection. Only genes with global q<0.01 are shown. b. Experimental outline: HaCaT cells (an immortalised keratinocyte cell line), were infected with lentivirus encoding Cas9 and guide RNAs (gRNA) targeting negatively selected genes or controls of non-targeting, AAVS1 safe harbour site, known essential and non-essential genes. Following puromycin selection, cells were cultured for a further two weeks at confluence in a high calcium media, which permits differentiation. Sequencing of gRNAs immediately after puromycin selection (t=0) and after two weeks at confluence (t=2) allows monitoring of changes in gRNA representation. c. Log fold change of gRNA representation between t=0 and t=2. Each dot represents a gRNA Genes chosen are those predicted to be under negative selection according to dN/dS ratios. *MAGeCK FDR<0.1.
Figure 4
Figure 4. Human epidermis shows selection and signature variation between body sites
a. Differential selection of TP53, NOTCH1 and FAT1 across different body sites. Number of non-synonymous mutations per gene from indicated body site versus all non-synonymous mutations in that gene from all other body sites. Each dot represents a gene from the 74 gene targeted bait panel. Solid line represents trendline with 95% CI marked (dotted line). For points highlighted in red, q<1×10⁻⁶ using a likelihood ratio test of dN/dS ratios (methods). b. Correlation between patient age and number of mutations attributed to signature SBS5. Linear regression p=0.0299, slope 0.067, intercept 0.608 c. Trinucleotide spectrum for single base substitutions of donor PD38219 which shows considerable differences to all other donors. This signature is consistent with SBS32 (cosine similarity 0.95) linked with azathioprine treatment. d. Combined trinucleotide spectra for single base substitutions in all samples from the head (top panel) and trunk (bottom panel) from targeted sequencing. Arrow indicates G(T>C)T peak which contributes to a higher proportion of overall burden in the head. Head = 14561 mutations, Trunk = 10515 mutations. e. Chi-squared test for all C>T mutations versus G(T>C)T mutations by body site (chi-squared 105, df=4, p=0). A higher proportion of G(T>C)T mutations are observed at sites with higher relative risk of cSCC.
Figure 5
Figure 5. Variation in mutational load, mutational signatures and telomere length at fine scale resolution
a. 0.25mm diameter punches were taken in a gridded array format from peeled epidermis. Samples were sequenced using a 324 gene bait panel and mutations identified using ShearwaterML as previously described. 232 punches from 6 individuals from leg, trunk and forearm were sequenced. A subset of samples were subsequently whole genome sequenced. Scale bar = 1mm. b. Heat map of a single individual (Trunk 76yo male PD38217; shown in A) showing the number of mutations per 0.25mm punch detected from targeted sequencing. c. Clonal map of the same individual as b. A filtered set of mutations with a variant allele fraction >= 0.2 was used to spatially map the clones, letters indicate individual samples, each color denotes a separate clone. White is used for polyclonal samples. Samples with too low DNA yield for sequencing have been removed from the map. d. Plot summarising the mutations (VAF>=0.3) and copy number aberrations for genes identified as being under positive selection in targeted sequencing data for 46 wholegenome punch samples. Age of donor, number of clonal (VAF>=0.3) mutations and telomere length for each sample is shown. Not all events are independent as some samples are part of the same clone (Figure 5e, Figure S5). e. Maximum parsimony tree of clonal substitutions detected in 32 whole-genome punch samples of trunk skin from a 76yo male (PD38217). Branch lengths are equivalent to the number of clonal single and double base substitutions and are annotated with clonal non-synonymous mutations detected in the 13 genes found to be under positive selection. Within each branch, driver mutations are arbitrarily ordered. Copy number alterations are shown in red. f. Combined trinucleotide spectra for single base substitutions assigned to branches of the dt/dl/dk clade (top panel) versus those assigned to all other branches (bottom panel) from same individual as E (PD38217). Arrows show trinucleotide contexts found to differ the most between these two groups (chi-squared =397, d.f. =4, p=0). Clone dt, dl, dk = 49144 mutations, all other clones = 458479 mutations. g. Variation in a single individual (PD38217) in the percentage of substitutions that are double base (DBS), telomere length and number of clonal (VAF of at least 0.3) insertion/deletions (indel) per whole genome sample. h-j. Variation in the percentage of substitutions that are double base (h), number of insertions/ deletions (indel) (i) and telomere length (j) per whole genome sample, by donor. Three different body sites are shown: forearm (orange), trunk (green) and leg (blue).
Figure 6
Figure 6. Normal human skin shows frequent copy number changes including loss of heterozygosity of PTCH1
a. Plot summarising the mutations (VAF>=0.3) and copy number alterations for genes identified as being under positive selection in targeted sequencing data for eight clonal whole-genome 2 mm2 grid samples. Age of donor, number of clonal (VAF>=0.3) mutations and telomere length for each sample is also shown. Not all events are independent since some samples are part of the same clone. Sample PD37576u shows multiple changes with loss of heterozygosity at 4q (FAT1), 9q (NOTCH1), 17p (TP53) and 20q (ASXL1). b. Number of copy number events per gene detected by SNP phasing of targeted sequence data in all 1261 2mm2 grid samples. c. Percentage of grids carrying a copy number event detectable by SNP phasing segregated by body site. Each dot represents an individual. d. Average number of mutations per 2mm2 grid in patients either carrying or not carrying a copy number event p=3.8×10⁻⁴, Student’s two tailed t-test e. Copy number profile of whole genome sequenced punch samples showing chromosome 9 loss of heterozygosity. The top example shows loss of heterozygosity for both NOTCH1 and PTCH1; the bottom example shows just NOTCH1 LOH. Scale bar = 0.5mm f. Possible origin of basal cell carcinoma. In a wild type population of cells (blue circles) a single cell acquires PTCH1 and then NOTCH1 non-synonymous mutations (marked orange), the clone size expands and persists due to NOTCH1 positive selection. At a later time point the wild type PTCH1 allele is lost either through deletion or loss of heterozygosity (marked green), thus leaving a clone lacking functional PTCH1 expression and primed for BCC transformation.
Figure 7
Figure 7. Human hair follicles are polyclonal with the base of the follicle showing differences in mutational load compared to the top
a. Structure of the human hair follicle (https://emedicine.medscape.com/article/835470-overview) b. Experimental outline: Intact hair follicles are dissected from the epidermis and cut into three (designated base, middle and top). A 0.25mm punch of epidermis was taken adjacent to the follicle (designated punch). All samples were sequenced at high depth using a 324 gene bait panel and mutations identified using ShearwaterML as previously. Scale bar = 0.5mm. c. Example confocal image of hair follicle stained with WGA (white), Vimentin (red), and dapi (blue). Scale bar = 38μm d. Distribution of the number of mutations in different parts of the follicle. Each dot represents a sample. Solid line indicates the median. p<0.0001 Kruskal-Wallis test. e. Number of exonic mutations per follicle across 324 genes. Each column represents a follicle with patient noted below. Each row is either the punch, top, middle or base. Samples that had insufficient DNA for sequencing are shown as grey. f. Violin plot of the variant allele frequency at each part of the follicle. Dashed line indicates the median. p<0.0001 Kruskal-Wallis test. g. dN/dS ratios for missense, nonsense/ splice substitutions and insertions/deletions (indel) across different parts of the follicle. Only genes with globalq<0.01 are shown. h. Percentage of mutations spanning more than one location (n=2009 mutations) i. Heatmap of number of mutations spanning different segments of the hair follicle. Each column is a follicle with the patient indicated below. Only follicles with spanning mutations are shown (methods). Spanning segments are detailed on the left.

Comment in

Similar articles

Cited by

References

    1. Martincorena I, Roshan A, Gerstung M, Ellis P, Van Loo P, McLaren S, et al. Tumor evolution. High burden and pervasive positive selection of somatic mutations in normal human skin. Science. 2015;348(6237):880–6. doi: 10.1126/science.aaa6806. - DOI - PMC - PubMed
    1. Hall MWJ, Jones PH, Hall BA. Relating evolutionary selection and mutant clonal dynamics in normal epithelia. Journal of the Royal Society Interface. 2019;16(156):20190230. doi: 10.1101/480756. - DOI - PMC - PubMed
    1. Subramaniam P, Olsen CM, Thompson BS, Whiteman DC, Neale RE. Anatomical Distributions of Basal Cell Carcinoma and Squamous Cell Carcinoma in a PopulationBased Study in Queensland, Australia. JAMA Dermatol. 2017;153(2):175–82. doi: 10.1001/jamadermatol.2016.4070. - DOI - PubMed
    1. Bergstresser PR, Pariser RJ, Taylor JR. Counting and sizing of epidermal cells in normal human skin. The Journal of investigative dermatology. 1978;70(5):280–4. doi: 10.1111/1523-1747.ep12541516. - DOI - PubMed
    1. Martincorena I, Fowler JC, Wabik A, Lawson ARJ, Abascal F, Hall MWJ, et al. Somatic mutant clones colonize the human esophagus with age. Science. 2018;362(6417):911–7. doi: 10.1126/science.aau3879. - DOI - PMC - PubMed

Publication types