. 2020 Oct 21;6(43):eabc4254.
doi: 10.1126/sciadv.abc4254. Print 2020 Oct.

A continuous pathway for fresh water along the East Greenland shelf

Affiliations

A continuous pathway for fresh water along the East Greenland shelf

Nicholas P Foukal et al. Sci Adv. .

Abstract

Export from the Arctic and meltwater from the Greenland Ice Sheet together form a southward-flowing coastal current along the East Greenland shelf. This current transports enough fresh water to substantially alter the large-scale circulation of the North Atlantic, yet the coastal current's origin and fate are poorly known due to our lack of knowledge concerning its north-south connectivity. Here, we demonstrate how the current negotiates the complex topography of Denmark Strait using in situ data and output from an ocean circulation model. We determine that the coastal current north of the strait supplies half of the transport to the coastal current south of the strait, while the other half is sourced from offshore via the shelfbreak jet, with little input from the Greenland Ice Sheet. These results indicate that there is a continuous pathway for Arctic-sourced fresh water along the entire East Greenland shelf from Fram Strait to Cape Farewell.


Figures

Fig. 1
Fig. 1. Circulation of the East Greenland shelf.
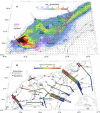
(A) Schematic circulation of the East Greenland shelf region. Bathymetry is shaded, and the 350- and 500-m isobaths are highlighted in black. The East Greenland Current (orange) flows southward at the shelfbreak along the entirety of East Greenland. The EGCC (pink) has been documented upstream of Denmark Strait and downstream of the Kangerdlugssuaq (KG) Trough, but its connection across Denmark Strait is unknown (dashed line). Other circulation features are shown in gray. The black dashed line outlines the region shown in (B). (B) Depth-integrated absolute geostrophic transports (see section S1) for water with salinity less than 34 from various hydrographic sections across Denmark Strait (year and cruise codes provided in legend). Bathymetric contours are shown every 25 m for 0 to 250 m, every 50 m for 250 to 500 m, and every 200 m deeper than 600 m. The 250-, 350-, 500-, and 1000-m isobaths are highlighted in black.
Fig. 2
Fig. 2. Observed and modeled hydrography at the Kögur line.
Salinity (A and B) and velocity (C and D) at the Kögur hydrographic line. The observed mean conditions (A and C) are averaged over three synoptic snapshots in October 2008 (KN194), August 2011 (KN203), and August 2012 (JR267). Black triangles above (A) and (C) indicate the typical 5-km spacing of CTD stations along the three transects. The model mean conditions (B and D) are averaged over the entire model year. In (A) to (D), isopycnals (kg/m3) are overlaid in black, and bathymetry is shaded in gray. Bounds of the coastal current (fresher than 34 salinity and between 0 and 30 km from the coast) are outlined in white in (C) and (D). Southward currents located between 40 and 80 km offshore are considered part of the shelfbreak jet. (E) Time series of the coastal current volume transport from the model. The observed transports calculated from the three snapshots are indicated by the arrows to the right of the plot.
Fig. 3
Fig. 3. Observed and modeled hydrography at the 66°N line.
Salinity (A and B) and velocity (C and D) at the 66°N line. The observed mean conditions (A and C) are averaged over three synoptic snapshots in August 2004 (JR105), October 2008 (KN194), and October 2018 (AR30). KN194 and AR30 sampled to within 3 km of the coast, while JR105 ended 15 km from the coast. Black triangles above (A) and (C) indicate the typical 5-km spacing of CTD stations along the three transects. The model mean conditions (B and D) are averaged over the entire model year. In (A) to (D), isopycnals (kg/m3) are overlaid in black, and bathymetry is shaded in gray. Bounds of the coastal current (fresher than 34 salinity and between 0 and 50 km from the coast) are outlined in white in (C) and (D). (E) Time series of the coastal current volume transport from the model. The observed transports calculated from the three snapshots are indicated by the arrows to the right of the plot.
Fig. 4
Fig. 4. Modeled and observed pathways across Denmark Strait.
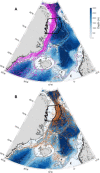
Fresh water pathways across Denmark Strait. (A) Modeled fresh water pathways from Eulerian and Lagrangian perspectives. Distribution of Lagrangian trajectories (color shading, note the log scale) seeded at the 66°N section (black circles) and run backward in time for 150 days (see section S3 for a full description of the Lagrangian trajectories). The Eulerian volume transports across model sections 1 to 4 for waters fresher than 34 salinity are shown by the magenta vectors. The time-averaged surface stress vectors are shown in black. (B) Observational evidence for fresh water convergence upstream of the Kangerdlugssuaq Trough. Depth of the 34 isohaline at various hydrographic sections (shaded circles). Sections that have been occupied multiple times are offset from one another for clarity. Surface drifter crossing locations as the drifters enter the domain (cyan stars) and leave the domain or stop functioning (magenta stars). Model sections 2 and 3 (gray line) constitute the seaward edge of the domain.
Fig. 5
Fig. 5. Observed surface circulation of the East Greenland shelf.
Trajectories of ice-mounted buoys from the International Arctic Buoy Program. (A) All 92 buoys that crossed the shelf region delimited by the western polygon in black. (B) All 59 buoys that crossed the region offshore of the 500-m isobath, delimited by the eastern polygon. While all the buoys shown here are initially ice mounted, they continue as surface drifters once the ice around them melts.

References

    1. Lin P., Pickart R. S., Torres D. J., Pacini A., Evolution of the freshwater coastal current at the southern tip of Greenland. J. Phys. Oceanogr. 48, 2127–2140 (2018).
    1. Le Bras I. A. A., Straneo F., Holte J., Holliday N. P., Seasonality of freshwater in the East Greenland current system from 2014 to 2016. J. Geophys. Res. Ocean. 123, 8828–8848 (2018).
    1. Straneo F., Heimbach P., North Atlantic warming and the retreat of Greenland’s outlet glaciers. Nature 504, 36–43 (2013). - PubMed
    1. Trusel L. D., Das S. B., Osman M. B., Evans M. J., Smith B. E., Fettweis X., McConnell J. R., Noël B. P. Y., van den Broeke M. R., Nonlinear rise in Greenland runoff in response to post-industrial Arctic warming. Nature 564, 104–108 (2018). - PubMed
    1. Rahmstorf S., Box J. E., Feulner G., Mann M. E., Robinson A., Rutherford S., Schaffernicht E. J., Exceptional twentieth-century slowdown in Atlantic Ocean overturning circulation. Nat. Clim. Chang. 5, 475–480 (2015).

LinkOut - more resources