. 2020 Oct 21;6(43):eabe5310.
doi: 10.1126/sciadv.abe5310. Print 2020 Oct.

MCART1/SLC25A51 is required for mitochondrial NAD transport

Affiliations

MCART1/SLC25A51 is required for mitochondrial NAD transport

Nora Kory et al. Sci Adv. .

Abstract

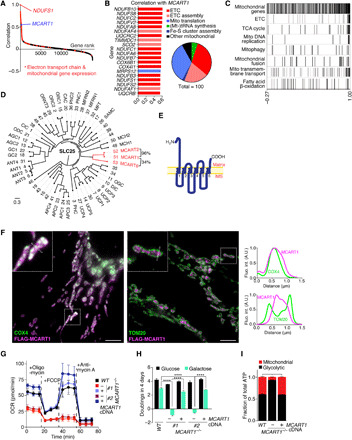
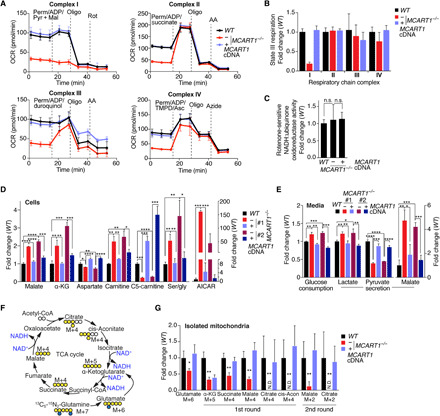
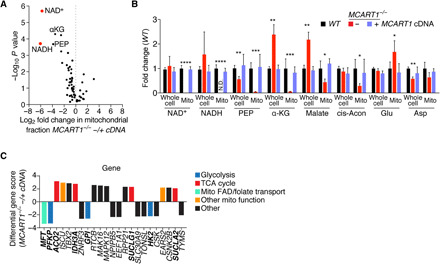
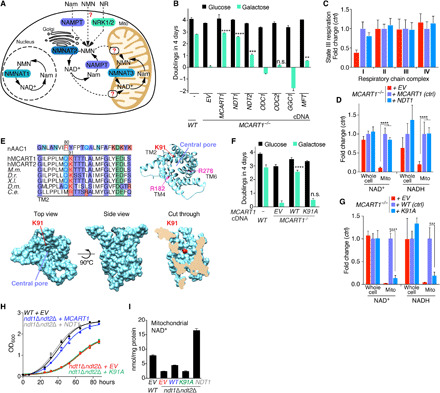
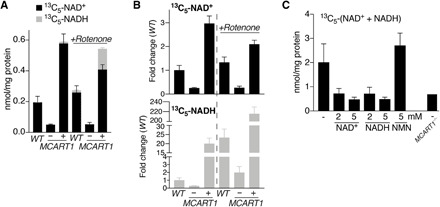
The nicotinamide adenine dinucleotide (NAD+/NADH) pair is a cofactor in redox reactions and is particularly critical in mitochondria as it connects substrate oxidation by the tricarboxylic acid (TCA) cycle to adenosine triphosphate generation by the electron transport chain (ETC) and oxidative phosphorylation. While a mitochondrial NAD+ transporter has been identified in yeast, how NAD enters mitochondria in metazoans is unknown. Here, we mine gene essentiality data from human cell lines to identify MCART1 (SLC25A51) as coessential with ETC components. MCART1-null cells have large decreases in TCA cycle flux, mitochondrial respiration, ETC complex I activity, and mitochondrial levels of NAD+ and NADH. Isolated mitochondria from cells lacking or overexpressing MCART1 have greatly decreased or increased NAD uptake in vitro, respectively. Moreover, MCART1 and NDT1, a yeast mitochondrial NAD+ transporter, can functionally complement for each other. Thus, we propose that MCART1 is the long sought mitochondrial transporter for NAD in human cells.


Figures

Fig. 1
Fig. 1. MCART1 (SLC25A51) is an inner mitochondrial membrane solute carrier required for ETC function.
(A) Genes coessential with the respiratory complex I subunit NDUFS1 (8). Gene ontology (GO) annotation of ETC or mitochondrial gene expression are in red. (B) MCART1 is coessential with mitochondrial respiration genes. GO annotation of the top 20 (left) and 100 (right) highest-correlated genes with MCART1. Mt, mitochondrial; Fe-S, iron-sulfur. (C) Plot displays enrichment of ETC components, TCA cycle, and mitochondrial DNA replication. Genes (black lines) are plotted from lowest to highest correlation with MCART1. (D) Phylogenetic tree of the human SLC25 family of mitochondrial carriers. MCART1 and the closely related MCART2 and MCART6 (with % sequence identity) are in red. (E) Predicted topology of MCART1. IMS, intermembrane space. (F) MCART1 localizes to the inner mitochondrial membrane. HeLa cells expressing FLAG-MCART1 were processed for immunofluorescence detection and STED microscopy. FLAG epitope, magenta; inner (COX4; left) or outer (Tom20; right) mitochondrial membrane, green; overlap of channels, white. Scale bar, 2 μm. A.U., arbitrary units. (G) Loss of MCART1 decreases oxygen consumption rate (OCR) (means ± SD; n ≥ 13 technical replicates). (H) MCART1-null cells cannot proliferate using galactose as the carbon source (means ± SD; n = 3; ****P < 0.0001). (I) MCART1 loss reduces mitochondrial ATP production (means ± SD; n ≥ 13 technical replicates).
Fig. 2
Fig. 2. Loss of MCART1 causes loss of ETC complex I activity and defects in mitochondrial metabolism without affecting mitochondrial integrity.
(A) Loss of MCART1 diminishes respiratory complex I activity but not that of other complexes. OCR of permeabilized cells supplemented with adenosine diphosphate (ADP) and complex I to IV substrates (means ± SD; n = 3 technical replicates). Mal, malate; perm, permeabilizer; pyr, pyruvate; rot, rotenone; AA, antimycin A; TMPD, tetramethyl-phenylenediamine. (B) Loss of MCART1 diminishes complex I–dependent state 3 respiration. Graph from data in Fig. 2A. (C) Rotenone-sensitive NADH:ubiquinone activity in mitochondrial lysates is not dependent on MCART1 (means ± SD; n = 3; n.s., not significant). (D) Mitochondrial and mitochondria-derived metabolites are changed in MCART1-null cells compared to wild-type counterparts (means ± SD; n = 3; *P < 0.05, **P < 0.01, ***P < 0.001, ****P < 0.0001). α-KG, α-ketoglutarate; ser, serine; gly, glycine; AICAR, 5-aminoimidazole-4-carboxamide ribonucleotide. (E) Loss of MCART1 increases glucose consumption and lactate and malate excretion and decreases pyruvate secretion. Medium metabolites were extracted after cells grew 48 hours in RPMI (means ± SD; n = 3; *P < 0.05, **P < 0.01, ***P < 0.001, ****P < 0.0001). (F) Glutamine tracing scheme used to measure TCA cycle flux. (G) TCA cycle flux depends on MCART1. Metabolites generated by isolated mitochondria from 13C5,15N2-glutamine in the first and second rounds of the TCA cycle according to (F) were detected by LC-MS (means ± SD; n = 3; *P < 0.05, **P < 0.01). cis-Acon, cis-aconitate. N.D., not detected.
Fig. 3
Fig. 3. NAD+ and NADH are depleted in the mitochondria of MCART1-null cells.
(A) NAD+ and NADH are the most depleted metabolites in mitochondria of MCART1-null cells. The log2 fold change of metabolites detected in mitochondria isolated from MCART1-null cells versus in mitochondria from null cells expressing MCART1 cDNA (mean; n = 3). (B) Loss of MCART1 depletes NAD+ and NADH in mitochondria and reduces TCA cycle intermediates. Whole cell and mitochondrial metabolite levels in indicated cells were measured by LC-MS using the Mito-IP method, data from two independent experiments were combined (means ± SD; n > 5). Asterisks denote statistically significant differences of MCART1-null samples with both wild-type cells and cells re-expressing the MCART1 cDNA (*P < 0.05, **P < 0.01, ***P < 0.001, ****P < 0.0001). Data from the second MCART1-null clone are shown in fig. S2I. (C) MCART1-null cells depend on glycolytic enzymes and mitochondrial FAD/folate transporter. Top-scoring genes from the MCART1 synthetic lethality screen. Genes were ranked according to the differential gene score in MCART1-null versus control cells. PEP, phosphoenolpyruvate; glu, glutamate; asp, aspartate; mito, mitochondrial; FAD, flavin adenine dinucleotide.
Fig. 4
Fig. 4. MCART1 and the yeast mitochondrial NAD+ transporter NDT1 are functional homologs of each other.
(A) The NAD salvage pathway. Nam, nicotinamide; NR, nicotinamide riboside; NRK, nicotinamide riboside kinase; NAMPT, nicotinamide phosphoribosyltransferase. (B) Yeast NDT1 but not closest sequence homologs of MCART1 in yeast rescues growth in galactose of MCART1-null cells. Asterisks denote significant differences in galactose between cells expressing the empty vector and the solute carrier homologs, respectively (means ± SD; n = 3). ODC, oxodicarboxylate carrier; GGC, guanosine triphosphate/guanosine diphosphate carrier; MFT, mitochondrial FAD/folate carrier. (C) In MCART1-null cells, NDT1 expression rescues complex I activity (means ± SD; n > 3 technical replicates) and (D) mitochondrial NAD levels (means ± SD; n > 3). (E) Alignment of MCART1 homologs and comparison with ADP/ATP carrier identifies lysine 91 and arginines 182 and 278 as potential substrate contact points. (F) Mutation of lysine 91 to alanine abolishes MCART1-dependent proliferation on galactose (means ± SD; n = 3). (G) MCART1 K91A does not rescue mitochondrial NAD levels (means ± SD; n = 4). (H) Wild-type but not mutant MCART1 rescues proliferation of two independent clones of ndt1Δndt2Δ S. cerevisiae in synthetic minimal media with 2% ethanol. (I) Mitochondrial NAD+ concentrations normalized to protein content in wild-type or ndt1Δndt2Δ yeast transformed with indicated vectors (means ± SD; n = 3 technical replicates). EV, empty vector; **P < 0.01, ***P < 0.001, ****P < 0.0001.
Fig. 5
Fig. 5. Mitochondrial NAD uptake depends on MCART1.
(A) Transport of NAD+ into mitochondria depends on MCART1. Mitochondria purified from wild-type, MCART1-null, or MCART1-null cells overexpressing the MCART1 cDNA were incubated with 50 μM stably isotope labeled 13C5-NAD+ for 10 min at 30°C with or without 5 μM rotenone. Levels of uptaken 13C5-NAD+ and generated 13C5-NADH were quantified by LC-MS (means ± SD; n = 3 uptake reaction replicates). (B) Fold change of NAD+ and NADH uptake data in (A). (C) MCART1-dependent mitochondrial NAD transport is competed by NAD+ and NADH but not the NAD synthesis intermediate NMN. Wild-type mitochondria were incubated for 10 min with 500 μM 13C5-NAD+ in the presence of unlabeled metabolites as indicated. The level of background binding/uptake in MCART1-null mitochondria is shown on the right. The sum of quantified 13C5-NAD+ and 13C5-NADH is shown (means ± SD; n = 3 uptake reaction replicates).

Comment in

References

    1. Houtkooper R. H., Cantó C., Wanders R. J., Auwerx J., The secret life of NAD+: An old metabolite controlling new metabolic signaling pathways. Endocr. Rev. 31, 194–223 (2010). - PMC - PubMed
    1. Verdin E., NAD+ in aging, metabolism, and neurodegeneration. Science 350, 1208–1213 (2015). - PubMed
    1. Rajman L., Chwalek K., Sinclair D. A., Therapeutic potential of NAD-boosting molecules: The in vivo evidence. Cell Metab. 27, 529–547 (2018). - PMC - PubMed
    1. Stein L. R., Imai S.-i., The dynamic regulation of NAD metabolism in mitochondria. Trends Endocrinol. Metab. 23, 420–428 (2012). - PMC - PubMed
    1. Todisco S., Agrimi G., Castegna A., Palmieri F., Identification of the mitochondrial NAD+ transporter in Saccharomyces cerevisiae. J. Biol. Chem. 281, 1524–1531 (2006). - PubMed

Publication types