. 2020 Oct 21;6(43):eaaz9360.
doi: 10.1126/sciadv.aaz9360. Print 2020 Oct.

Integrated proteomics reveals brain-based cerebrospinal fluid biomarkers in asymptomatic and symptomatic Alzheimer's disease

Affiliations

Integrated proteomics reveals brain-based cerebrospinal fluid biomarkers in asymptomatic and symptomatic Alzheimer's disease

Lenora Higginbotham et al. Sci Adv. .

Abstract

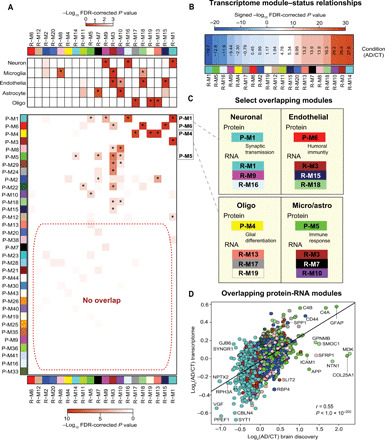
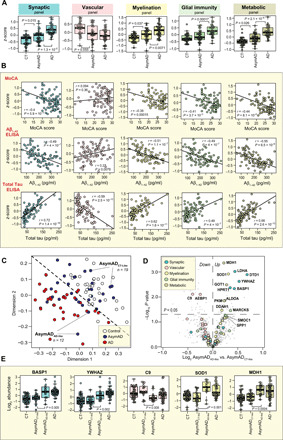
Alzheimer's disease (AD) lacks protein biomarkers reflective of its diverse underlying pathophysiology, hindering diagnostic and therapeutic advancements. Here, we used integrative proteomics to identify cerebrospinal fluid (CSF) biomarkers representing a wide spectrum of AD pathophysiology. Multiplex mass spectrometry identified ~3500 and ~12,000 proteins in AD CSF and brain, respectively. Network analysis of the brain proteome resolved 44 biologically diverse modules, 15 of which overlapped with the CSF proteome. CSF AD markers in these overlapping modules were collapsed into five protein panels representing distinct pathophysiological processes. Synaptic and metabolic panels were decreased in AD brain but increased in CSF, while glial-enriched myelination and immunity panels were increased in brain and CSF. The consistency and disease specificity of panel changes were confirmed in >500 additional CSF samples. These panels also identified biological subpopulations within asymptomatic AD. Overall, these results are a promising step toward a network-based biomarker tool for AD clinical applications.


Figures

Fig. 1
Fig. 1. Differential expression of discovery CSF proteome.
(A) Volcano plot displaying the log2 fold change (x axis) against the t test–derived −log10 statistical P value (y axis) for all proteins differentially expressed between control (CT) and AD cases of the CSF discovery proteome. Proteins with significantly decreased levels in AD (P < 0.05) are shown in blue, while the proteins with significantly increased levels in disease are noted in red. Select proteins are labeled. (B) Top GO terms associated with proteins significantly decreased (blue) and increased (red) in AD. The three GO terms with the highest z-scores in the domains of biological process, molecular function, and cellular component are shown. (C) MAPT levels in the discovery CSF samples measured by MS (left) and their correlations to sample ELISA tau levels (right). Pearson correlation coefficient with associated P value is shown. Because of missing ELISA data for one AD case, these plots included values across 38 of the 39 analyzed cases. (D) Supervised cluster analysis across the control and AD CSF discovery samples using the 65 most significantly altered proteins in the dataset (P < 0.0001, Benjamini-Hochberg (BH)–corrected P < 0.01). Norm, normalized.
Fig. 2
Fig. 2. Network analysis of the discovery brain proteome.
(A) WGCNA of the discovery brain proteome. (B) Biweight midcorrelation (BiCor) analysis of module eigenproteins (the first principle components of module protein expression) with neuropathological hallmarks of AD (top), including CERAD (Aβ plaque) and Braak (tau tangle) scores. The strengths of positive (red) and negative (blue) correlations are shown by two-color heatmap with asterisks denoting statistical significance (P < 0.05). The cell type associations of each protein module were assessed using a hypergeometric Fisher’s exact test (FET) (bottom). The strength of the red shading indicates the degree of cell type enrichment with asterisks denoting statistical significance (P < 0.05). The FET-derived P values were corrected using the BH method. (C) GO analysis of module proteins. The most strongly associated biological processes are shown for each module or group of related modules. oligo, oligodendrocyte.
Fig. 3
Fig. 3. Overlap between protein and RNA coexpression networks in AD.
(A) Hypergeometric FETs demonstrating enrichment of cell type–specific markers within RNA modules of the AD transcriptome (top) and degree of overlap between RNA (x axis) and protein (y axis) modules of the AD brain (bottom). The strength of red shading indicates the degree of cell type enrichment in the top panel and strength of module overlap in the bottom panel. Asterisks denote statistical significance (P < 0.05). (B) Degree of correlation between each transcriptome module eigengene and AD status with those modules most negatively correlated to AD on the left (blue) and those most positively correlated to AD on the right (red). Log-transformed BH-corrected P value indicates degree of statistical significance for each correlation. (C) Notable overlapping modules with shared cell type enrichment. (D) Correlation analysis of the protein (x axis) and RNA (y axis) log2 fold changes of markers within overlapping modules. Pearson correlation coefficient with associated P value is shown. Micro, microglia; astro, astrocyte. CT, control.
Fig. 4
Fig. 4. Integrative analysis of CSF and brain proteomes yields panels of brain-linked CSF AD biomarkers.
(A and B) Overlap of proteins detected in the discovery brain and CSF datasets. Most of these overlapping proteins were linked to 1 of the 44 coexpression modules of the brain coexpression network. (C) Overlap between the discovery CSF proteome and discovery brain network proteome. Each line of the heatmap represents a separate overlap analysis by hypergeometric FET. The top row depicts the overlap (gray/black shading) between brain modules and the entire CSF proteome. The second row depicts the overlap (red shading) between brain modules and CSF proteins significantly up-regulated in AD (P < 0.05). The third row demonstrates the overlap (blue shading) between brain modules and CSF proteins significantly down-regulated in AD (P < 0.05). The FET-derived P values were corrected using the BH method. (D) Collapsed module panels based on cell type associations and related GO terms. These panels comprised a total of 271 brain-linked proteins with meaningful differential expression in the CSF proteome.
Fig. 5
Fig. 5. CSF biomarker panels demonstrate reproducibility and disease specificity in replication cohorts.
(A) Brain-linked CSF protein targets validated in the first replication CSF cohort and included in the final panels (n = 60). (B to E) Levels of panel biomarkers (composite z-score) measured in four CSF replication cohorts. Pairwise t test or ANOVA with Tukey post hoc correction was used to assess the statistical significance of abundance changes within each replication analysis. CT, control.
Fig. 6
Fig. 6. CSF biomarker panels identify subgroups within AsymAD.
(A) Expression levels (z-score) of CSF biomarker panels across all 96 samples of the CSF replication 1 cohort, including AsymAD. ANOVA with Tukey post hoc correction was used to assess the statistical significance of panel abundance changes. (B) Correlation analyses of panel protein abundance levels (z-score) to MoCA scores and ELISA Aβ1–42 and total tau levels across the CSF replication 1 samples. Pearson correlation coefficients with associated P values are shown. (C) MDS of the 96 CSF replication 1 cases based on the abundance levels of the 29 validated panel markers that were significantly altered [P < 0.05 AD/control (CT)] in both the discovery and CSF replication 1 datasets. This analysis was used to divide the AsymAD group into control-like (n = 19) and AD-like (n = 12) subgroups. (D) Volcano plot displaying the log2 fold change (x axis) against the −log10 statistical P value for all CSF replication 1 proteins differentially expressed between the two AsymAD subgroups. Panel biomarkers are colored. (E) CSF replication 1 abundance levels of select panel biomarkers differentially expressed between AsymAD subgroups. ANOVA with Tukey post hoc correction was used to assess statistical significance.

References

    1. Lista S., Zetterberg H., O’Bryant S. E., Blennow K., Hampel H., Evolving relevance of neuroproteomics in Alzheimer’s disease. Methods Mol. Biol. 1598, 101–115 (2017). - PubMed
    1. Castrillo J. I., Lista S., Hampel H., Ritchie C. W., Systems biology methods for Alzheimer’s disease research toward molecular signatures, subtypes, and stages and precision medicine: Application in cohort studies and trials. Methods Mol. Biol. 1750, 31–66 (2018). - PubMed
    1. De Strooper B., Karran E., The cellular phase of Alzheimer’s disease. Cell 164, 603–615 (2016). - PubMed
    1. Blennow K., Hampel H., Weiner M., Zetterberg H., Cerebrospinal fluid and plasma biomarkers in Alzheimer disease. Nat. Rev. Neurol. 6, 131–144 (2010). - PubMed
    1. Jack C. R. Jr., Bennett D. A., Blennow K., Carrillo M. C., Dunn B., Haeberlein S. B., Holtzman D. M., Jagust W., Jessen F., Karlawish J., Liu E., Molinuevo J. L., Montine T., Phelps C., Rankin K. P., Rowe C. C., Scheltens P., Siemers E., Snyder H. M., Sperling R., NIA-AA research framework: Toward a biological definition of Alzheimer’s disease. Alzheimers Dement. 14, 535–562 (2018). - PMC - PubMed

Publication types