

Geospatial evaluation of trade-offs between equity in physical access to healthcare and health systems efficiency
- PMID: 33087394
- PMCID: PMC7580044
- DOI: 10.1136/bmjgh-2020-003493
Geospatial evaluation of trade-offs between equity in physical access to healthcare and health systems efficiency
Abstract
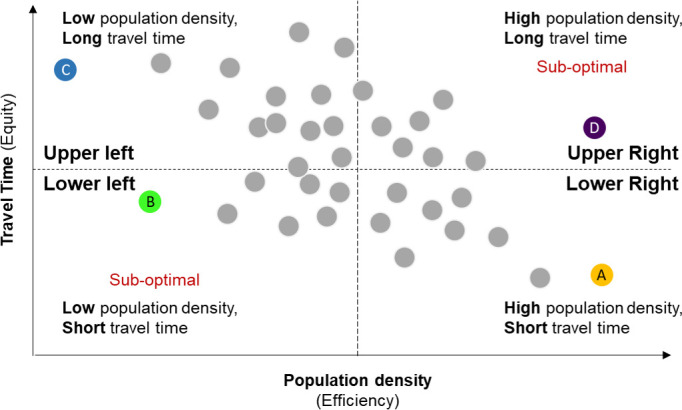
Introduction: Decisions regarding the geographical placement of healthcare services require consideration of trade-offs between equity and efficiency, but few empirical assessments are available. We applied a novel geospatial framework to study these trade-offs in four African countries.
Methods: Geolocation data on population density (a surrogate for efficiency), health centres and cancer referral centres in Kenya, Malawi, Tanzania and Rwanda were obtained from online databases. Travel time to the closest facility (a surrogate for equity) was estimated with 1 km resolution using the Access Mod 5 least cost distance algorithm. We studied associations between district-level average population density and travel time to closest facility for each country using Pearson's correlation, and spatial autocorrelation using the Global Moran's I statistic. Geographical clusters of districts with inefficient resource allocation were identified using the bivariate local indicator of spatial autocorrelation.
Results: Population density was inversely associated with travel time for all countries and levels of the health system (Pearson's correlation range, health centres: -0.89 to -0.71; cancer referral centres: -0.92 to -0.43), favouring efficiency. For health centres, negative spatial autocorrelation (geographical clustering of dissimilar values of population density and travel time) was weaker in Rwanda (-0.310) and Tanzania (-0.292), countries with explicit policies supporting equitable access to rural healthcare, relative to Kenya (-0.579) and Malawi (-0.543). Stronger spatial autocorrelation was observed for cancer referral centres (Rwanda: -0.341; Tanzania: -0.259; Kenya: -0.595; Malawi: -0.666). Significant geographical clusters of sparsely populated districts with long travel times to care were identified across countries.
Conclusion: Negative spatial correlations suggested that the geographical distribution of health services favoured efficiency over equity, but spatial autocorrelation measures revealed more equitable geographical distribution of facilities in certain countries. These findings suggest that even when prioritising efficiency, thoughtful decisions regarding geographical allocation could increase equitable physical access to services.
Keywords: geographic information systems; health policy; health services research; health systems evaluation; public health.
© Author(s) (or their employer(s)) 2020. Re-use permitted under CC BY-NC. No commercial re-use. See rights and permissions. Published by BMJ.
Conflict of interest statement
Competing interests: LFS reports holding stocks from InheRET and personal fees from Roche Diagnostics, outside the submitted work.
Figures


References
-
- Inter-Agency and Expert Group on SDG Indicators Report of the Inter-Agency and expert group on sustainable development goal indicators (E/CN.3/2017/2), Annex III, 2017. Available: https://www-sciencedirect-com.ezp-prod1.hul.harvard.edu/science/article/... [Accessed 20 Apr 2020].
-
- Anand S. The concern for equity in health. in: public health, ethics, and equity. New York: Oxford University Press, 2004: 15–20.
Publication types
MeSH terms
Grants and funding
LinkOut - more resources
Full Text Sources
Medical