. 2020 Nov 25;40(48):9210-9223.
doi: 10.1523/JNEUROSCI.0999-20.2020. Epub 2020 Oct 21.

Structure of Population Activity in Primary Motor Cortex for Single Finger Flexion and Extension

Affiliations

Structure of Population Activity in Primary Motor Cortex for Single Finger Flexion and Extension

Spencer A Arbuckle et al. J Neurosci. .

Abstract

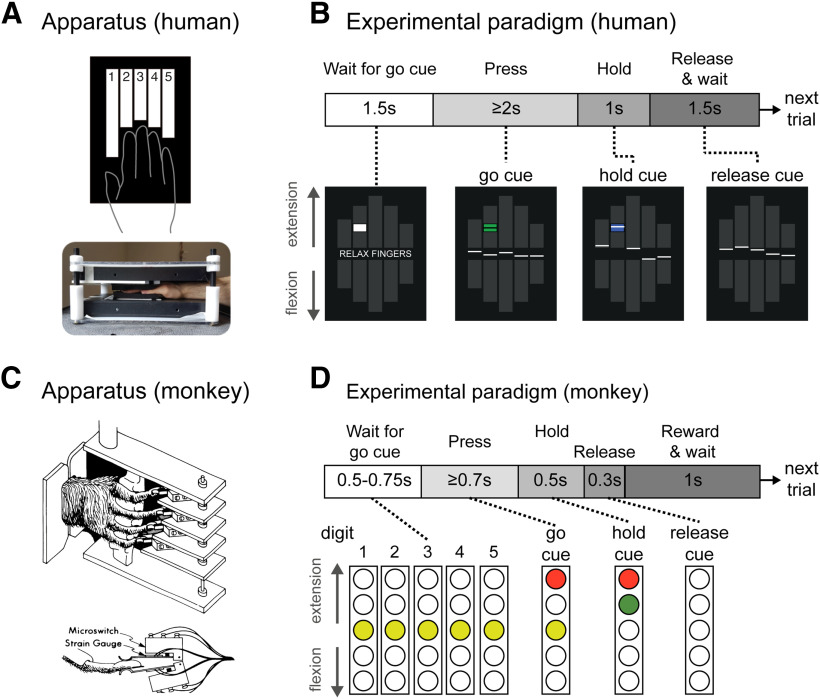
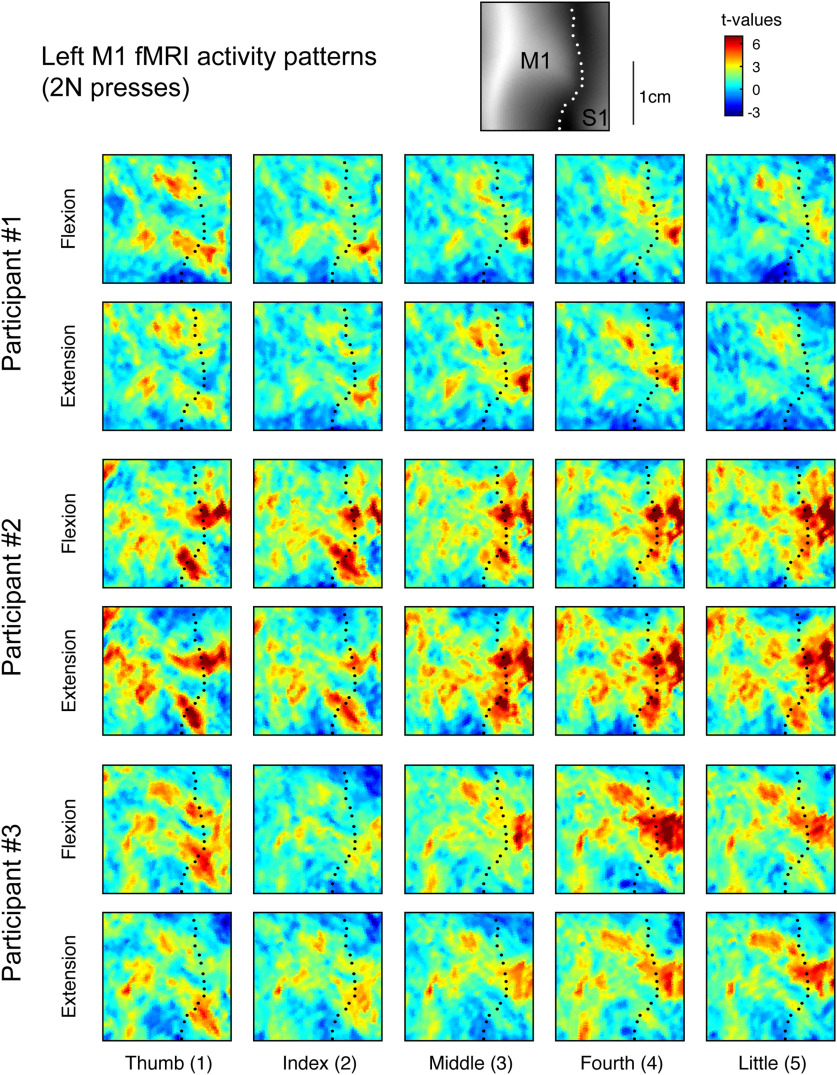
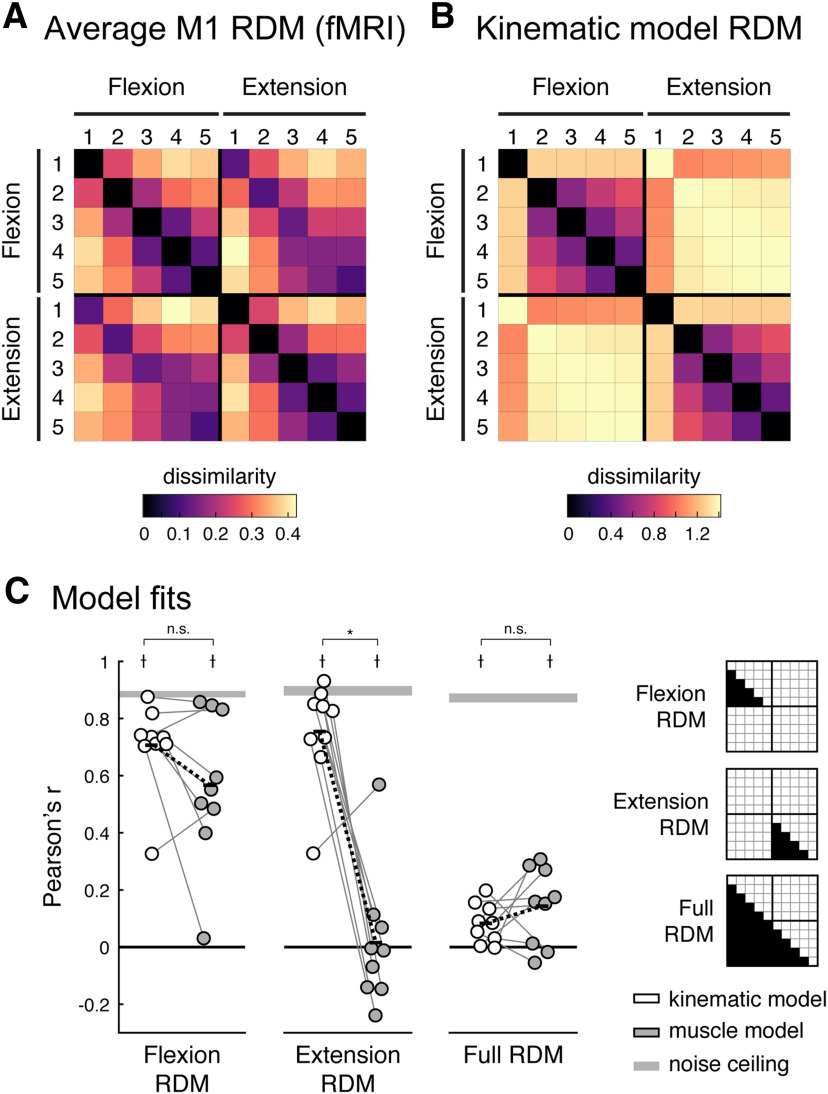
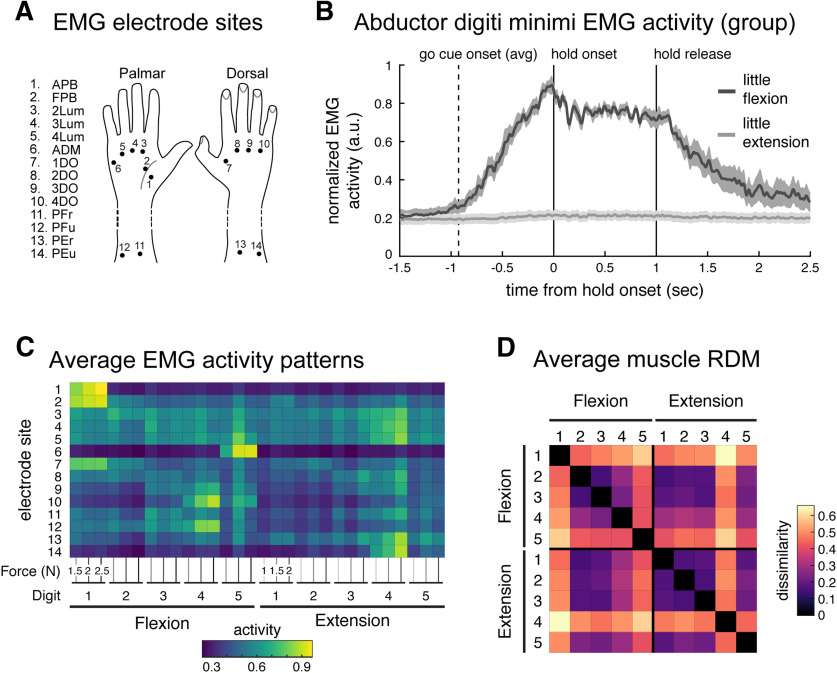
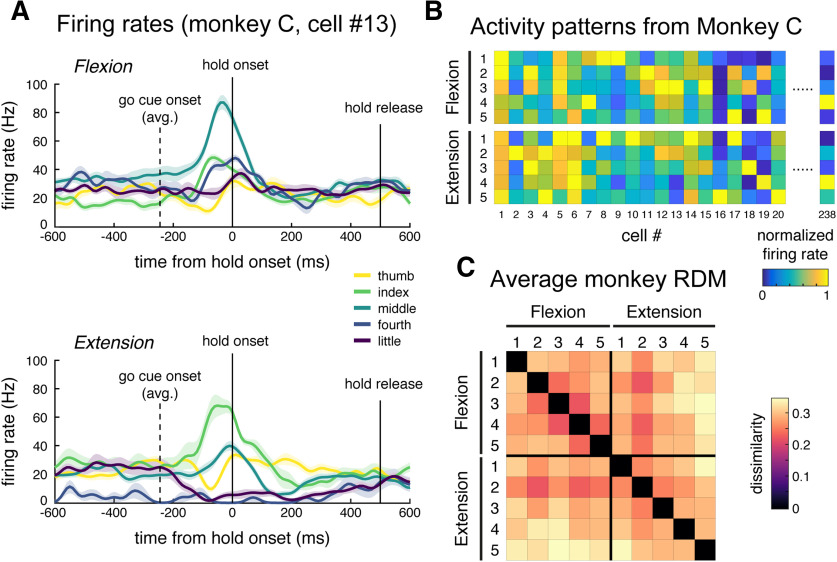
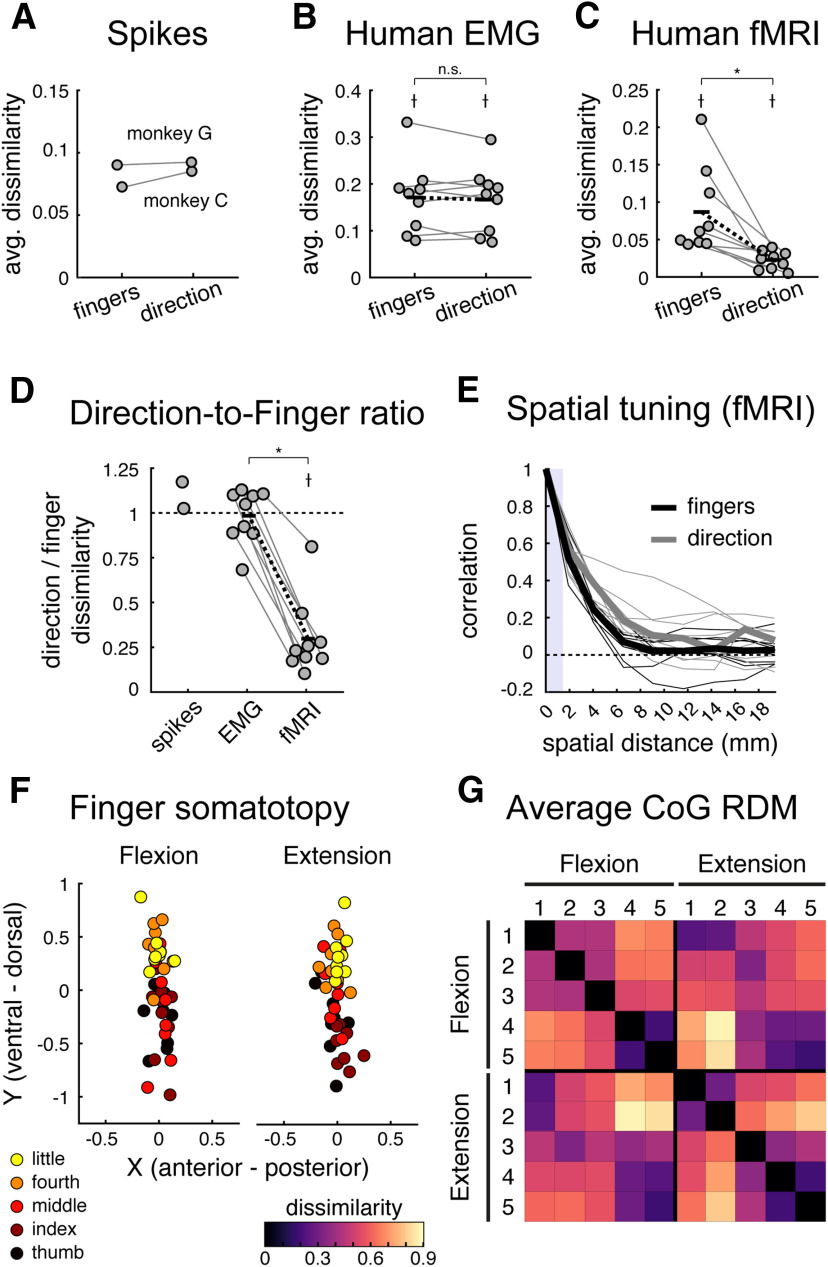
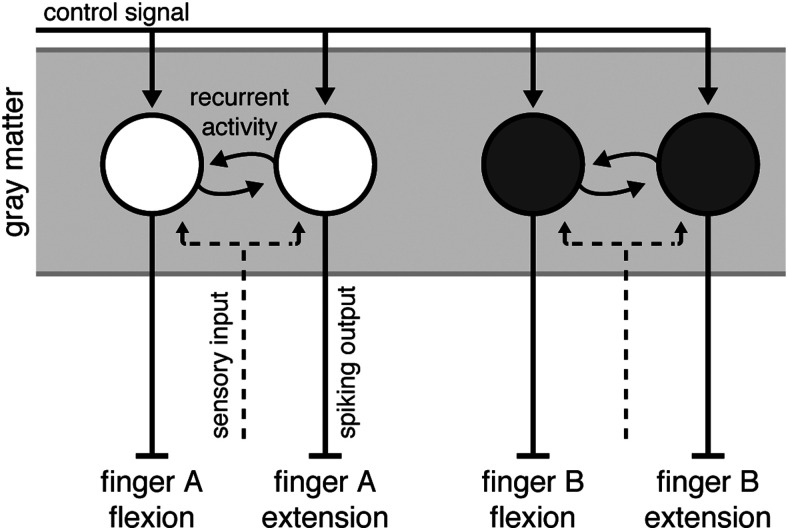
How is the primary motor cortex (M1) organized to control fine finger movements? We investigated the population activity in M1 for single finger flexion and extension, using 7T functional magnetic resonance imaging (fMRI) in female and male human participants and compared these results to the neural spiking patterns recorded in two male monkeys performing the identical task. fMRI activity patterns were distinct for movements of different fingers, but were quite similar for flexion and extension of the same finger. In contrast, spiking patterns in monkeys were quite distinct for both fingers and directions, which is similar to what was found for muscular activity patterns. The discrepancy between fMRI and electrophysiological measurements can be explained by two (non-mutually exclusive) characteristics of the organization of finger flexion and extension movements. Given that fMRI reflects predominantly input and recurrent activity, the results can be explained by an architecture in which neural populations that control flexion or extension of the same finger produce distinct outputs, but interact tightly with each other and receive similar inputs. Additionally, neurons tuned to different movement directions for the same finger (or combination of fingers) may cluster closely together, while neurons that control different finger combinations may be more spatially separated. When measuring this organization with fMRI at a coarse spatial scale, the activity patterns for flexion and extension of the same finger would appear very similar. Overall, we suggest that the discrepancy between fMRI and electrophysiological measurements provides new insights into the general organization of fine finger movements in M1.SIGNIFICANCE STATEMENT The primary motor cortex (M1) is important for producing individuated finger movements. Recent evidence shows that movements that commonly co-occur are associated with more similar activity patterns in M1. Flexion and extension of the same finger, which never co-occur, should therefore be associated with distinct representations. However, using carefully controlled experiments and multivariate analyses, we demonstrate that human fMRI activity patterns for flexion or extension of the same finger are highly similar. In contrast, spiking patterns measured in monkey M1 are clearly distinct. This suggests that populations controlling opposite movements of the same finger, while producing distinct outputs, may cluster together and share inputs and local processing. These results provide testable hypotheses about the organization of hand control in M1.

Keywords: electrophysiology; fMRI; fingers; hand control; humans; monkeys; primary motor cortex.


Figures

Figure 1.
Figure 1.
Experiment paradigms. A, Human participants made isometric single finger presses in the flexion and extension directions on a custom-built keyboard. Each finger of the right hand was clamped between two keys, and each key was associated with a force transducer either above (keyboard on top of hand) or below (keyboard under the hand) the key to monitor forces applied in the flexion and extension directions, respectively. B, Schematic illustration for a single trial in the fMRI and EMG sessions, with associated visual feedback shown below. The white lines represent the produced force for each finger. Applying flexion to a finger key moved the associated line down (vice versa for extension). The cue box (centered at target force) was initially presented as white at the trial start, and turned green to cue the participant to make the finger press (here, index finger extension). The box turned blue to instruct participants to maintain the current force. At the end of the press hold, the cue box disappeared and participants relaxed their hand. C, The monkey hand configuration and device (illustration from Schieber, 1991). D, Trial schematic for the monkey task. The columns represent five LED cues (one per finger) that instructed the monkey both what finger and what direction to press. The monkeys had up to 700 ms from the onset of the go-cue to press the cued finger in the cued direction. They were trained to hold the press for 500 ms before relaxing the finger.
Figure 2.
Figure 2.
fMRI activity patterns for finger flexion and extension in human M1. Evoked fMRI activity maps (t values) for three participants for each of the five fingers pressing in the extension and flexion directions at 2 N. Results were normalized to a surface-based atlas. Maps are shown in the hand-knob region of the left (contralateral) hemisphere. The black dotted line shows the fundus of the central sulcus. The top inset shows the average sulcal depth.
Figure 3.
Figure 3.
Representational structure of fingers and direction in human M1. A, Group average of the fMRI RDM. B, Predicted RDM from the kinematic model. To aid visual inspection, the values of the RDMs in A and B are plotted as the square root of the dissimilarities. All statistical analyses of the RDMs are done on squared distances. C, Model fits (Pearson's correlation) of the kinematic (white) and muscle (gray) models to the M1 RDM for flexion, extension, and the full RDMs (the indices for each RDM are shown on the right). The muscle model was specific to each participant and was estimated from the EMG data. The gray bars denote noise ceilings (theoretically, the best possible fits). Each dot reflects one participant, and thin gray lines connect fits of each model to the same participant. Black bars denote the means, and black dashed lines denoted the mean paired difference. *Significant differences between model fits (one-sided paired t test, p < 0.05); significantly lower than the noise ceiling (two-sided paired t test, p < 0.05); n.s., not significant (p > 0.05).
Figure 4.
Figure 4.
Quantifying similarity of muscle activity patterns during finger flexion and extension. A, Fourteen surface electrode sites. B, Group averaged normalized EMG (normalized, per participant, to peak activity from this electrode across trials) from the ADM muscle during 2 N little finger (5) flexion (dark gray) and extension (light gray) trials, aligned to hold onset (0 s). During extension movement (light gray trace, >1000 ms), this flexor muscle was not recruited. Shaded areas reflect SEM. Traces were smoothed with a Gaussian kernel (FWHM, 25ms). C, Average muscle activity across participants, normalized by peak activation across conditions (per participant), recorded from the 14 electrode sites during the flexion extension task. Each condition was measured under three force conditions. D, Group average RDM of the muscle activity patterns. As in Figure 2, the RDM is plotted as square root dissimilarities to aid visual inspection.
Figure 5.
Figure 5.
Analysis of M1 spiking activity during monkey single finger flexion and extension. A, Trial averaged firing rates from one cell (monkey C). Traces are aligned to press onset (0 s). This cell demonstrates selective tuning to middle finger flexion and index finger extension. Firing rates were calculated for 10 ms bins and smoothed with a Gaussian kernel (FWHM, 50ms). Shaded areas reflect SE across trials. B, Averaged firing rates for a subset of cells from monkey C, arranged by condition. Cell 13 is plotted in A. Firing rates are normalized to the peak rate per cell. C, Average monkey RDM (square root dissimilarities).
Figure 6.
Figure 6.
Comparing strength of finger and direction representations across datasets. A–C, The average finger- and direction-specific dissimilarities for the spiking (A), human EMG (B), and human fMRI (C) datasets. Each dot denotes one participant, and lines connect dots from the same participants. Black bars denote the means, and black dashed lines reflect the mean paired differences. Dissimilarities significantly larger than zero (one-sided t test, p < 0.05); *significant difference between finger and direction dissimilarities (two-sided paired t test, p < 0.05). D, The ratio of the direction-to-finger dissimilarities for each dataset. Values <1 indicate stronger finger representation. Dissimilarities significantly lower than one (one-sided t test, p < 0.05); *significant differences between dissimilarity ratios (two-sided paired t test, p < 0.05); n.s., not significant (p > 0.05). E, Estimated spatial autocorrelations of finger (black) and direction (gray) pattern components in human M1, plotted as a function of spatial distance between voxels. No significant difference was observed between finger and direction tuning in M1. The thick lines denote the median spatial autocorrelation functions, and small lines are drawn for each participant for each pattern component. The vertical shaded bar denotes the distance between voxel size, for which correlations can be induced by motion correction. F, CoG of activation elicited by single finger presses in the flexion or extension direction for each participant. CoGs were aligned across participants before plotting by subtracting the center of the informative region within each participant (i.e., the mean CoG across all conditions). A somatotopic gradient for finger flexion and extension in Brodmann area 4a is visible with the thumb being more ventral, and the little finger more dorsal. G, Group average RDM of the paired Euclidean distance between condition CoGs.
Figure 7.
Figure 7.
Summary model of M1 organization. Output neurons in M1 produce complex patterns of muscular activity. We refer to groups of neurons that, together, evoke a complex pattern of muscle activity that results in single finger movements as functional units (circles). These functional units receive a control signal input for the upcoming movement (solid lines with arrows). Functional units that evoke movements of the same finger in opposite directions receive common inputs (dashed lines) and share strong recurrent connections (circular lines). The spiking output (solid lines without arrows) of these units, however, is directionally specific. Additionally, under the spatial scale model, functional units tuned to finger movements in different directions are clustered together according to their finger tuning.

References

    1. Arbuckle SA, Yokoi A, Pruszynski JA, Diedrichsen J (2019) Stability of representational geometry across a wide range of fMRI activity levels. Neuroimage 186:155–163. 10.1016/j.neuroimage.2018.11.002 - DOI - PubMed
    1. Attwell D, Laughlin SB (2001) An energy budget for signaling in the grey matter of the brain. J Cereb Blood Flow Metab 21:1133–1145. 10.1097/00004647-200110000-00001 - DOI - PubMed
    1. Beringer CR, Mansouri M, Fisher LE, Collinger JL, Munin MC, Boninger ML, Gaunt RA (2020) The effect of wrist posture on extrinsic finger muscle activity during single joint movements. Sci Rep 10:8377. - PMC - PubMed
    1. Bortoff GA, Strick PL (1993) Corticospinal terminations in two new-world primates: further evidence that corticomotoneuronal connections provide part of the neural substrate for manual dexterity. J Neurosci 13:5105–5118. 10.1523/JNEUROSCI.13-12-05105.1993 - DOI - PMC - PubMed
    1. Darling WG, Pizzimenti MA, Rotella DL, Peterson CR, Hynes SM, Ge J, Solon K, McNeal DW, Stilwell-Morecraft KS, Morecraft RJ (2009) Volumetric effects of motor cortex injury on recovery of dexterous movements. Exp Neurol 220:90–108. 10.1016/j.expneurol.2009.07.034 - DOI - PMC - PubMed

Publication types

LinkOut - more resources