. 2020 Oct 21;12(566):eabb5831.
doi: 10.1126/scitranslmed.abb5831.

Calmodulin inhibitors improve erythropoiesis in Diamond-Blackfan anemia

Affiliations

Calmodulin inhibitors improve erythropoiesis in Diamond-Blackfan anemia

Alison M Taylor et al. Sci Transl Med. .

Abstract

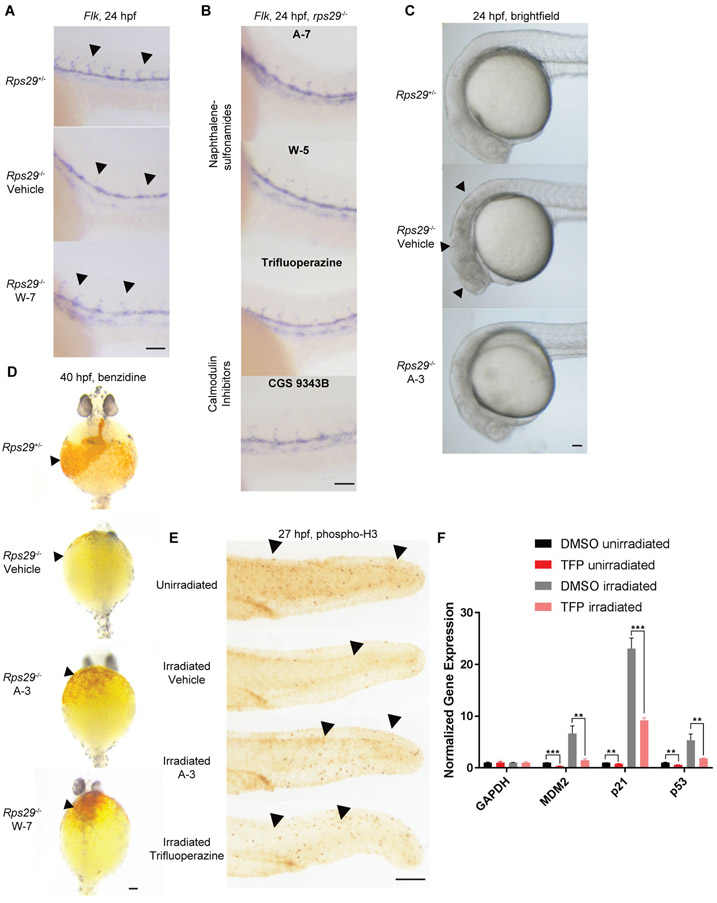
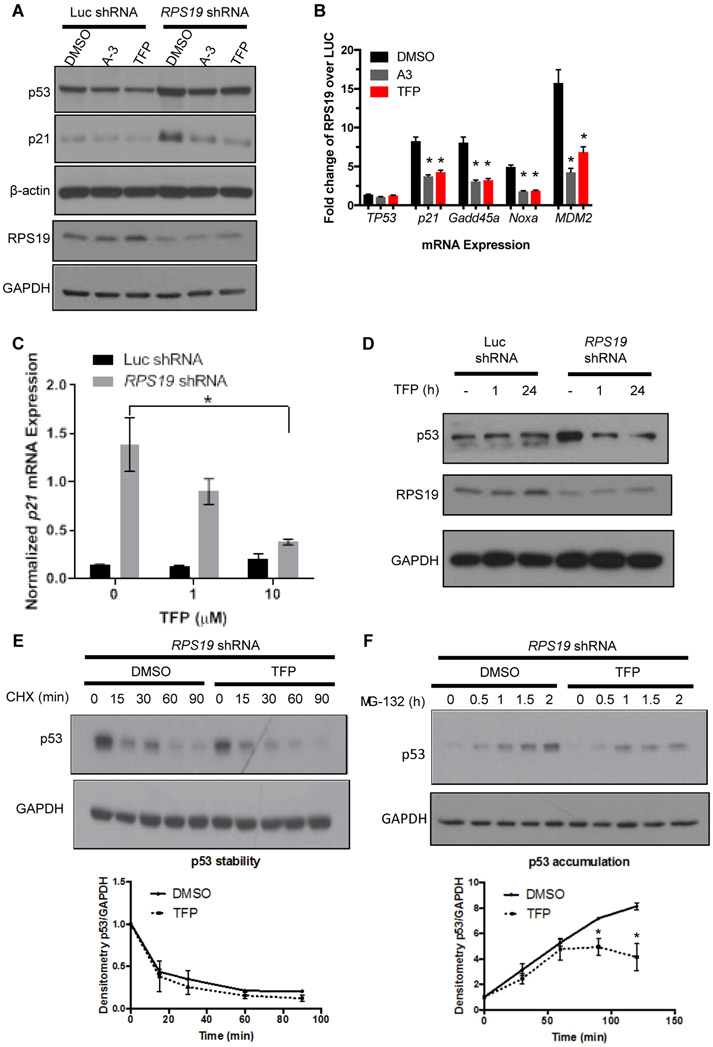
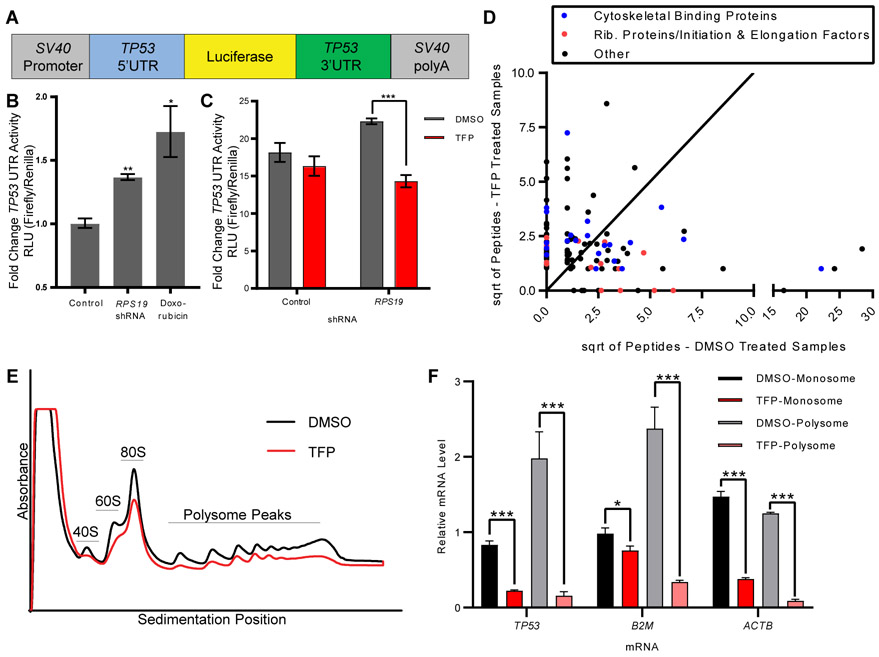
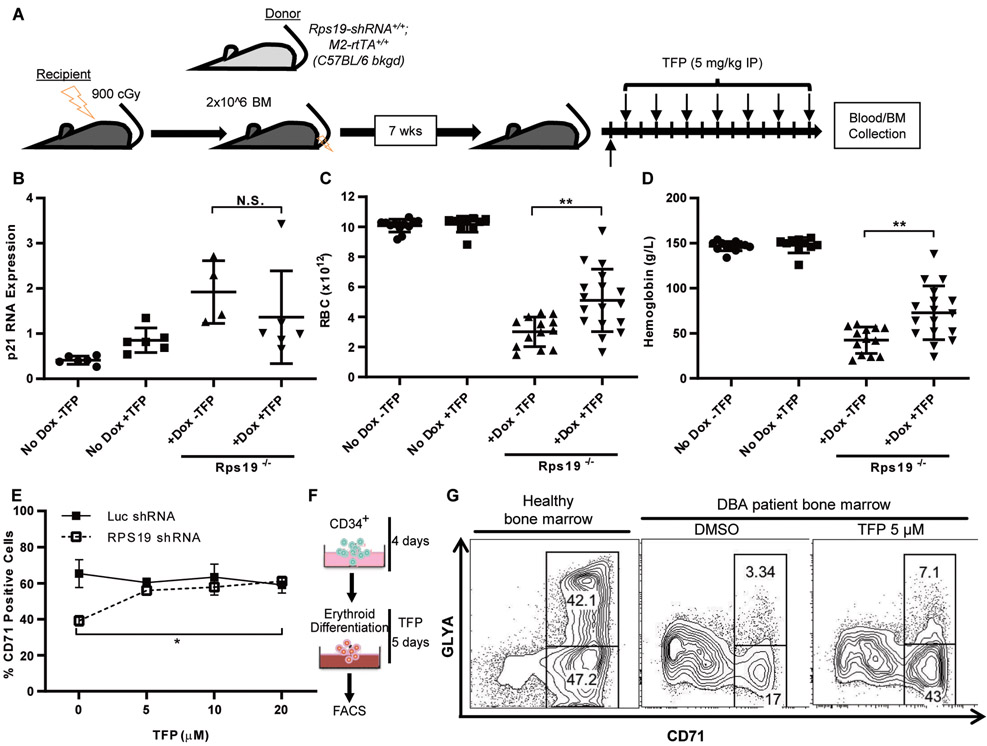
Diamond-Blackfan anemia (DBA) is a rare hematopoietic disease characterized by a block in red cell differentiation. Most DBA cases are caused by mutations in ribosomal proteins and characterized by higher than normal activity of the tumor suppressor p53. Higher p53 activity is thought to contribute to DBA phenotypes by inducing apoptosis during red blood cell differentiation. Currently, there are few therapies available for patients with DBA. We performed a chemical screen using zebrafish ribosomal small subunit protein 29 (rps29) mutant embryos that have a p53-dependent anemia and identified calmodulin inhibitors that rescued the phenotype. Our studies demonstrated that calmodulin inhibitors attenuated p53 protein amount and activity. Treatment with calmodulin inhibitors led to decreased p53 translation and accumulation but does not affect p53 stability. A U.S. Food and Drug Administration-approved calmodulin inhibitor, trifluoperazine, rescued hematopoietic phenotypes of DBA models in vivo in zebrafish and mouse models. In addition, trifluoperazine rescued these phenotypes in human CD34+ hematopoietic stem and progenitor cells. Erythroid differentiation was also improved in CD34+ cells isolated from a patient with DBA. This work uncovers a potential avenue of therapeutic development for patients with DBA.


Figures

Fig. 1.
Fig. 1.. Calmodulin inhibitors rescue rps29−/− defects and irradiation-induced phenotypes in zebrafish embryos.
A. Embryos from an rps29+/− incross were treated with DMSO (vehicle) or W-7 at 10 hpf and collected at 24 hpf for in situ hybridization of flk1. Arrowheads denote intersegmental vessels. Scale bar = 100 μm. B. Rps29−/− embryos were treated with A-7, W-5, TFP, or CGS 9343B at 10 hpf and collected at 24 hpf for in situ hybridization of flk. Scale bar = 100 μm. C. Embryos from an rps29+/− incross were treated with DMSO or A-3 at 10 hpf and imaged at 24 hpf. Arrowheads denote cell death in the head of the developing embryo, which looks dark and cloudy. Scale bar = 100 μm. D. Embryos from an rps29+/− incross were treated with DMSO, A-3, or W-7 at 10 hpf and collected at 40 hpf for benzidine (o-dianisidine) staining of hemoglobinized cells. Arrowheads denote location of hemoglobin-positive cells (or lack thereof) around the yolk sac of the embryo. Scale bar = 100 μm. E. Wildtype embryos were treated with DMSO, A-3, or TFP at 50% epiboly (5.25 hpf), irradiated at 10 Gy at 24 hpf, and collected for phospho-H3 staining at 25.5 hpf. Arrowheads denote phospho-H3 positive cells. Scale bar = 100 μm. F. Wildtype embryos were treated with DMSO or TFP at 50% epiboly (5.25 hpf), irradiated at 10 Gy at 24 hpf, and collected for RNA isolation and qPCR at 25.5 hpf. *Student’s t-test -p < 0.01, *** p < 0.001.
Fig. 2.
Fig. 2.. TFP dose-dependently reduces p53 in RPS19-deficient human cells and primary human hematopoietic progenitors.
A. p53 and p21 protein, as measured by Western blot, in A549 cells with shRNA targeting luciferase or RPS19 and treated with DMSO, 50 μM A-3, or 20 μM TFP. B. qPCR measuring expression of TP53, P21, GADD45A, NOXA, or MDM2 in A549 cells with shRNA targeting luciferase or RPS19 and treated with DMSO, A-3, or TFP. Student t-test, *p < 0.05 compared to DMSO control. (C-D) CD34+ cells were transduced with RPS19 or control shRNA and selected for successfully transduced GFP+ cells. C. qPCR measuring p21 mRNA in CD34+ cells treated with increasing doses of TFP. Student t-test, *p < 0.05. D. Western blot measuring RPS19 and p53 proteins in CD34+ cells treated for increasing lengths of time with 10 μM TFP. (E-F) CD34+ cells were infected with RPS19 shRNA and selected for GFP+ successfully transduced cells by FACS. Western blots of p53 and GAPDH were quantified by densitometry. E. Cells were pre-treated with TFP for 15-30 minutes before treatment with 10 μM CHX for increasing lengths of time before lysates were collected for TP53 and GAPDH protein quantification. F. Cells were pre-treated with TFP for 2 hours before treatment with 20 μM MG-132 for increasing lengths of time before lysates were collected for TP53 and GAPDH protein quantification. Two-way ANOVA, *p < 0.05.
Fig. 3.
Fig. 3.. TFP inhibition of translation is sufficient to decrease translation of p53.
A. Schematic of construct with TP53 UTRs and luciferase(20). B. 293T cells were transduced with RPS19 shRNA or treated with doxorubicin before transfection with TP53 UTR luciferase construct and control Renilla luciferase construct. Y-axis shows relative luminescence units, representing the ratio of firefly luciferase (p53 UTR construct) to Renilla luciferase (control). Student t-test, *p < 0.05, **p <0.01. C. 293T cells were transduced with RPS19 shRNA or control, treated with DMSO or TFP, and transfected with TP53 UTR luciferase construct and control Renilla luciferase construct. Y-axis shows relative luminescence units, representing the ratio of firefly luciferase (TP53 UTR construct) to Renilla luciferase (control). Student t-test, ***p < 0.001. D. RNA Affinity Purification (RAP) identified proteins bound to TP53 mRNA in the presence or absence of TFP. Axes show the square roots of summed peptide counts from mass spectrometry. Each dot represents a protein observed bound to TP53 mRNA more than control mRNA. E. CD34+ cells were transduced with shRNA against RPS19, sorted for successfully transduced GFP+ cells, and treated with DMSO or 10 μM TFP for 24 hours. Polysome profiles were generated, with the y-axis representing absorbance. Black line is the profile for DMSO-treated cells, red line is the profile for TFP-treated cells. F. RNA was isolated from monosome and polysome fractions of treated cells, and TP53, β2M, and ACTβ mRNAs were measured by qPCR. Relative mRNA quantity represents Ct values normalized to each sample’s pool of all polysome fractions. Student’s t-test, *p < 0.05, *** p < 0.001.
Fig. 4.
Fig. 4.. TFP improves erythropoiesis in a DBA mouse model and primary cells from a patient with DBA.
A. Schematic of mouse transplantation and drug treatment. Unfractionated bone marrow from inducible Rps19 shRNA donor mice was transplanted into irradiated wildtype recipients. After engraftment, hairpin expression was induced with doxycycline and mice were treated with TFP or vehicle for two weeks. B. RNA was isolated from bone marrow collected from recipient mice after two weeks of treatment. (C-D) Peripheral blood samples from recipient mice were analyzed using a Hemavet hematology system for red blood cell counts (C) and hemoglobin (D). Student t-test, **p < 0.01. E. CD34+ cells were expanded for four days prior to infection with shRNAs targeting luciferase or RPS19. Infected cells were selected with puromycin beginning on day 5, and drug was added to the medium beginning on day 7. Cells were processed for flow cytometry on day 10. Percentage of CD71+ cells, as measured by flow cytometry, in CD34+ cells treated with increasing doses of TFP. Two-way ANOVA, *p < 0.05. F. Schematic of CD34+ HSPC differentiation. CD34+ cells were expanded for 4 days prior to addition of DMSO or TFP for 5 days. G. CD34+ cells isolated from a DBA patient were expanded for four days prior to treatment with DMSO or TFP. Percentages of CD71+ and GLYA+ cells, as measured by flow cytometry, in treated cells. Left = healthy bone marrow, right = bone marrow from a patient with DBA, with and without TFP treatment.

References

    1. Vlachos A, Ball S, Dahl N, Alter BP, Sheth S, Ramenghi U, Meerpohl J, Karlsson S, Liu JM, Leblanc T, Paley C, Kang EM, Leder EJ, Atsidaftos E, Shimamura A, Bessler M, Glader B, Lipton JM, C. Participants of Sixth Annual Daniella Maria Arturi International Consensus, Diagnosing and treating Diamond Blackfan anaemia: results of an international clinical consensus conference. Br J Haematol 142, 859–876 (2008). - PMC - PubMed
    1. Vlachos A, Rosenberg PS, Atsidaftos E, Alter BP, Lipton JM, Incidence of neoplasia in Diamond Blackfan anemia: a report from the Diamond Blackfan Anemia Registry. Blood 119, 3815–3819 (2012). - PMC - PubMed
    1. Draptchinskaia N, Gustavsson P, Andersson B, Pettersson M, Willig TN, Dianzani I, Ball S, Tchernia G, Klar J, Matsson H, Tentler D, Mohandas N, Carlsson B, Dahl N, The gene encoding ribosomal protein S19 is mutated in Diamond-Blackfan anaemia. Nat Genet 21, 169–175 (1999). - PubMed
    1. Sakamoto KM, Narla A, Perspective on Diamond-Blackfan anemia: lessons from a rare congenital bone marrow failure syndrome. Leukemia 32, 249–251 (2018). - PMC - PubMed
    1. Ulirsch JC, Verboon JM, Kazerounian S, Guo MH, Yuan D, Ludwig LS, Handsaker RE, Abdulhay NJ, Fiorini C, Genovese G, Lim ET, Cheng A, Cummings BB, Chao KR, Beggs AH, Genetti CA, Sieff CA, Newburger PE, Niewiadomska E, Matysiak M, Vlachos A, Lipton JM, Atsidaftos E, Glader B, Narla A, Gleizes PE, O'Donohue MF, Montel-Lehry N, Amor DJ, McCarroll SA, O'Donnell-Luria AH, Gupta N, Gabriel SB, MacArthur DG, Lander ES, Lek M, Da Costa L, Nathan DG, Korostelev AA, Do R, Sankaran VG, Gazda HT, The Genetic Landscape of Diamond-Blackfan Anemia. Am J Hum Genet 103, 930–947 (2018). - PMC - PubMed

Publication types