. 2020 Oct 21;5(5):e00637-20.
doi: 10.1128/mSphere.00637-20.

Effectiveness of Face Masks in Preventing Airborne Transmission of SARS-CoV-2

Affiliations

Effectiveness of Face Masks in Preventing Airborne Transmission of SARS-CoV-2

Hiroshi Ueki et al. mSphere. .

Abstract

Guidelines from the CDC and the WHO recommend the wearing of face masks to prevent the spread of coronavirus (CoV) disease 2019 (COVID-19); however, the protective efficiency of such masks against airborne transmission of infectious severe acute respiratory syndrome CoV-2 (SARS-CoV-2) droplets/aerosols is unknown. Here, we developed an airborne transmission simulator of infectious SARS-CoV-2-containing droplets/aerosols produced by human respiration and coughs and assessed the transmissibility of the infectious droplets/aerosols and the ability of various types of face masks to block the transmission. We found that cotton masks, surgical masks, and N95 masks all have a protective effect with respect to the transmission of infective droplets/aerosols of SARS-CoV-2 and that the protective efficiency was higher when masks were worn by a virus spreader. Importantly, medical masks (surgical masks and even N95 masks) were not able to completely block the transmission of virus droplets/aerosols even when completely sealed. Our data will help medical workers understand the proper use and performance of masks and determine whether they need additional equipment to protect themselves from infected patients.IMPORTANCE Airborne simulation experiments showed that cotton masks, surgical masks, and N95 masks provide some protection from the transmission of infective SARS-CoV-2 droplets/aerosols; however, medical masks (surgical masks and even N95 masks) could not completely block the transmission of virus droplets/aerosols even when sealed.

Keywords: COVID-19; N95 masks; SARS-CoV-2; aerosols; droplets; face masks.


Figures

FIG 1
FIG 1
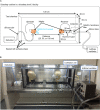
Simulation system for airborne transmission of virus droplets/aerosols. Schematic image (A) and a photograph (B) of the system. A test chamber for airborne transmission experiments was constructed in a BSL3 facility, and two mannequin heads were placed facing each other. One mannequin head was connected to a customized compressor nebulizer and exhaled a mist of virus suspension through its mouth to mimic a viral spreader. The other mannequin head was connected to an artificial ventilator through a virus particle collection unit. Tidal breathing, conducted by the artificial ventilator, was set to a lung ventilation rate representative of a steady state in adults (i.e., 0.5 liter of tidal volume, a respiratory rate of 18 breaths/min, and a 50% gas exchange rate). Face masks were attached to the mannequin heads according to each manufacturer’s instructions.
FIG 2
FIG 2
Mask protective efficiency against SARS-CoV-2 droplets/aerosols. The nebulizer was charged with virus suspension (5 × 105 PFU [A to E], 1 × 108 PFU [F and G], 1 × 105 PFU [H], and 1 × 104 PFU [I]) to generate droplets/aerosols and exhaled continuously to simulate a mild cough at a flow speed of 2 m/s for 20 min. Face masks were attached to the mannequin heads, and the viral loads and infective virus that passed through the masks were measured by use of a plaque assay and quantitative real-time reverse transcription PCR (qRT-PCR), respectively. The N95 masks were evaluated using the following two conditions: the mask fit naturally along the contours of the mannequin’s head, or the edges of the N95 masks were sealed with adhesive tape. The blue bars and dots and the y axis on the left show virus titers. The brown bars and dots and the y axis on the right show the copy numbers of viral RNA. The numbers below the bars show the percentages relative to the leftmost control bar values. Triangles in panel I indicate that the value was below the detection limit. Data are presented as means ± standard deviations (SD). ND, none detected; w/o, without. The experiments were repeated three times (n = 3). * and † indicate significant differences from values for the control group (the leftmost column) (P < 0.05).
FIG 2
FIG 2
Mask protective efficiency against SARS-CoV-2 droplets/aerosols. The nebulizer was charged with virus suspension (5 × 105 PFU [A to E], 1 × 108 PFU [F and G], 1 × 105 PFU [H], and 1 × 104 PFU [I]) to generate droplets/aerosols and exhaled continuously to simulate a mild cough at a flow speed of 2 m/s for 20 min. Face masks were attached to the mannequin heads, and the viral loads and infective virus that passed through the masks were measured by use of a plaque assay and quantitative real-time reverse transcription PCR (qRT-PCR), respectively. The N95 masks were evaluated using the following two conditions: the mask fit naturally along the contours of the mannequin’s head, or the edges of the N95 masks were sealed with adhesive tape. The blue bars and dots and the y axis on the left show virus titers. The brown bars and dots and the y axis on the right show the copy numbers of viral RNA. The numbers below the bars show the percentages relative to the leftmost control bar values. Triangles in panel I indicate that the value was below the detection limit. Data are presented as means ± standard deviations (SD). ND, none detected; w/o, without. The experiments were repeated three times (n = 3). * and † indicate significant differences from values for the control group (the leftmost column) (P < 0.05).

Comment in

  • Besser geschützt mit FFP2-Masken.
    Schumacher B. Schumacher B. MMW Fortschr Med. 2021 Feb;163(2):10. doi: 10.1007/s15006-021-9573-8. MMW Fortschr Med. 2021. PMID: 33527263 Free PMC article. German. No abstract available.

References

    1. Liu Y, Ning Z, Chen Y, Guo M, Liu Y, Gali NK, Sun L, Duan Y, Cai J, Westerdahl D, Liu X, Xu K, Ho K-F, Kan H, Fu Q, Lan K. 2020. Aerodynamic analysis of SARS-CoV-2 in two Wuhan hospitals. Nature 582:557–560. doi:10.1038/s41586-020-2271-3. - DOI - PubMed
    1. Nishimura H, Sakata S and Kaga A. 2013. A new methodology for studying dynamics of aerosol particles in sneeze and cough using a digital high-vision, high-speed video system and vector analyses. PLoS One 8:e80244. doi:10.1371/journal.pone.0080244. - DOI - PMC - PubMed
    1. Berg EB, Picard RJ. 2009. In vitro delivery of budesonide from 30 jet nebulizer/compressor combinations using infant and child breathing patterns. Respir Care 54:1671–1678. - PubMed
    1. Zou L, Ruan F, Huang M, Liang L, Huang H, Hong Z, Yu J, Kang M, Song Y, Xia J, Guo Q, Song T, He J, Yen H-L, Peiris M, Wu J. 2020. SARS-CoV-2 viral load in upper respiratory specimens of infected patients. N Engl J Med 382:1177–1179. doi:10.1056/NEJMc2001737. - DOI - PMC - PubMed
    1. Kormuth KA, Lin K, Prussin AJ, Vejerano EP, Tiwari AJ, Cox SS, Myerburg MM, Lakdawala SS, Marr LC. 2018. Influenza virus infectivity is retained in aerosols and droplets independent of relative humidity. J Infect Dis 218:739–747. doi:10.1093/infdis/jiy221. - DOI - PMC - PubMed

Publication types

LinkOut - more resources