. 2020 Nov 3;117(44):27608-27619.
doi: 10.1073/pnas.1920015117. Epub 2020 Oct 21.

Synthetic gene-regulatory networks in the opportunistic human pathogen Streptococcus pneumoniae

Affiliations

Synthetic gene-regulatory networks in the opportunistic human pathogen Streptococcus pneumoniae

Robin A Sorg et al. Proc Natl Acad Sci U S A. .

Abstract

Streptococcus pneumoniae can cause disease in various human tissues and organs, including the ear, the brain, the blood, and the lung, and thus in highly diverse and dynamic environments. It is challenging to study how pneumococci control virulence factor expression, because cues of natural environments and the presence of an immune system are difficult to simulate in vitro. Here, we apply synthetic biology methods to reverse-engineer gene expression control in S. pneumoniae A selection platform is described that allows for straightforward identification of transcriptional regulatory elements out of combinatorial libraries. We present TetR- and LacI-regulated promoters that show expression ranges of four orders of magnitude. Based on these promoters, regulatory networks of higher complexity are assembled, such as logic AND gates and IMPLY gates. We demonstrate single-copy genome-integrated toggle switches that give rise to bimodal population distributions. The tools described here can be used to mimic complex expression patterns, such as the ones found for pneumococcal virulence factors. Indeed, we were able to rewire gene expression of the capsule operon, the main pneumococcal virulence factor, to be externally inducible (YES gate) or to act as an IMPLY gate (only expressed in absence of inducer). Importantly, we demonstrate that these synthetic gene-regulatory networks are functional in an influenza A virus superinfection murine model of pneumonia, paving the way for in vivo investigations of the importance of gene expression control on the pathogenicity of S. pneumoniae.

Keywords: Pneumococcus; counterselection; superinfection; synthetic biology; toggle switch.


Conflict of interest statement

The authors declare no competing interest.

Figures

Fig. 1.
Fig. 1.
Selection marker characterization. (A) Schematic representation of five selectable and one counterselectable marker, including a description of their enzymatic activities, integrated into the S. pneumoniae D39V genome at the amiF (CEP) locus under the control of the Zn2+-inducible promoter PZ1; CHL, chloramphenicol; ERY, erythromycin; KAN, kanamycin; PCPA, para-chlorophenylalanine; TET, tetracycline; TMP, trimethoprim. (B) Determination of the maximum concentration allowing for outgrowth (starting from OD595 0.002, reaching OD595 0.2 or higher, within 10 h for antibiotics, and within 5 h for PCPA) of strains harboring selection and counterselection marker constructs, in dependency of Zn2+ induction; cultures were tested in duplicate with concentration series that doubled the applied dosage in each consecutive step (one order of magnitude was split into three steps of similar size: 1, 2, 5, and 10); in the case of PCPA, the upper limit of 2 mg⋅mL−1 was the highest concentration tested because of solubility limitations. Average values of two biological replicates are shown. (C and D) Plate reader assay sets in duplicate measuring cell density (OD595) of S. pneumoniae D-PEP7PZ1 (see scheme; gfp, green fluorescent protein; luc, luciferase) growing at different induction levels of PZ1, in the presence of 0.1 µg⋅mL−1 ERY (C), or in the presence of 2 mg⋅mL−1 PCPA (D). Every experiment was performed at least three times, and representative data are shown.
Fig. 2.
Fig. 2.
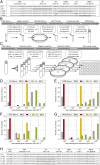
Construction and selection of promoter libraries. (A) Sequence of the strong constitutive promoter P2 and of four corresponding promoter libraries harboring randomized sections; DIST, distal region; UP, UP element; −35, −35 hexamer; CORE, core region; −10, −10 hexamer; PROX, proximal region; transcription start sites are shown in bold, restriction sites are shown in dark gray, randomized sequences are underlined; n = A/C/G/T, M = A/C, R = A/G, W = A/T. (B) Workflow of the promoter library construction, starting from oligonucleotide libraries via pPEP7 plasmid libraries to S. pneumoniae D39V libraries; CSP, competence-stimulating peptide. (C) Workflow of selection assays of D39V libraries and the identification of the promoter strengths of individual strains; (–), negative selection; (+), positive selection; (−/+), sequential selection; C, control; ERY, erythromycin, high, 5 µg⋅mL−1; low, 0.05 µg⋅mL−1; PCPA, para-chlorophenylalanine, 2 mg⋅mL−1; SPT, spectinomycin, 100 µg⋅mL−1. (DG) Gene expression strength (luminescence from luciferase expression) of P2 promoter variants from 24 randomly selected colonies per selection condition of the UP library (D), the CORE library (E), the TATA library (F), and the PROX library (G); ×102 etc., normalized luminescence between 1.0 × 10² and 9.9 × 10² RLU⋅OD−1 (relative luminescence units per optical density at 595 nm) (Methods). (H) Sequence and expression strength of four promoters of the UP library (in comparison to P2), derived from negative selection (P-B2), sequential selection (P-C7), and positive selection (P-E9 and P-F6); transcription start sites are shown in bold, restriction sites are shown in dark gray, and sequence deviations are underlined.
Fig. 3.
Fig. 3.
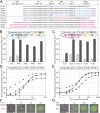
ATc- and IPTG-inducible promoters. (A) Sequence of TetR-repressed PT promoters and LacI-repressed PL promoters, based on the constitutive promoter P2, with TetR operator sequences in light blue and LacI operator sequences in magenta; transcription start sites are shown in bold, restriction sites are shown in dark gray (not shown for most LacI promoters because of space limitations), and sequence deviations (originating from degenerate oligos or from spontaneous mutations during cloning) are underlined. (B and C) Luminescence from luciferase expression, driven by PT promoters (B) and PL promoters (C), without induction and with maximum induction, integrated at the amiF locus together with the strong constitutive promoter PF6 driving regulator expression; ATc, anhydrotetracycline; IPTG, isopropyl β-d-1-thiogalactopyranoside; error bars, see Methods. (D and E) Induction series of selected PT promoters with ATc (D) and of selected PL promoters with IPTG (E), measured by normalized luminescence; error bars and fit curves, see Methods. (F and G) Overlay of phase contrast and fluorescence microscopy of pneumococcal cells expressing GFP driven by PT5-3 (Ptet) in dependency of ATc induction (F) and driven by PL8-2 (Plac) in dependency of IPTG induction (G). (Scale bar, 2 µm.)
Fig. 4.
Fig. 4.
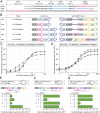
Construction of inverters, amplifiers, and a logic AND gate. (A) Sequence and restriction sites of the TetR+LacI double-repressed promoter Ptela, and Ptet (renamed PT5-3) and Plac (renamed PL8-2) in the context of the double-inducible system PEPdi, with TetR operator sequences in light blue and LacI operator sequences in magenta; transcription start sites are shown in bold, and restriction sites are indicated in dark gray. (B) Schematic representation of gene expression regulation constructs, with the regulators expressed from the prsA locus and the genes of interest expressed from the amiF locus; genR, gentamicin resistance marker; sptR, spectinomycin resistance marker; gray circles indicate transcription terminators. (C and D) Induction series of TetR-regulated promoters with ATc (C) and of LacI-regulated promoters with IPTG (D) of the strains shown in B, measured by luminescence; for Ptela induction series with ATc, 1,000 µM IPTG was added to de-repress LacI; for Ptela induction series with IPTG, 100 ng⋅mL−1 ATc was added to de-repress TetR; error bars and fit curves see Methods. (EG) Boolean logical operators, expressing luciferase in the absence of inducer and during induction with ATc (100 ng⋅mL−1), IPTG (1,000 µM), and ATc + IPTG, from Ptela (E), Plac (F), and Ptet (G).
Fig. 5.
Fig. 5.
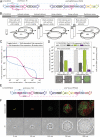
Identification of toggle switches. (A) Schematic representation of strain D-TS-PEP10 containing a transcriptional toggle switch at the prsA locus (TS) and genes of interest at the amiF locus (PEP10); genR, gentamicin resistance marker; sptR, spectinomycin resistance marker; aphA, kanamycin resistance marker; erm, erythromycin resistance marker; gray circles indicate transcription terminators. (B) Workflow of D-TS-PEP10 induction and the subsequent identification of switching events; ABX, antibiotics; ERY, erythromycin, 1 µg⋅mL−1; GEN, gentamicin, 20 µg⋅mL−1; IPTG, 1,000 µM; ATc, 100 ng⋅mL−1; KAN + ERY, kanamycin, 500 µg⋅mL−1, and erythromycin, 1 µg⋅mL−1; KAN, kanamycin, 500 µg⋅mL−1; SPT, spectinomycin, 100 µg⋅mL−1. (C) Overlay of the fit curves corresponding to TetR-dependent Ptet expression (light blue) and LacI-dependent Plac3 expression (magenta) to indicate stable states (circles) and the threshold (circle with asterisk) of the toggle switch. (D) Number of resistant cells that were able to form colonies (CFUs mL−1, colony forming units per 1 mL of cell culture at OD600 0.1) from cultures derived after plating without inducer (average and SEM of experimental duplicates are shown), and flow cytometry analysis of these cultures measuring the fluorescence intensity of 104 cells (gray lines, displaying output levels #0 to #600 of a 10-bit channel, arbitrary units; Methods); underneath, an overlay of phase contrast and fluorescence microscopy of D-TS3-PEP10 cells are shown, with cells originating from induced cultures on the left and cells originating from cultures after plating without inducer shown on the right side of the arrow (scale bar, 2 µm); D-TS3-PEP10, Plac3 (-10 sequence): TATCAT. (E) Schematic representation of strain D-TS3-PEPdiLK, harboring toggle switch 3 (TS3) at the prsA locus and reporter genes at the amiF locus; mK2, mKate2; gray circles indicate transcription terminators. (F) Still images (phase contrast and fluorescence microscopy) of a time-lapse experiment of D-TS3-PEPdiLK cells previously treated with 100 ng⋅mL−1 ATc + 50 µM IPTG growing on a semisolid surface without inducer. (Scale bar, 5 µm.)
Fig. 6.
Fig. 6.
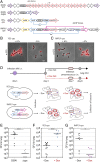
In vivo control of capsule production modulates pneumococcal virulence. (A) Schematic overview of the capsule operon of S. pneumoniae strain D39V, the cps mutant, and the YES-cps and IMPLY-cps strains. The primary promoter is shown in gray upstream of cps2A, and a weaker secondary transcription start site is indicated by an arrow (upstream of cps2F). (B and C) Immunofluorescence of the capsular polysaccharides (CPS) of the YES-cps strain (B) in which the native primary promoter of the operon responsible for capsule production (cps) was replaced by Ptet or the IMPLY-cps strain (C) where cps is driven by Plac, repressed by LacI, itself produced in presence of tetracycline as it is under TetR control. Epifluorescence signal overlaid with phase contrast image indicate the presence of high or low amount of capsule when cps is expressed (B) or repressed (C) upon addition of 100 ng⋅mL anhydrotetracycline (ATc). (Scale bar, 3 µm.) (D) Schematic representation of the murine superinfection model. IAV, influenza A virus; i.n., intranasal infection. Without capsule (red dots), most S. pneumoniae cells will be eliminated by the host immune system, while they can survive and replicate in presence of capsule (thick red layer). Bacteria are collected from the lungs 24 hpi, and viable cells quantified (CFU). (EG) Number of bacteria that were able to form colonies from the lungs of mice fed on control chow and infected with D39V or ∆cps (E), YES-cps (F), or IMPLY-cps (G) or fed on doxycycline-containing chow (Dox) and infected with YES-cps (F), or IMPLY-cps (G). Each dot represents a single mouse. Mann–Whitney test was used for analysis. *P < 0.05; ***P < 0.001.

Similar articles

Cited by

References

    1. Prina E., Ranzani O. T., Torres A., Community-acquired pneumonia. Lancet 386, 1097–1108 (2015). - PMC - PubMed
    1. Walker C. L. F., et al. ., Global burden of childhood pneumonia and diarrhoea. Lancet 381, 1405–1416 (2013). - PMC - PubMed
    1. Kadioglu A., Weiser J. N., Paton J. C., Andrew P. W., The role of Streptococcus pneumoniae virulence factors in host respiratory colonization and disease. Nat. Rev. Microbiol. 6, 288–301 (2008). - PubMed
    1. Weiser J. N., Ferreira D. M., Paton J. C., Streptococcus pneumoniae: Transmission, colonization and invasion. Nat. Rev. Microbiol. 16, 355–367 (2018). - PMC - PubMed
    1. Peterson S., Cline R. T., Tettelin H., Sharov V., Morrison D. A., Gene expression analysis of the Streptococcus pneumoniae competence regulons by use of DNA microarrays. J. Bacteriol. 182, 6192–6202 (2000). - PMC - PubMed

Publication types

MeSH terms

LinkOut - more resources