. 2020 Nov 3;117(44):27319-27328.
doi: 10.1073/pnas.2009201117. Epub 2020 Oct 21.

PLA2G6 guards placental trophoblasts against ferroptotic injury

Affiliations

PLA2G6 guards placental trophoblasts against ferroptotic injury

Ofer Beharier et al. Proc Natl Acad Sci U S A. .

Abstract

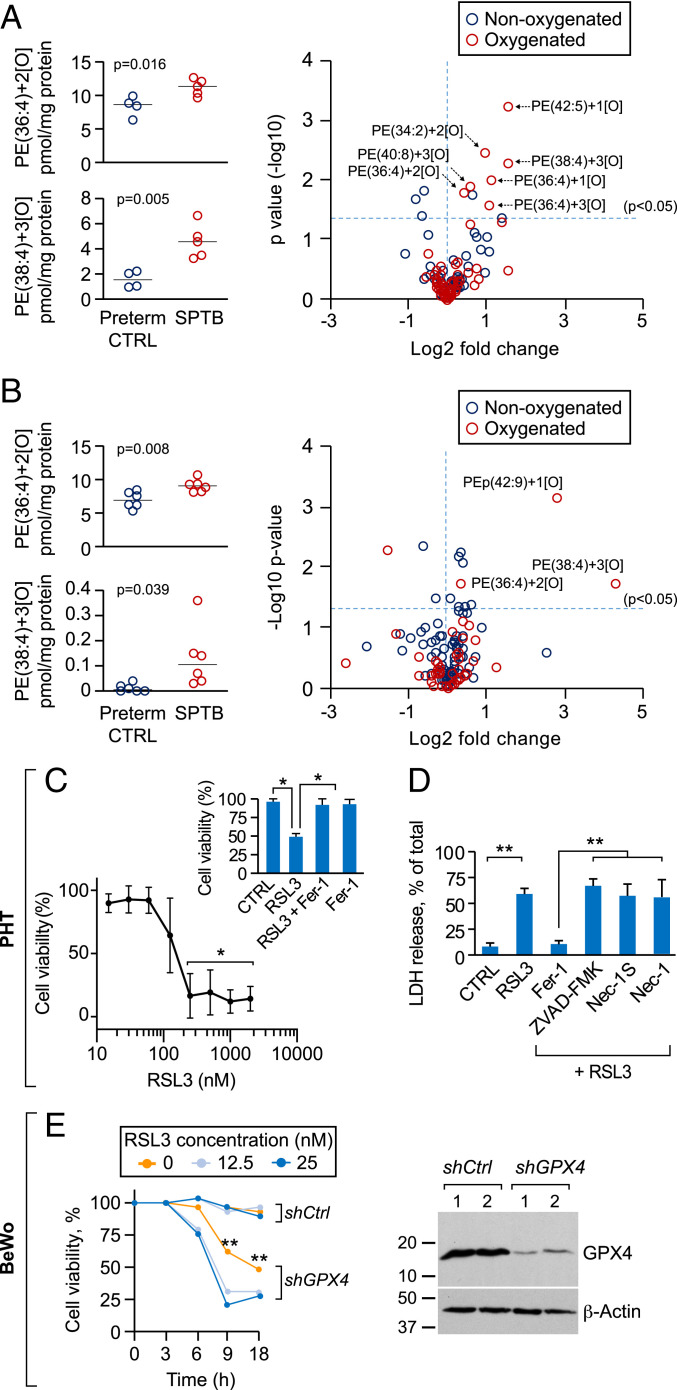
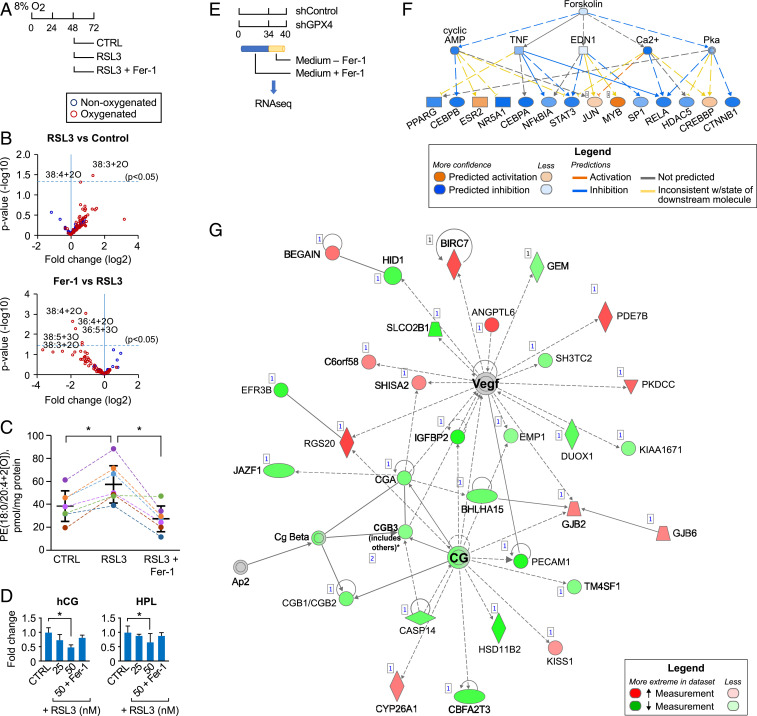
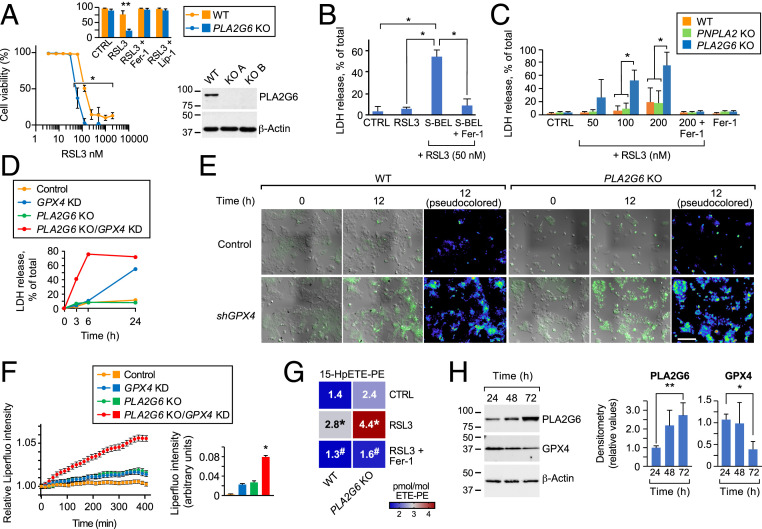
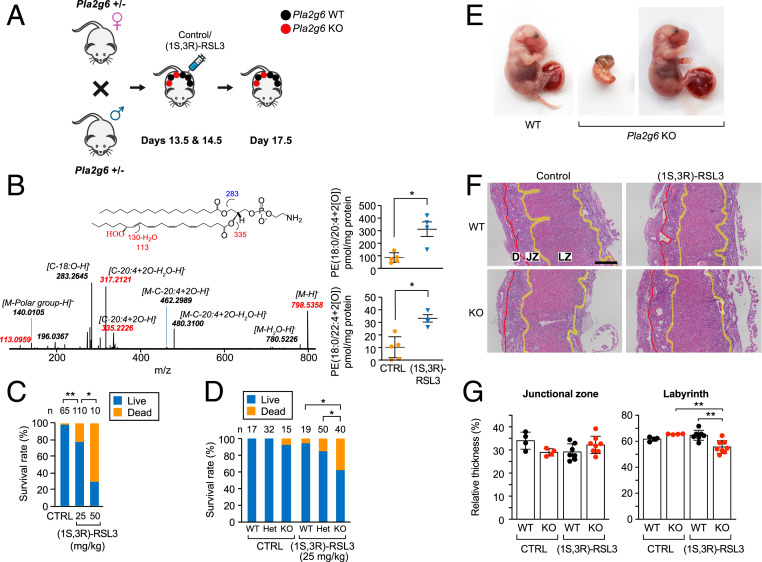
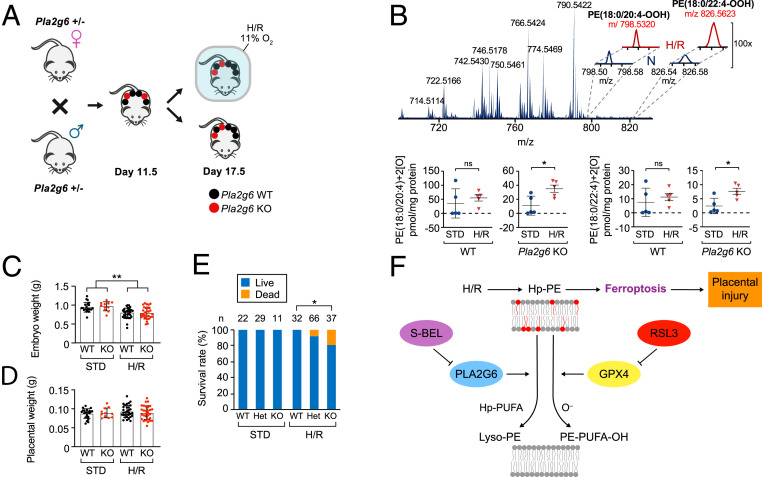
The recently identified ferroptotic cell death is characterized by excessive accumulation of hydroperoxy-arachidonoyl (C20:4)- or adrenoyl (C22:4)- phosphatidylethanolamine (Hp-PE). The selenium-dependent glutathione peroxidase 4 (GPX4) inhibits ferroptosis, converting unstable ferroptotic lipid hydroperoxides to nontoxic lipid alcohols in a tissue-specific manner. While placental oxidative stress and lipotoxicity are hallmarks of placental dysfunction, the possible role of ferroptosis in placental dysfunction is largely unknown. We found that spontaneous preterm birth is associated with ferroptosis and that inhibition of GPX4 causes ferroptotic injury in primary human trophoblasts and during mouse pregnancy. Importantly, we uncovered a role for the phospholipase PLA2G6 (PNPLA9, iPLA2beta), known to metabolize Hp-PE to lyso-PE and oxidized fatty acid, in mitigating ferroptosis induced by GPX4 inhibition in vitro or by hypoxia/reoxygenation injury in vivo. Together, we identified ferroptosis signaling in the human and mouse placenta, established a role for PLA2G6 in attenuating trophoblastic ferroptosis, and provided mechanistic insights into the ill-defined placental lipotoxicity that may inspire PLA2G6-targeted therapeutic strategies.

Keywords: GPX4; PLA2G6; ferroptosis; placenta; trophoblast.


Conflict of interest statement

Competing interest statement: Y.S. is a consultant to Illumina, Inc.

Figures

Fig. 1.
Fig. 1.
Ferroptosis in human placentas from spontaneous preterm birth (SPTB) and in cultured human trophoblasts. (AB) Two independent experiments (A and B) showing the levels of PE-((36:4)+2[O]) (16:0/20:4) and PE-((38:4)+3[O]) (18:0/20:4, Left), and volcano plots (Right) of placental oxygenated phospholipid species (red) vs. nonoxygenated (blue) in SPTB patients, compared to preterm controls (A, n = 9; B, n = 12). P values are shown in the panels, unpaired two-tailed t test. PE levels were determined by LC-MS as detailed in Materials and Methods. At Left each dot represents one placenta. Significant differences in Hp-PE species are depicted in the volcano plots as [–log10 (P value)] vs. [log2 (fold change)] by t test. (C) A concentration-dependent analysis of RSL3-induced cell death in PHT cells, measured by relative LDH release. Cell viability was calculated as 100% minus % released lactate dehydrogenase (LDH) of total cells. (Inset) Death (induced by 200 nM RSL3) was blocked by the ferroptosis inhibitor ferrostatin-1 (Fer-1, 0.5 μM). *P < 0.01 compared to the lowest concentration, LME model with Dunnett’s method for multiple comparisons. (Inset) One-way ANOVA with Dunnett’s method for multiple comparisons. (D) The effect of cell death inhibitors on RSL3-induced ferroptosis in PHT cells. Cells were exposed to RSL3 (200 nM, 24 h) in the absence or presence of ferroptosis inhibitor Fer-1 (0.5 μM), the pan-caspase inhibitor ZVAD-FMK (20 μM), the necroptosis inhibitors necrostatin-1S (Nec-1S, 50 μM), or necrostatin-1 (Nec-1, 50 μM). **P < 0.01, one-way ANOVA with Holm’s method for multiple comparisons. (E) The viability of control BeWo (shCtrl) or GPX4 knockdown BeWo cells (shGPX4), following Fer-1 withdrawal, with or without the addition of low-dose RSL3 (Left). Cell viability was calculated as 100% minus % released LDH of total cells. **P < 0.01, LME model with Holm’s method for multiple comparisons. (Right) A representative immunoblot of silenced GPX4 expression. Data are presented as mean ± SD, n = 4 for different PHT cell batches for C and D and n = 3 for E.
Fig. 2.
Fig. 2.
Sublethal ferroptosis signaling impairs trophoblast function. (A) Scheme of ferroptosis signaling activation, using a low dose of RSL3 (50 nM) in PHT cells. (B) Volcano plots showing RSL3-induced changes in the levels of oxygenated (red) or nonoxygenated (blue) phospholipids in PHT cells, determined by LC-MS as detailed in Materials and Methods. The expression of Hp-PE species is shown as significance [–log10 (P value)] vs. [log2 (fold change)] by t test, in the absence (Top) or presence (Bottom) of ferrostatin-1 (Fer-1, 0.5 μM). n = 6 to 8 experiments. (C) The levels of PE-(C18:0/20:4+2[0]) in PHT cells exposed to DMSO, RSL3 (50 nM), or RSL3 + Fer-1 (0.5 μM, n = 7). *P < 0.01, paired one-way ANOVA with Tukey’s method for multiple comparisons. (D) The levels of hCG (Left) and hPL (Right) released from PHT cells 24 h after exposure to DMSO, RSL3 (50 nM), or RSL3 + Fer-1 (0.5 μM, n = 5). *P < 0.01, LME model with Holm’s method for multiple comparisons. (EG) The effect of GPX4 silencing on upstream mechanistic network analysis, performed by IPA, as detailed in Materials and Methods. RNAseq was performed after silencing GPX4 in BeWo cells: E shows the experimental time course; F shows the predicted inhibition of cAMP, calcium, protein kinase A, and forskolin; and G depicts the cellular network most affected by sublethal ferroptosis activation and showing inhibition of key hormones and other markers of trophoblast differentiation and function. In F and G, the data were obtained from two independent experiments.
Fig. 3.
Fig. 3.
Inhibition of PLA2G6 sensitizes trophoblasts to PE peroxidation and ferroptosis. (A) RSL3-induced concentration-dependent cell death of PLA2G6WT and PLA2G6KO BeWo cells. Cell viability was calculated as 100% minus % released LDH of total cells. Inset, death (induced by 100 nM RSL3) was blocked by the ferroptosis inhibitors ferrostatin-1 and liprostatin-1 (Fer-1 and Lip-1, 0.5 μM, respectively). *P < 0.05, LME model with Holm’s method for multiple comparisons. Inset, LME model with Holm’s method for multiple comparisons; **P < 0.01. Western blot represents KO efficiency of PLA2G6. (B) The effect of the PLA2G6 inhibitor, (S)-BEL, on RSL3-induced ferroptosis (24 h) and inhibited by Fer-1, as control. *P < 0.05, LME model with Dunnett’s method for multiple comparisons. (C) The effect of increased concentration of RSL3 on ferroptosis in BeWo cells, sensitized by KO of the two PNPLA lipases, PLA2G6 (PNPLA9) or PNPLA2. Fer-1 (0.5 µM) inhibition was used as control. *P < 0.05, two-way ANOVA with interaction, with Holm’s method for multiple comparisons. (D) Cell death induced after Fer-1 withdrawal from BeWo cells with either GPX4KD, PLA2G6KO, both PLA2G6KO/GPX4KD, or control. (E) Live cell fluorescence imaging of lipid hydroperoxides in the BeWo lines depicted in the figure, following withdrawal of Fer-1 (time 0 and 12 h). (F, Left) Fluorescence time course (relative to baseline) after Fer-1 withdrawal from BeWo cells with either GPX4KD, PLA2G6KO, both PLA2G6KO/GPX4KD, or control. (F, Right) Quantitative analysis of Liperfluo fluorescence intensity in E, at 12 h of experiment. *P < 0.05, one-way ANOVA with Tukey’s method for multiple comparisons. Data are from a minimum of 10 stage positions. (G) LC-MS-based heat maps showing changes in 15-HpETE-PE in RSL3 (50 nM, 24 h)-exposed BeWo WT or PLA2G6KO cells in the absence or presence of Fer-1. LC-MS data are normalized to parent species ETE-PE. Data represent pmol/mol 15-HpETE-PE (mean ± SD, n = 3). *P < 0.001 vs. control #P < 0.002 vs. RSL3 exposed cells, two-way ANOVA with Sidak’s method for multiple comparisons. (H, Left) Representative western blot of GPX4, PLA2G6, and β-actin expression in PHT cells over time in culture. (H, Right) Densitometry analysis of GPX4 and PLA2G6 expression over time in culture. n = 4, *P < 0.05, **P < 0.001, comparing each measurement at 48 h or 72 h against 24 h. LME model with Dunnett’s method for multiple comparisons.
Fig. 4.
Fig. 4.
Pla2g6 deficiency triggers ferroptosis during murine pregnancy. (A) Schematic of the breeding strategy, embryo/placenta genotypes, and the timing of i.p. injection of vehicle or (1S, 3R)-RSL3. (B) Accumulation of ferroptotic Hp-PE species in the WT placentas, harvested at E17.5, following i.p. injection of vehicle control or 25 mg/kg of (1S, 3R)-RSL3 at E13.5 and E14.5. Control, n = 5; (1S, 3R)-RSL3, n = 4. The data are quantified next to the LC-MS result. *P < 0.05, unpaired two-tailed t test. (C) Fetal survival (all genotypes), assessed at E17.5 after injection of vehicle (1S, 3R)-RSL3, as shown in A. The number of embryos in each group is indicated above each bar. *P < 0.05, **P < 0.01, Fisher’s exact test with Holm’s method for multiple comparisons. (D) Fetal survival at E17.5 after injection of vehicle or (1S, 3R)-RSL3 (25 mg/kg) at E13.5 and E14.5, analyzed by embryo PLA2G6 genotype. The number of embryos in each group is indicated above each bar. *P < 0.05, Fisher’s exact test with Holm’s method for multiple comparisons. (E) Photos of representative placenta and embryo from E17.5 of Pla2g6WT and Pla2g6KO injected with (1S, 3R)-RSL3 (25 mg/kg) as shown in A. Surviving embryos (Right) did not exhibit overt malformations. (F) Representative low magnification images of H&E-stained placentas (sagittal section), showing the labyrinth zone (LZ), junctional zone (JZ), and decidua (D). (Scale bar, 500 μm.) (G) Quantification of the placental layers in F, expressed as width compared to the total placental thickness (WT, n = 4 and 7 placentas from 2 and 3 litters, for vehicle and (1S, 3R)-RSL3, respectively; KO, n = 4 and 8 placentas from 2 and 5 litters, for vehicle and (1S, 3R)-RSL3, respectively). **P < 0.01, two-way ANOVA with interaction, with Holm’s method for multiple comparisons.
Fig. 5.
Fig. 5.
Pla2g6 expression attenuates placental ferroptosis induced by hypoxia/reoxygenation (H/R). (A) Schematic of the breeding strategy, embryo/placenta genotypes, and timing of H/R. (B) Accumulation of ferroptotic Hp-PE species in the placenta in response to H/R vs. standard (STD) conditions for Pla2g6WT (n = 4 placentas from three litters for STD and H/R) and Pla2gKO (n = 4 placentas from three litters for STD and H/R). The data are quantified below the LC-MS result. *P < 0.05, ns, not significant, unpaired two-tailed t test. (C) Embryo weights collected at E17.5 from Pla2gKO (n = 11 or 37 embryos for standard conditions (STD) or H/R, respectively) and from Pla2g6WT (n = 22 and 32 embryos for STD and H/R, respectively). **P < 0.01, two-way ANOVA, with Holm’s correction for multiple comparisons. (D) Placental weights from the same embryos and conditions as in C. (E) Fetal survival (%) at E17.5 of Pla2g6KO vs. Pla2g6WT embryo, exposed to H/R or STD conditions. The number of embryos in each group is indicated above each bar. *P < 0.05, Fisher’s exact test with Holm’s method for multiple comparisons. The data are mean ± SD. (F) Schematic model, summarizing the role of PLA2G6 in attenuating ferroptosis signaling and placental injury.

References

    1. Ung L.et al., Oxidative stress and reactive oxygen species: A review of their role in ocular disease. Clin. Sci. (Lond.) 131, 2865–2883 (2017). - PubMed
    1. Catalá A., Díaz M., Editorial: Impact of lipid peroxidation on the physiology and pathophysiology of cell membranes. Front. Physiol. 7, 423 (2016). - PMC - PubMed
    1. Ren X.et al., Redox signaling mediated by thioredoxin and glutathione systems in the central nervous system. Antioxid. Redox Signal. 27, 989–1010 (2017). - PMC - PubMed
    1. Kagan V. E.et al., Oxidized arachidonic and adrenic PEs navigate cells to ferroptosis. Nat. Chem. Biol. 13, 81–90 (2017). - PMC - PubMed
    1. Dixon S. J.et al., Ferroptosis: An iron-dependent form of nonapoptotic cell death. Cell 149, 1060–1072 (2012). - PMC - PubMed

Publication types

MeSH terms