. 2020 Oct 21;11(1):5321.
doi: 10.1038/s41467-020-19173-2.

5-FU promotes stemness of colorectal cancer via p53-mediated WNT/β-catenin pathway activation

Affiliations

5-FU promotes stemness of colorectal cancer via p53-mediated WNT/β-catenin pathway activation

Yong-Hee Cho et al. Nat Commun. .

Abstract

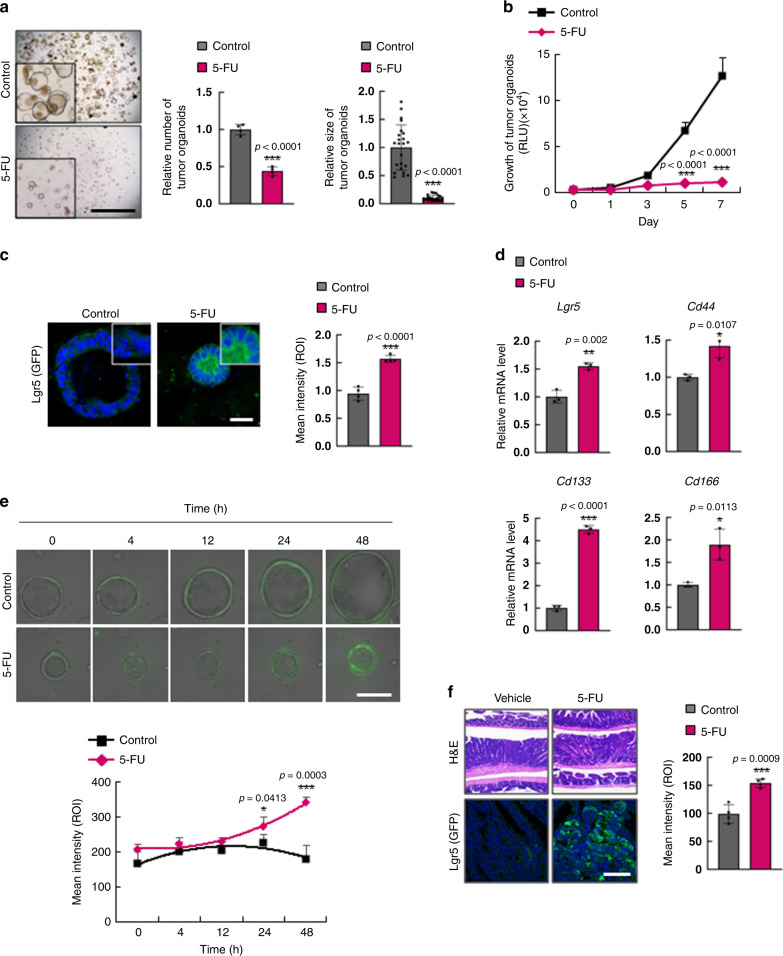
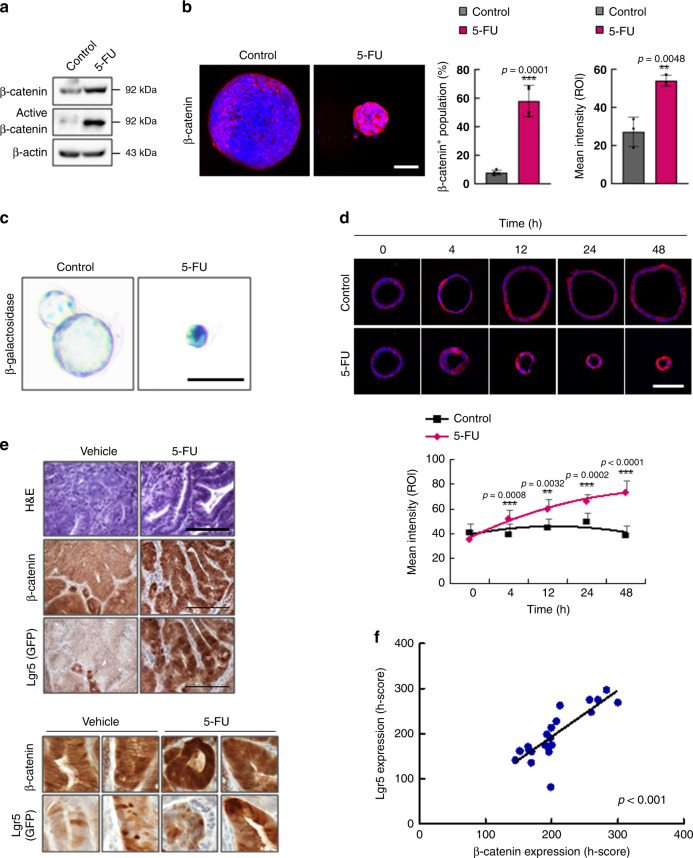
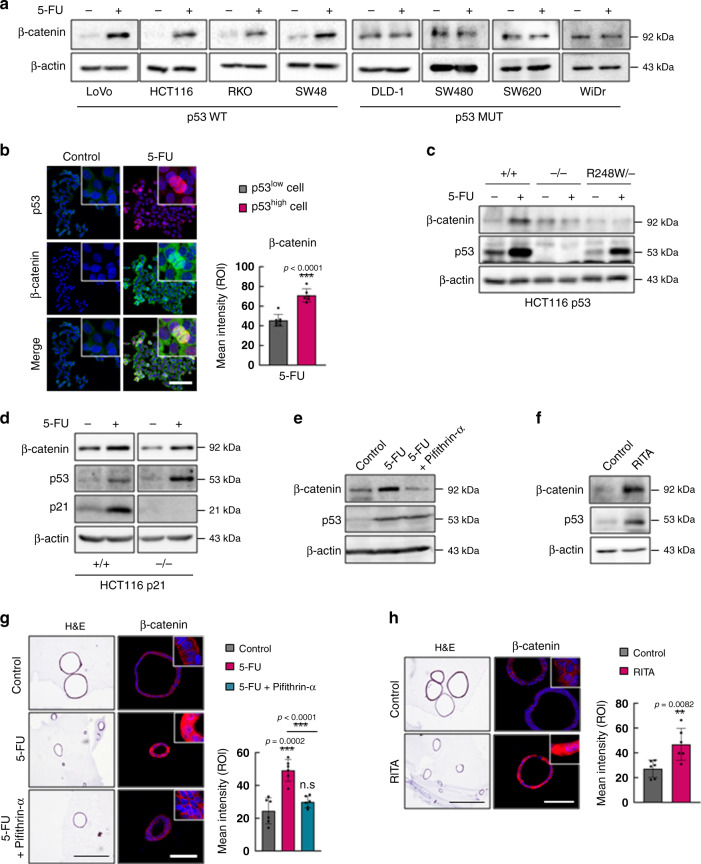
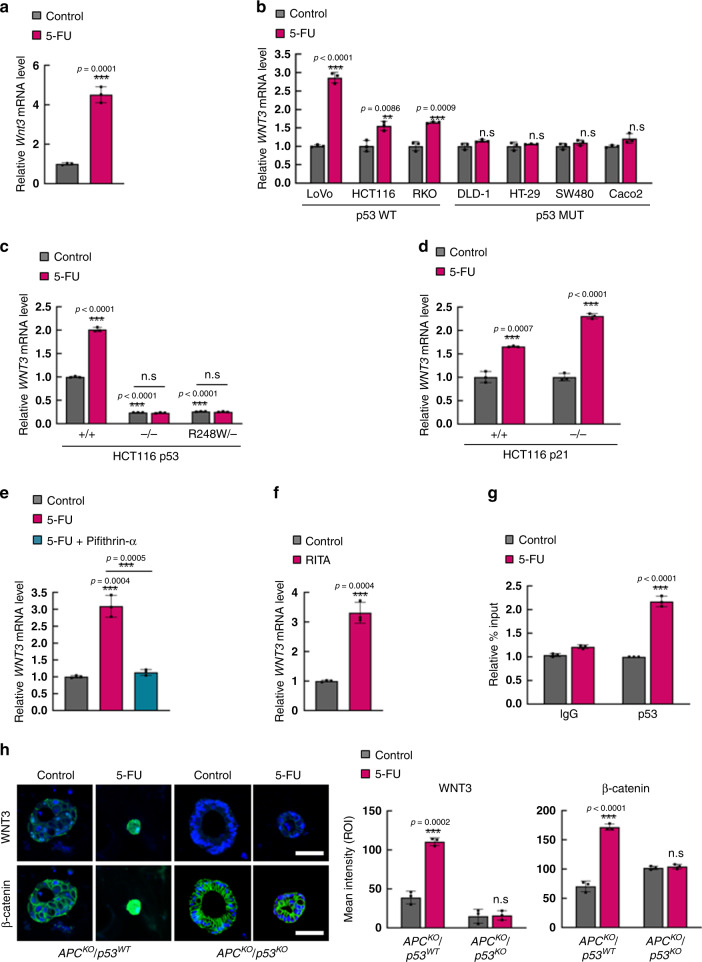
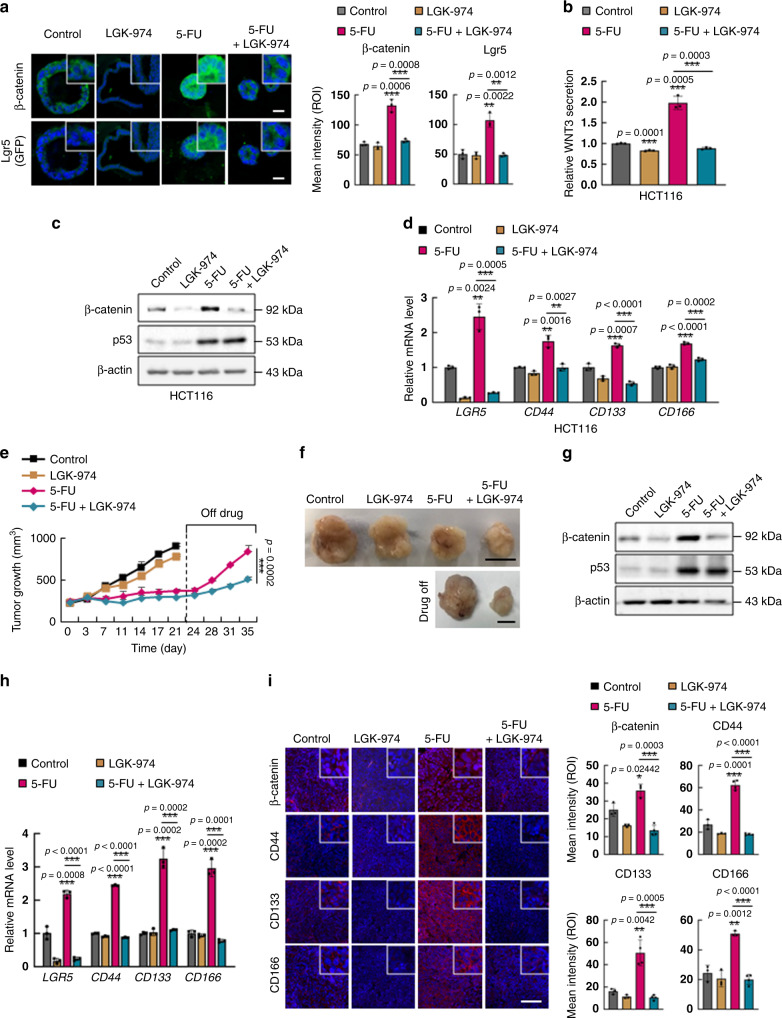
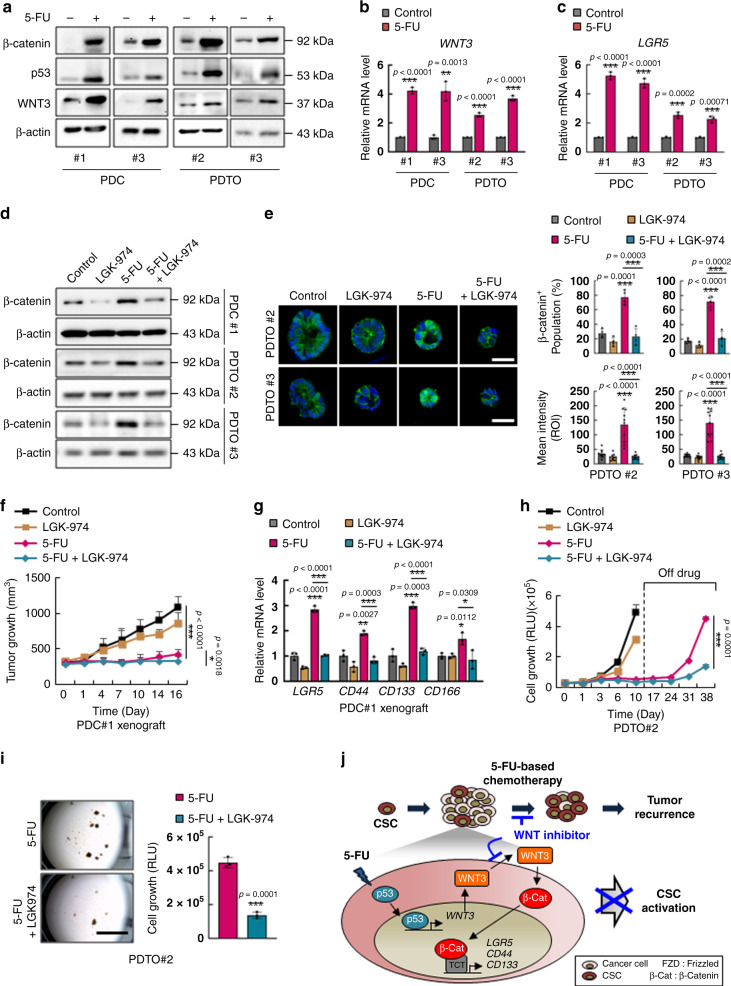
5-Fluorouracil (5-FU) remains the first-line treatment for colorectal cancer (CRC). Although 5-FU initially de-bulks the tumor mass, recurrence after chemotherapy is the barrier to effective clinical outcomes for CRC patients. Here, we demonstrate that p53 promotes WNT3 transcription, leading to activation of the WNT/β-catenin pathway in ApcMin/+/Lgr5EGFP mice, CRC patient-derived tumor organoids (PDTOs) and patient-derived tumor cells (PDCs). Through this regulation, 5-FU induces activation and enrichment of cancer stem cells (CSCs) in the residual tumors, contributing to recurrence after treatment. Combinatorial treatment of a WNT inhibitor and 5-FU effectively suppresses the CSCs and reduces tumor regrowth after discontinuation of treatment. These findings indicate p53 as a critical mediator of 5-FU-induced CSC activation via the WNT/β-catenin signaling pathway and highlight the significance of combinatorial treatment of WNT inhibitor and 5-FU as a compelling therapeutic strategy to improve the poor outcomes of current 5-FU-based therapies for CRC patients.


Conflict of interest statement

The authors declare no competing interests.

Figures

Fig. 1
Fig. 1. 5-FU treatment induces CSC enrichment in murine CRC.
af Analyses of tumor organoids derived from intestinal tumors of ApcMin/+/Lgr5EGFP mice after treatment with 5-FU (1.5 μg/ml, 48 h). a Bright-field images of tumor organoids treated with 5-FU. Relative numbers (n = 4 biologically independent samples per group) and sizes (n = 23 biologically independent organoids per group) of tumor organoids were quantified as fold-change compared to control. Scale bar = 5 mm. b Growth of tumor organoids after treatment with 5-FU for indicated days. (n = 5 biologically independent samples per group) c Confocal images of Lgr5 (GFP) and the mean intensity of GFP after treatment with 5-FU. Scale bar = 50 μm. (n = 5 biologically independent samples per group.) d Relative mRNA levels of Lgr5, Cd44, Cd133, and Cd166 after 5-FU treatment. Data shown as fold-change compared to control. (n = 3 biologically independent samples per group.) e Time-course analyses of Lgr5 (GFP) expression after 5-FU treatment. Scale bar = 100 μm. (n = 4 biologically independent samples per group.) f Hematoxylin and eosin and immunofluorescence staining of mouse intestinal sections after treatment with vehicle or 5-FU (25 kg/ml, 3 weeks) using antibodies for the indicated proteins. The mean intensities were measured by Zen software 3.1. Scale bar = 50 μm. (n = 4 biologically independent samples per group) Data are mean ± s.d., two-sided Student’s t-test, *p < 0.05, **p < 0.01, ***p < 0.001. Source data are provided as a Source data file.
Fig. 2
Fig. 2. 5-FU activates the WNT/β-catenin pathway in murine CRC.
a Immunoblots of indicated proteins in ApcMin/+/Lgr5EGFP tumor organoids with or without 5-FU treatment (1.5 μg/ml, 48 h). b Confocal images of β-catenin (red) in ApcMin/+/Lgr5EGFP tumor organoids with or without 5-FU treatment. The percentage of β-catenin/+ cells (n = 4 biologically independent samples per group) and the mean intensities (n = 3 biologically independent samples per group) were quantified. Scale bar = 50 μm. c β-galactosidase staining of the tumor organoids derived from ApcMin/+/Axin2LACZ mice with or without 5-FU treatment. Scale bar = 100 μm. d Time-course analysis of β-catenin expression in ApcMin/+/Lgr5EGFP tumor organoids with or without 5-FU treatment and quantification of mean intensities. Scale bar = 100 μm. e, f ApcMin/+/Lgr5EGFP mice were treated with vehicle or 5-FU (25 mg/kg, 3 weeks). e Hematoxylin and eosin staining and DAB staining of β-catenin and Lgr5 (GFP) in sections of intestinal tumors of ApcMin/+/Lgr5EGFP mice treated with vehicle or 5-FU. Scale bar = 100 μm. f Linear regression curve showing Lgr5 and β-catenin expression in tumors of ApcMin/+/Lgr5EGFP mice treated with 5-FU. The mean intensities were measured by Zen software 3.1. (n = 21 fields examined over four biologically independent animals per group) Data are mean ± s.d., two-sided Student’s t-test, **p < 0.01, ***p < 0.001. Source data are provided as a Source data file.
Fig. 3
Fig. 3. p53 mediates 5-FU-induced activation of the WNT/β-catenin signaling pathway.
a Immunoblots of indicated proteins in various CRC cell lines treated with or without 5-FU (1.5 μg/ml, 48 h). b Confocal images of immunofluorescence staining of HCT116 cells treated with or without 5-FU and the mean intensity of β-catenin in p53low and p53high cells. Scale bar = 20 μm. (p53low n = 7, p53high n = 6 biologically independent samples). c Immunoblots of indicated proteins in p53+/+, p53−/−, and p53R248W/− isogenic HCT116 cell lines treated with or without 5-FU. d Immunoblots of indicated proteins in p21+/+ and p21−/− isogenic HCT116 cell lines treated with or without 5-FU. e Immunoblots of indicated proteins in HCT116 cells treated with or without treatment of 5-FU and pifithrin-α (10 μM, 48 h). f Immunoblots of indicated proteins in HCT116 cells treated with or without RITA (5 μM, 48 h). g, h Hematoxylin and eosin staining and immunofluorescence staining of β-catenin in ApcMin/+/Lgr5EGFP intestinal tumor organoids treated with or without 5-FU and pifithrin-α (g) and with or without RITA (h). Scale bar = 50 μm. The mean intensities were measured by Zen software 3.1. (n = 6 biologically independent samples per group) Data are mean ± s.d., two-sided Student’s t-test, n.s. not significant, *p < 0.05, **p < 0.01, ***p < 0.001. Source data are provided as a Source data file.
Fig. 4
Fig. 4. 5-FU activates WNT/β-catenin signaling via p53-dependent WNT3 transcrpition.
a Relative mRNA levels of Wnt3 in ApcMin/+/Lgr5EGFP mouse tumor organoids after treatment with 5-FU (1.5 μg/ml, 48 h). (n = 3 biologically independent samples per group). b Relative mRNA levels of WNT3 in various CRC cell lines after 5-FU treatment. (n = 3 biologically independent samples per group). c Relative mRNA levels of WNT3 in p53+/+, p53−/−, and p53R248W/− isogenic HCT116 cell lines after 5-FU treatment. (n = 3 biologically independent samples per group). d Relative mRNA levels of WNT3 in p21+/+ and p21−/− isogenic HCT116 cell lines after 5-FU treatment. (n = 3 biologically independent samples per group). e Relative mRNA levels of WNT3 in HCT116 cells treated with or without 5-FU and pifithrin-α (10 μM, 48 h). (n = 3 biologically independent samples per group). f Relative mRNA level of WNT3 in HCT116 cells treated with our with RITA (5 μM, 48 h). (n = 3 biologically independent samples per group). g Relative percentage input of ChIP-qPCR analysis of WNT3 promoter using indicated antibodies in HCT116 cells after treatment with 5-FU. (n = 3 biologically independent samples per group) h Confocal images of WNT3 (green) and β-catenin (green) with DAPI in APCKO/p53WT and APCKO/p53KO human colon organoids treated with or without 5-FU. Scale bar = 50 μm. Quantification of mean intensities of WNT3 and β-catenin in Fig. 4h. The mean intensities were measured by Zen software 3.1. (n = 3 biologically independent samples per group) Data are mean ± s.d., two-sided Student’s t-test, n.s. not significant, *p < 0.05, **p < 0.01, ***p < 0.001. Source data are provided as a Source data file.
Fig. 5
Fig. 5. WNT inhibition suppresses 5-FU-induced enrichment of CSCs and tumor regrowth.
a Confocal images of β-catenin (green) and Lgr5 (GFP) (green) in ApcMin/+/Lgr5EGFP intestinal tumor organoids co-treated with 5-FU (1.5 μg/ml, 48 h) and LGK-974 (5 μM, 48 h) (left panel) and quantification of the mean intensities (right panel). Scale bar = 50 μm. (n = 3 biologically independent samples per group). b Measurement of WNT3 secretion by ELISA analyses using 12 h cultured medium of HCT116 cells after co-treatment with 5-FU and LGK-974. (n = 3 biologically independent samples per group). c Immunoblots of indicated proteins in HCT116 cells co-treated with 5-FU and LGK-974. d Relative mRNA levels of CSC markers LGR5, CD44, CD133, and CD166 in HCT116 cells co-treated with 5-FU and LGK-974. (n = 3 biologically independent samples per group). ei HCT116 cells were xenografted in mice and tumors were extracted and analyzed after co-treatment with 5-FU (25 mg/kg) and LGK-974 (5 mg/kg) daily for 21 days followed by discontinuation of treatment for 14 days. e Growth of tumors were measured at the indicated days after treatments. (n = 5 in D0, D3, D7, D11, D14, D17, and D21 biologically independent animals per group and n = 4 in D24, D28, D31 biologically independent animals per group). f Gross images of tumors. Scale bar = 10 mm. g Immunoblots of indicated proteins in isolated tumors after indicated treatment for 21 days. h Relative mRNA levels of LGR5, CD44, CD133, and CD166 in isolated tumors after indicated treatment for 21 days. (n = 3 biologically independent samples per group). i Immunohistochemistry analysis of indicated proteins in sections of isolated tumors after treatment for 21 days and quantification of mean intensities. Scale bar = 100 μm. The mean intensities were measured by Zen software 3.1. (β-catenin n = 3 in Control, LGK-974 and 5-FU, and n = 4 in 5-FU+LGK-974 group, CD44 n = 3 in Control, LGK-974, and n = 4 in 5-FU and 5-FU+LGK-974 group, CD133 n = 3 in Control, LGK-974, and n = 4 in 5-FU and 5-FU+LGK-974 group, CD166 n = 3 in Control, LGK-974 and 5-FU, and n = 4 in 5-FU + LGK-974 group). Data are mean ± s.d., two-sided Student’s t-test, **p < 0.01, ***p < 0.001. Source data are provided as a Source data file.
Fig. 6
Fig. 6. WNT inhibitor effectively suppresses 5-FU-induced enrichment of CSCs and tumor regrowth in CRC patients.
a Immunoblots of indicated proteins in PDCs and PDTOs with or without 5-FU treatment (1.5 μg/ml, 48 h). b, c Relative mRNA levels of WNT3 (b) and LGR5 (c) in PDCs and PDTOs with or without 5-FU treatment. (n = 3 biologically independent samples per group). d Immunoblots of indicated proteins in PDCs and PDTOs co-treated with 5-FU and LGK-974 (5 μM, 48 h). e Confocal images of β-catenin (green) in PDTOs co-treated with 5-FU and LGK-974 (left panel) and quantification of the percentage of β-catenin+ population among the cells in each tumor organoid (upper right panel) (n = 4 biologically independent samples per group) and the mean intensities (lower right panel). (n = 10 biologically independent samples per group) Scale bars = 50 μm. f, g PDC#1 xenograft mice were treated with 5-FU (25 mg/kg) alone or co-treated with 5-FU (25 mg/kg) and LGK-974 (5 mg/kg) for 16 days and tumors were extracted and analyzed. f Tumor growth in mice during the treatments is shown. (Control n = 8, LGK-974 n = 6, 5-FU n = 8, 5-FU+LGK-974 n = 8 biologically independent animals) g Relative mRNA levels of LGR5, CD44, CD133, and CD166 in isolated tumors after treatment. (n = 3 biologically independent samples per group) h, i Tumor organoids derived from patient#2 were treated with 5-FU (1.5 μg/ml) alone or co-treated with 5-FU and LGK-974 daily for 10 days followed by discontinuation of treatment for 28 days. h Growth of PDTO#2 at indicated days. (n = 10 in D0, n = 3 in D1, n = 7 in D3, D6, D10, n = 4 in D17, n = 3 in D24, D31 and D38 biologically independent samples per group). i Bright field image of PDTO#2 at 28 days after discontinuation of treatment of 5-FU alone or co-treatment of 5-FU and LGK-974 (left panel) and measurement of cell growth in PDTO#2 by cell titer assay (right panel) (n = 3 biologically independent samples per group). Scale bars = 4 mm. j Schema depicting the mechanism by which 5-FU induces activation and enrichment of CSCs via p53. The mean intensities were measured by Zen software 3.1. Data are mean ± s.d., two-sided Student’s t-test, *p < 0.05, **p < 0.01, ***p < 0.001. Source data are provided as a Source data file.

References

    1. Siegel RL, Miller KD, Jemal A. Cancer statistics, 2019. CA Cancer J. Clin. 2019;69:7–34. doi: 10.3322/caac.21551. - DOI - PubMed
    1. Carethers JM. Systemic treatment of advanced colorectal cancer: tailoring therapy to the tumor. Ther. Adv. Gastroenterol. 2008;1:33–42. doi: 10.1177/1756283X08093607. - DOI - PMC - PubMed
    1. Graham JS, Cassidy J. Adjuvant therapy in colon cancer. Expert Rev. Anticancer Ther. 2012;12:99–109. doi: 10.1586/era.11.189. - DOI - PubMed
    1. Del Rio M, et al. Gene expression signature in advanced colorectal cancer patients select drugs and response for the use of leucovorin, fluorouracil, and irinotecan. J. Clin. Oncol. 2007;25:773–780. doi: 10.1200/JCO.2006.07.4187. - DOI - PMC - PubMed
    1. Sinicrope FA, et al. DNA mismatch repair status and colon cancer recurrence and survival in clinical trials of 5-fluorouracil-based adjuvant therapy. J. Natl Cancer Inst. 2011;103:863–875. doi: 10.1093/jnci/djr153. - DOI - PMC - PubMed

Publication types

MeSH terms