. 2020 Oct 21;11(1):5292.
doi: 10.1038/s41467-020-19041-z.

Direct reprogramming of human umbilical vein- and peripheral blood-derived endothelial cells into hepatic progenitor cells

Affiliations

Direct reprogramming of human umbilical vein- and peripheral blood-derived endothelial cells into hepatic progenitor cells

Hiroki Inada et al. Nat Commun. .

Abstract

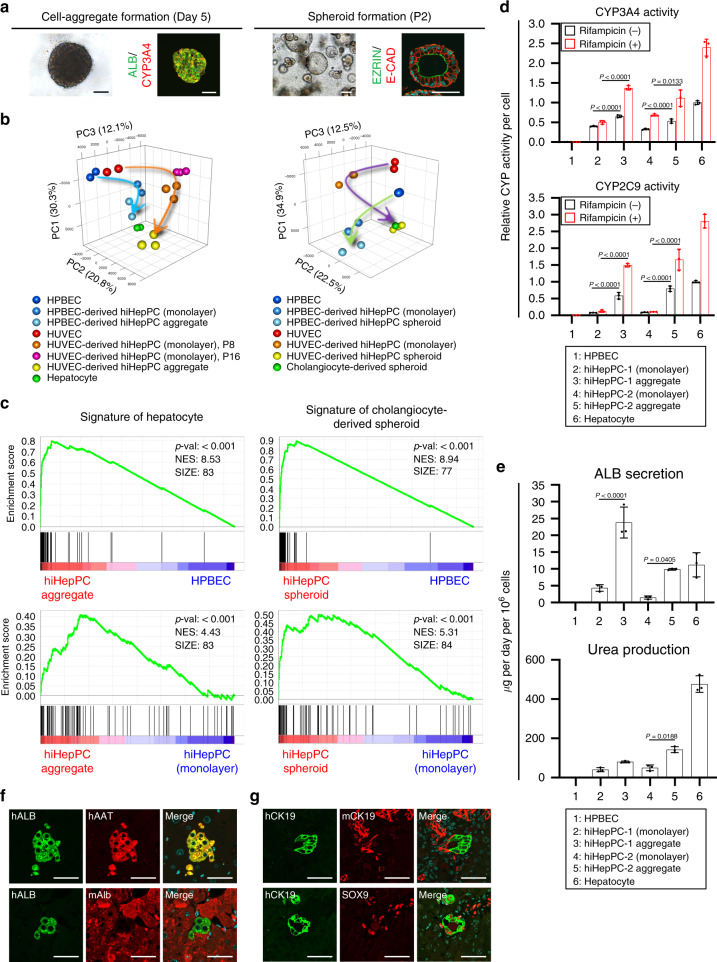
Recent advances have enabled the direct induction of human tissue-specific stem and progenitor cells from differentiated somatic cells. However, it is not known whether human hepatic progenitor cells (hHepPCs) can be generated from other cell types by direct lineage reprogramming with defined transcription factors. Here, we show that a set of three transcription factors, FOXA3, HNF1A, and HNF6, can induce human umbilical vein endothelial cells to directly acquire the properties of hHepPCs. These induced hHepPCs (hiHepPCs) propagate in long-term monolayer culture and differentiate into functional hepatocytes and cholangiocytes by forming cell aggregates and cystic epithelial spheroids, respectively, under three-dimensional culture conditions. After transplantation, hiHepPC-derived hepatocytes and cholangiocytes reconstitute damaged liver tissues and support hepatic function. The defined transcription factors also induce hiHepPCs from endothelial cells circulating in adult human peripheral blood. These expandable and bipotential hiHepPCs may be useful in the study and treatment of human liver diseases.


Conflict of interest statement

The authors declare no competing interests.

Figures

Fig. 1
Fig. 1. Generation of expandable hiHepPCs from HUVECs.
a Schematic diagram of the experimental procedure. b Immunofluorescence staining of ALB or E-CAD was conducted for mock-infected HUVECs and HUVECs transduced with the indicated factors at the indicated passage numbers (P). HNF4A, FOXA3, HNF1A, and HNF6 are abbreviated as H4A, F3, H1A, and H6, respectively. Representative fluorescence images and morphologies of mock-infected and transduced HUVECs are shown. DNA was stained with DAPI. Scale bars, 50 µm. The graphs show the percentages of ALB+ cells observed in individual cultures during passaging. The data obtained from two independent experiments are indicated by red and blue lines in the graphs, respectively. PH parental HUVEC. c The percentages of cells immunoreactive for ALB or E-CAD among mock-infected HUVECs and HUVECs transduced with the indicated factors at passage (P) 6. Data represent the mean ± SD (n = 3 independent experiments). d Growth curves of mock-infected HUVECs and three different hiHepPCs generated by transducing HUVECs with FOXA3, HNF1A, and HNF6 in three independent experiments. Cells (1 × 105) were passaged every 7 days in wells of 6-well plates. e A representative image of a karyotype of a hiHepPC at passage 12. Note that the numbers of chromosomes in all 20 hiHepPCs analyzed in this study were normal. Source data are provided as a Source Data file.
Fig. 2
Fig. 2. hiHepPCs are directly induced from HUVECs and differentiate into hepatocytes.
a GSEA of CEL-seq2 data for hiHepPC monolayer cultures at passage 8 and HUVECs was performed using the set of top 100 genes specifically upregulated in hHepPCs derived from hESCs or adult human livers. b qPCR analyses of hHepPC marker genes were performed on total RNA obtained from HUVECs, three different hiHepPCs at passage 8 in monolayer culture, and human hepatocytes. All data were normalized with the values for hiHepPC-1 (monolayer), and the fold differences are shown. Data represent the mean ± SD (n = 3 independent assays). c Co-immunofluorescence staining of ALB with AFP was conducted for hiHepPCs induced from HUVECs at the indicated passage numbers (P). P1 and P1’ designate days 4 and 7, respectively, after the initial passage of transduced HUVECs. The upper and lower right graphs show the percentages of AFP+ cells in ALB+ cells and ALB+ cells in AFP+ cells, respectively, which were observed in individual cultures of hiHepPCs during passaging. Data represent the mean ± SD (n = 3 independent experiments). d Co-immunofluorescence staining of ALB with E-CAD, AAT, ASGPR1, or CYP3A4 and of AFP with HNF4A or CYP3A4 and immunofluorescence staining of CD31 were conducted for mock-infected HUVECs at passage (P) 1 and hiHepPC monolayer cultures at P6. Periodic acid–Schiff (PAS) staining and oil red O staining were also conducted for mock-infected HUVECs and hiHepPC monolayer cultures to visualize glycogen stores and lipid synthesis, respectively, in hiHepPC-derived hepatocytes. Additionally, ICG uptake and subsequent release by hiHepPC-derived hepatocytes are shown. DNA was stained with DAPI. Scale bars, 50 µm. Source data are provided as a Source Data file.
Fig. 3
Fig. 3. Promotion of hepatocyte differentiation in hiHepPC aggregates.
a Representative morphologies of hiHepPC aggregates at days 1, 7, 14, 21, and 28 after initiation of 3D culture. b Representative images of hematoxylin and eosin (HE)-stained hiHepPC aggregates at day 7 after initiation of 3D culture. c Co-immunofluorescence staining of ALB with E-CAD and of CYP3A4 with MRP2 were conducted for hiHepPC aggregates at day 7 after initiation of 3D culture. DNA was stained with DAPI. d Representative bright-field and fluorescence images of a living hiHepPC aggregate at day 7 after initiation of 3D culture stained with 5- and 6-carboxy-2′,7′-dichlorofluorescein diacetate (carboxy-DCFDA). Green fluorescence shows functional MRP2 transporter activity in hiHepPC aggregates. e PCA was performed using CEL-seq2 data for HUVECs, hiHepPCs in monolayer and cell aggregation cultures, and human hepatocytes. f GSEA of CEL-seq2 data for hiHepPC aggregates and HUVECs and of those for hiHepPC aggregates and hiHepPC monolayer cultures were performed using the set of top 100 genes specifically upregulated in human hepatocytes. g GOEA was performed for genes with expression levels higher in hiHepPC aggregates than in hiHepPC monolayer cultures (left graph). The liver-enriched genes shown in the left graph were related to hepatic functions associated with xenobiotic metabolism, drug metabolism, and lipid metabolism (right graph). h, i CYP3A4 and CYP2C9 activities (h) and the amounts of ALB and urea in the culture media (i) were measured after culture of HUVECs, two different hiHepPCs, cell aggregates derived from these hiHepPCs, and human hepatocytes. All data shown in h were normalized with the values for hepatocytes in culture without rifampicin, and the fold differences are shown. j The viability of hiHepPCs in monolayer and cell aggregation cultures and primary human hepatocytes was measured after culture of cells with the indicated hepatotoxins. Statistical difference was determined by one-way analysis of variance followed by Tukey–Kramer test. Data represent the mean ± SD (n = 3 (h, i) or n = 4 (j) independent assays). Scale bars, 50 µm. Source data are provided as a Source Data file.
Fig. 4
Fig. 4. Cystic spheroid formation from hiHepPC-derived cholangiocytes.
a Representative images of 3D cultures of HUVECs and hiHepPCs at day 7 and passage (P) 5 and those of adult human liver-derived cholangiocytes at P3 after initiation of 3D culture with Matrigel. Scale bars, 100 µm. b Co-immunofluorescence staining of E-CAD with EZRIN or CFTR, of CK19 with SOX9 or HNF1B, and of EpCAM with α-TUBULIN and immunofluorescence staining of ZO-1 with phalloidin staining of F-actin were conducted for hiHepPC spheroids. DNA was stained with DAPI. Scale bars, 50 µm. c Representative ultrastructural images of hiHepPC spheroids (n = 10 spheroids). Black arrowheads indicate intracellular tight junctional complexes. Scale bars, 10 µm (left panel) and 500 nm (right panel). d PCA was performed using CEL-seq2 data for HUVECs, hiHepPC monolayer cultures, hiHepPC spheroids, and human fetal cholangiocyte-derived spheroids. e GSEA of CEL-seq2 data for hiHepPC spheroids and HUVECs and of those for hiHepPC spheroids and hiHepPC monolayer cultures were performed using the set of top 100 genes specifically upregulated in human fetal cholangiocyte-derived spheroids. f Representative bright-field and fluorescence images showing uptake of rhodamine 123 (green) into the luminal space of hiHepPC spheroids and inhibition of rhodamine 123 transport after treating the spheroids with verapamil before the addition of rhodamine 123. Scale bars, 50 µm.
Fig. 5
Fig. 5. hiHepPC-derived cells functionally reconstitute hepatic tissues in vivo.
a Schematic diagram of the experimental procedure. hiHepPCs were marked by infection with a virus expressing enhanced green fluorescent protein (EGFP) before transplantation. PH partial hepatectomy. b Immunofluorescence staining of the thymidine analog 5-bromo-2’-deoxyuridine (BrdU) was conducted for the livers of control mice (No treat) and retrorsine-treated and untreated mice at day 2 after PH. The graph shows the percentages of BrdU+ cells observed in individual mouse livers. c Kaplan–Meier survival curves of the recipient retrorsine-treated hepatectomized mice after intrasplenic injection of human hepatocytes, cells dissociated from hiHepPC aggregates and hiHepPC monolayer cultures, HUVECs, or only PBS into the liver. Statistical analyses using the log-rank test revealed significant differences between the curves for HUVECs and hiHepPC aggregates or hepatocytes but not between those for hiHepPC aggregates and hepatocytes (P = 0.309). d Immunofluorescence staining of human AAT (hAAT) was conducted for recipient mouse livers 2 months after transplantation. The graph shows the percentages of hAAT+ cells observed in individual mouse livers. e Co-immunofluorescence staining of EGFP with hAAT, CYP3A4, E-CAD, human CK8/18 (hCK8/18), MRP2, or HNF4A and of hAAT with human ALB (hALB) were conducted for recipient mouse livers 2 months after transplantation of cells dissociated from hiHepPC aggregates. f, g The amounts of AST and ALT (f) and those of hALB (g) in the serum of recipient mice were measured 2 days and 2 months after transplantation, respectively. The sera of control mice (No treat) were measured as negative controls. h Schematic diagram of the experimental procedure. i Co-immunofluorescence staining of human CK19 (hCK19) with mouse CK19 (mCK19) or SOX9 was conducted for DDC-treated mouse livers 4 weeks after the last injection of cells dissociated from hiHepPC spheroids or human fetal cholangiocyte-derived spheroids. j Co-immunofluorescence staining of hALB with mouse Alb (mAlb) was conducted for retrorsine-treated hepatectomized mouse livers 2 months after transplantation of cells dissociated from hiHepPC aggregates or human hepatocytes. Statistical difference was determined by one-way analysis of variance followed by Tukey–Kramer test (b) or Dunnett’s test (d, f, g). Data represent the mean ± SD (n = 3 (b, d) or 4 (f, g) independent experiments). DNA was stained with DAPI. Scale bars, 50 µm. Source data are provided as a Source Data file.
Fig. 6
Fig. 6. Direct conversion of HPBECs to hiHepPCs.
a Schematic diagram of the experimental procedure. b Immunofluorescence staining of ALB was conducted for mock-infected HPBECs at day 45 and HPBEC-derived hiHepPCs at day 45 and passage (P) 10 after retrovirus infection. Representative morphologies and fluorescence images of these two types of cells are shown. White broken lines surround hiHepPC colonies. Scale bars, 100 µm. The graph shows the percentages of ALB+ cells observed in individual cultures of HPBECs at day 45 and hiHepPCs at day 45, P3, and P10 after retrovirus infection. The data obtained from two biologically independent experiments using different blood samples are shown in the graph. Data represent the mean ± SD (n = 3 independent assays). c Co-immunofluorescence staining of ALB with E-CAD, AAT, ASGPR1, or CYP3A4 and of AFP with HNF4A; PAS staining; and oil red O staining were conducted for HPBECs and HPBEC-derived hiHepPCs. Representative morphologies of these two types of cells are also shown. White broken line surrounds a hiHepPC colony. In addition, HPBEC-derived hiHepPCs incorporated and excreted ICG. DNA was stained with DAPI. Scale bars, 50 µm. Source data are provided as a Source Data file.
Fig. 7
Fig. 7. Bi-lineage differentiation potential in HPBEC-derived hiHepPCs.
a HPBEC-derived hiHepPCs formed cell aggregates and cystic spheroids under 3D culture conditions. Co-immunofluorescence staining of ALB with CYP3A4 and of EZRIN with E-CAD were conducted for hiHepPC aggregates and spheroids, respectively. Representative morphologies and fluorescence images of hiHepPC aggregates at day 5 and hiHepPC spheroids at passage (P) 2 after initiation of 3D culture are shown. b, c We obtained CEL-seq2 data from HPBECs, HPBEC-derived hiHepPCs, and cell aggregates and spheroids derived from these hiHepPCs and performed PCA using CEL-seq2 data for the indicated cell types (b) and GSEA using the set of top 100 genes specifically upregulated in human hepatocytes or human fetal cholangiocyte-derived spheroids (c). P passage number of hiHepPCs in monolayer cultures. d, e CYP3A4 and CYP2C9 activities (d) and the amounts of ALB and urea in the culture media (e) were measured after culture of HPBECs, two different hiHepPCs induced from HPBECs, cell aggregates derived from these hiHepPCs, and human hepatocytes. All data shown in d were normalized with the values for hepatocytes in culture without rifampicin, and the fold differences are shown. Statistical difference was determined by one-way analysis of variance followed by Tukey–Kramer test. Data represent the mean ± SD (n = 3 independent assays). f Co-immunofluorescence staining of hALB with hAAT or mAlb was conducted for retrorsine-treated hepatectomized mouse livers 2 months after transplantation of cells dissociated from HPBEC-derived hiHepPC aggregates. g Co-immunofluorescence staining of hCK19 with mCK19 or SOX9 was conducted for DDC-treated mouse livers 4 weeks after the last injection of cells dissociated from HPBEC-derived hiHepPC spheroids. DNA was stained with DAPI. Scale bars, 50 µm. Source data are provided as a Source Data file.

Similar articles

Cited by

References

    1. Szkolnicka D, Hay DC. Concise review: advances in generating hepatocytes from pluripotent stem cells for translational medicine. Stem Cells. 2016;34:1421–1426. doi: 10.1002/stem.2368. - DOI - PMC - PubMed
    1. Palakkan AA, Nanda J, Ross JA. Pluripotent stem cells to hepatocytes, the journey so far. Biomed. Rep. 2017;6:367–373. doi: 10.3892/br.2017.867. - DOI - PMC - PubMed
    1. Huang P, et al. Induction of functional hepatocyte-like cells from mouse fibroblasts by defined factors. Nature. 2011;475:386–389. doi: 10.1038/nature10116. - DOI - PubMed
    1. Sekiya S, Suzuki A. Direct conversion of mouse fibroblasts to hepatocyte-like cells by defined factors. Nature. 2011;475:390–393. doi: 10.1038/nature10263. - DOI - PubMed
    1. Du Y, et al. Human hepatocytes with drug metabolic function induced from fibroblasts by lineage reprogramming. Cell Stem Cell. 2014;14:394–403. doi: 10.1016/j.stem.2014.01.008. - DOI - PubMed

Publication types

MeSH terms

Substances