. 2020 Oct 21;11(1):5327.
doi: 10.1038/s41467-020-19119-8.

Clonal evolution of acute myeloid leukemia revealed by high-throughput single-cell genomics

Affiliations

Clonal evolution of acute myeloid leukemia revealed by high-throughput single-cell genomics

Kiyomi Morita et al. Nat Commun. .

Erratum in

  • Publisher Correction: Clonal evolution of acute myeloid leukemia revealed by high-throughput single-cell genomics.
    Morita K, Wang F, Jahn K, Hu T, Tanaka T, Sasaki Y, Kuipers J, Loghavi S, Wang SA, Yan Y, Furudate K, Matthews J, Little L, Gumbs C, Zhang J, Song X, Thompson E, Patel KP, Bueso-Ramos CE, DiNardo CD, Ravandi F, Jabbour E, Andreeff M, Cortes J, Bhalla K, Garcia-Manero G, Kantarjian H, Konopleva M, Nakada D, Navin N, Beerenwinkel N, Futreal PA, Takahashi K. Morita K, et al. Nat Commun. 2020 Nov 19;11(1):5996. doi: 10.1038/s41467-020-19902-7. Nat Commun. 2020. PMID: 33214561 Free PMC article.
  • Author Correction: Clonal evolution of acute myeloid leukemia revealed by high-throughput single-cell genomics.
    Morita K, Wang F, Jahn K, Hu T, Tanaka T, Sasaki Y, Kuipers J, Loghavi S, Wang SA, Yan Y, Furudate K, Matthews J, Little L, Gumbs C, Zhang J, Song X, Thompson E, Patel KP, Bueso-Ramos CE, DiNardo CD, Ravandi F, Jabbour E, Andreeff M, Cortes J, Bhalla K, Garcia-Manero G, Kantarjian H, Konopleva M, Nakada D, Navin N, Beerenwinkel N, Futreal PA, Takahashi K. Morita K, et al. Nat Commun. 2021 May 10;12(1):2823. doi: 10.1038/s41467-021-23280-z. Nat Commun. 2021. PMID: 33972555 Free PMC article. No abstract available.

Abstract

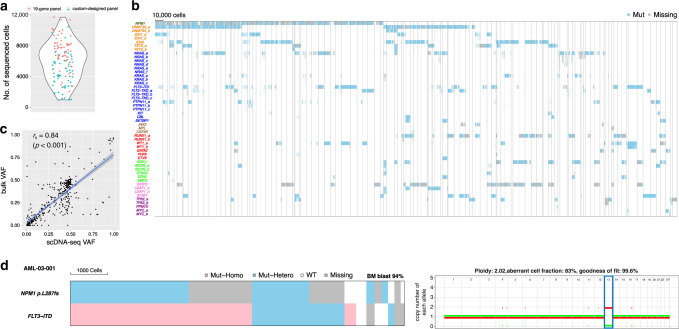
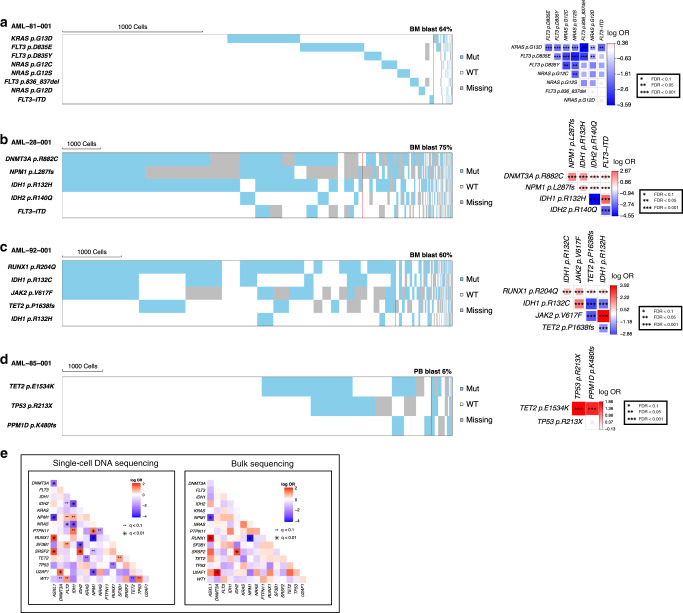
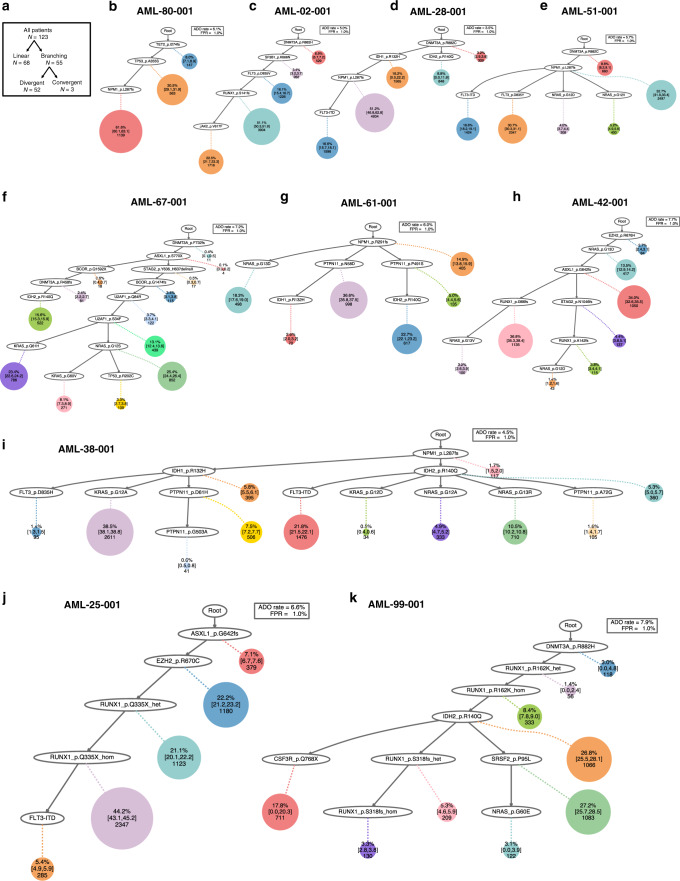
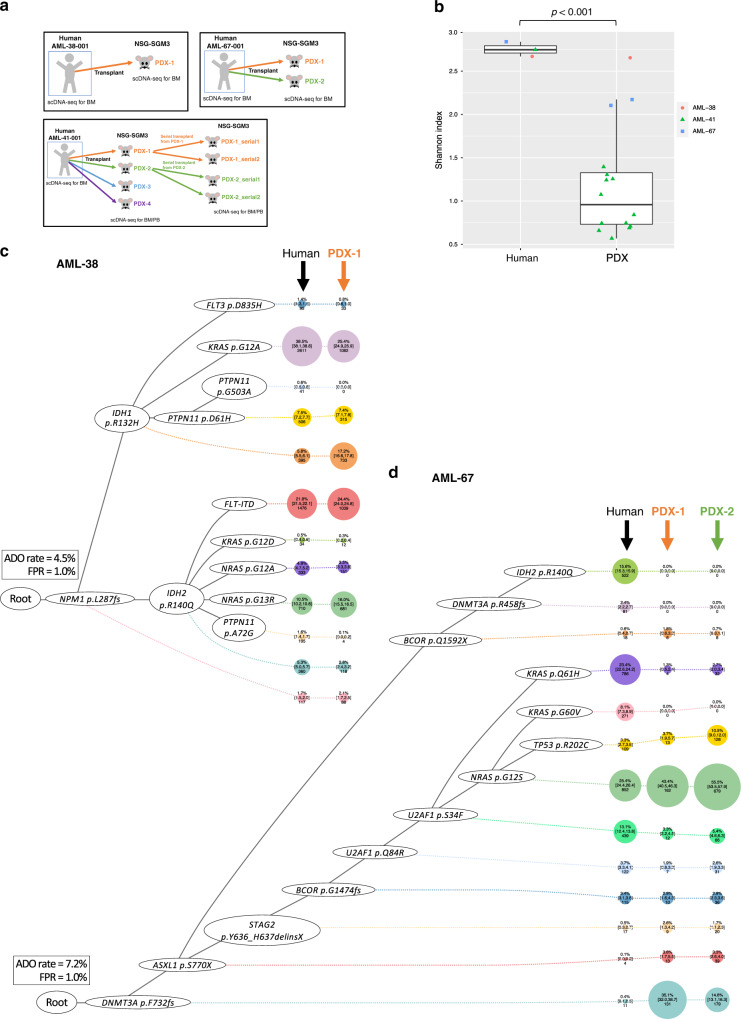
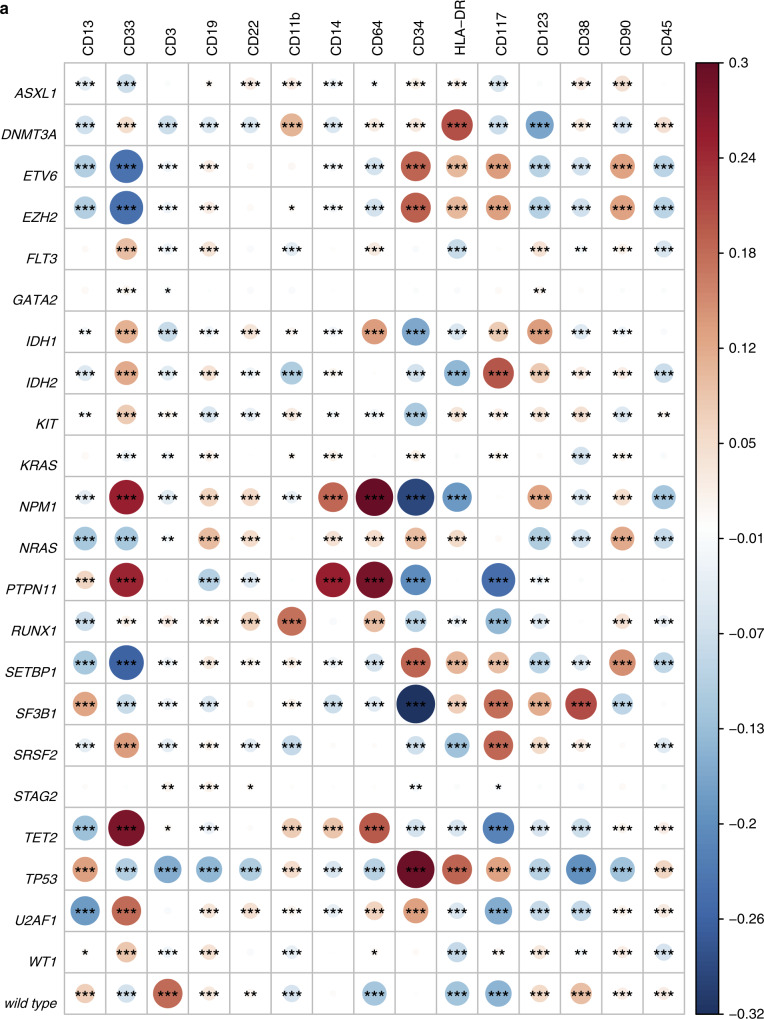
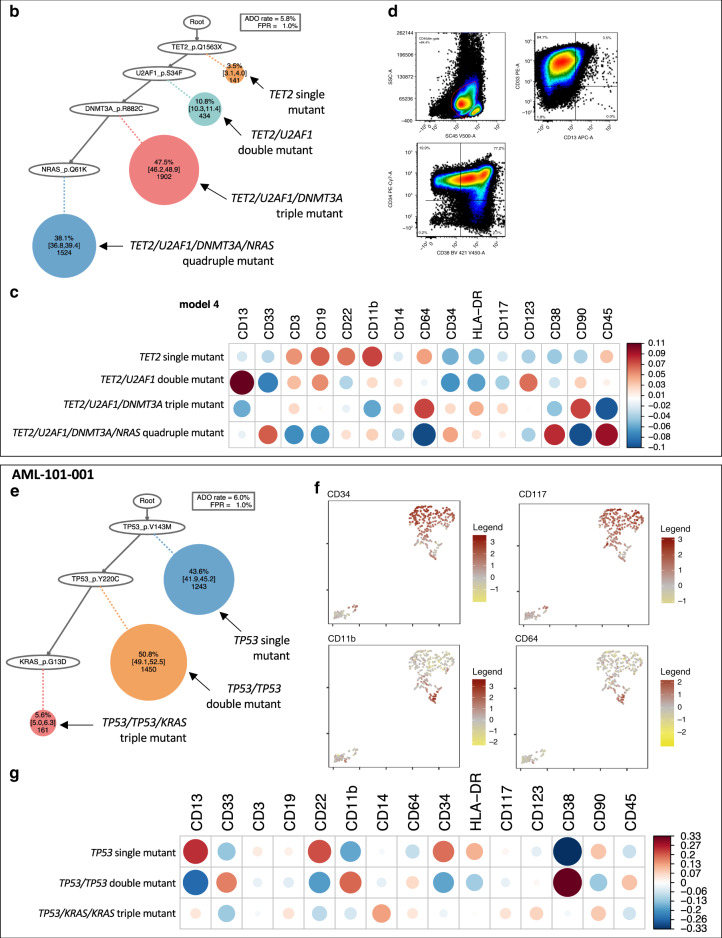
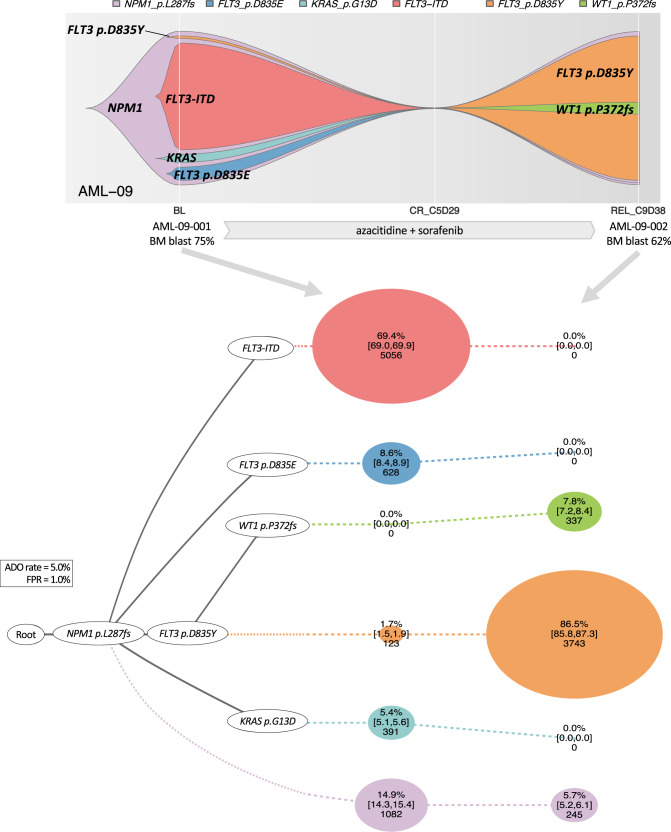
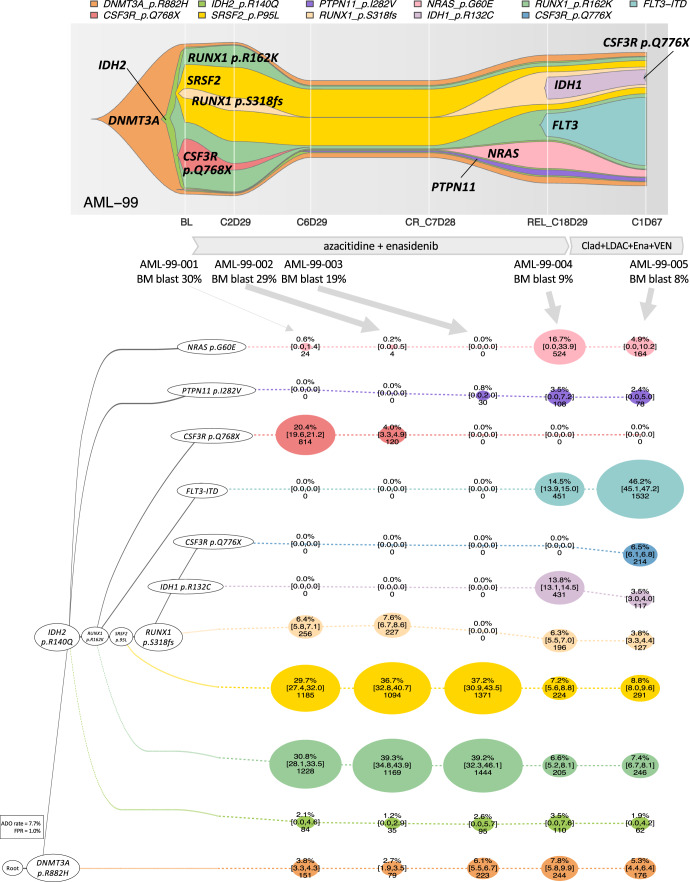
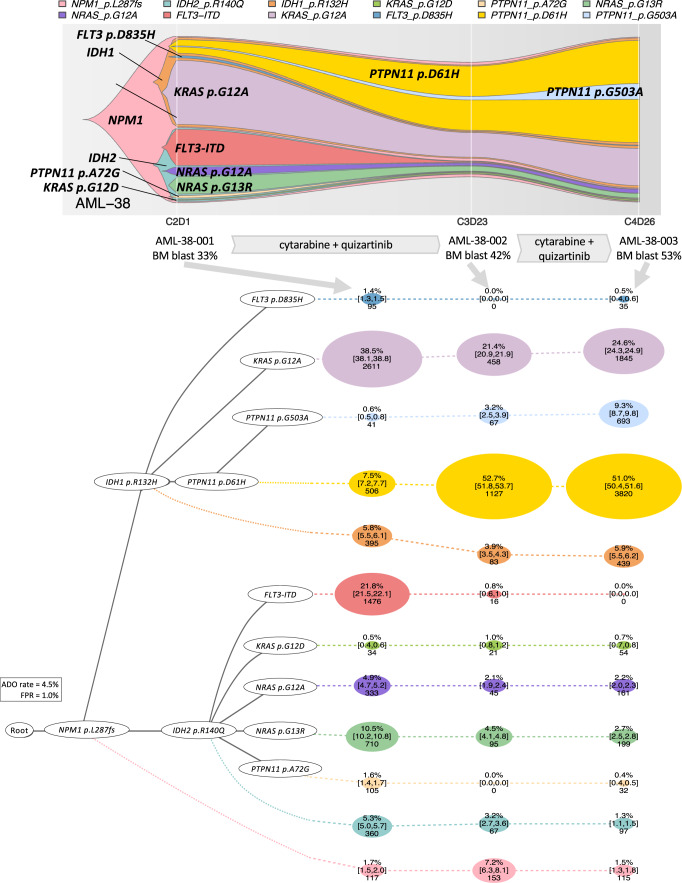
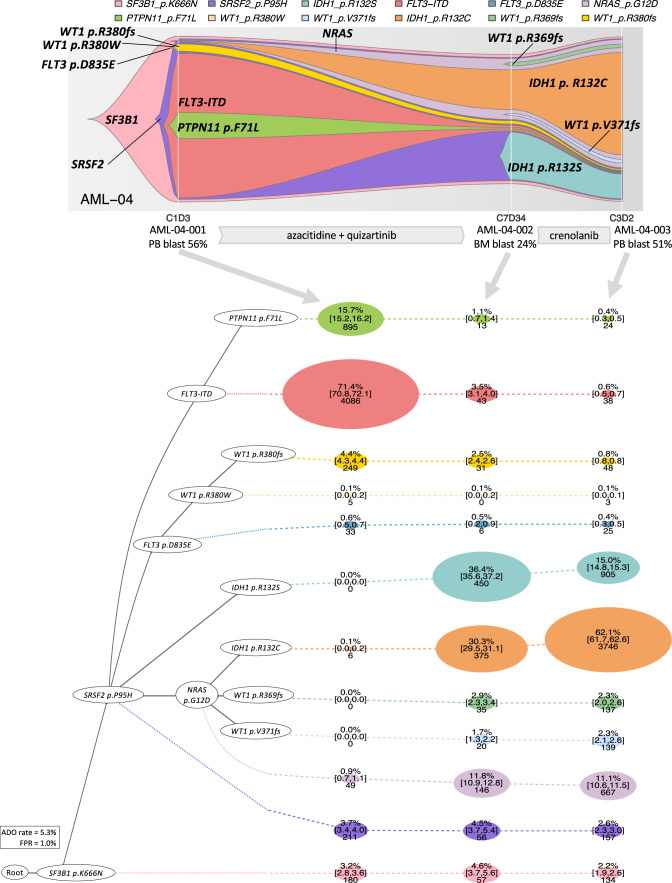
Clonal diversity is a consequence of cancer cell evolution driven by Darwinian selection. Precise characterization of clonal architecture is essential to understand the evolutionary history of tumor development and its association with treatment resistance. Here, using a single-cell DNA sequencing, we report the clonal architecture and mutational histories of 123 acute myeloid leukemia (AML) patients. The single-cell data reveals cell-level mutation co-occurrence and enables reconstruction of mutational histories characterized by linear and branching patterns of clonal evolution, with the latter including convergent evolution. Through xenotransplantion, we show leukemia initiating capabilities of individual subclones evolving in parallel. Also, by simultaneous single-cell DNA and cell surface protein analysis, we illustrate both genetic and phenotypic evolution in AML. Lastly, single-cell analysis of longitudinal samples reveals underlying evolutionary process of therapeutic resistance. Together, these data unravel clonal diversity and evolution patterns of AML, and highlight their clinical relevance in the era of precision medicine.


Conflict of interest statement

The authors declare no competing interests.

Figures

Fig. 1
Fig. 1. The Genetic landscape of AML based on single-cell DNA sequencing.
a Distribution of the number of total sequenced cells. Each point represents a sample from unique patients. b Somatic mutations in 735,483 cells from 123 AML patients detected by single-cell DNA sequencing (scDNA-seq). Each column represents a cell at the indicated scale, and cells from the same case are clustered together within the areas surrounded by the gray lines. Cells that were genotyped as being mutated or wild type for the indicated gene are colored in blue and white, respectively. Cells with missing genotypes are colored in gray. When one sample has multiple different mutations in the same gene, they were annotated differently (e.g., DNMT3A_a and DNMT3A_b). Mutated genes are colored based on the affected molecular pathway (nucleophosmin colored in green, DNA methylation in orange, RTK/RAS/MAP kinase pathway in blue, JAK-STAT pathway in brown, transcription factor in red, chromatin/cohesin in light green, splicing in pink, and apoptosis in purple). A total of 76,549 cells that were genotyped as wild type for all the variants screened are not shown. c Correlation of the variant allele fraction (VAF) from bulk-sequencing and scDNA-seq. The x-axis shows the VAF from scDNA-seq (scDNA-seq VAF). The y-axis shows the VAF from the bulk sequencing (bulk VAF). Each dot represents a detected variant. The line represents a linear regression line. The shaded area represents the 95% confidence intervals. d A representative case with highly homozygous variant involving copy-neutral loss of heterozygosity (CN-LOH). Heat map (left) shows the genotype of each sequenced cell for each variant, with clustering based on the genotypes of driver mutations. Each column represents a cell at the indicated scale. Cells with homozygous mutation, heterozygous mutation, and wild-type cells are indicated in red, blue, and white, respectively. Cells with missing genotypes are indicated in gray. The allele counts distribution is shown to the right. The allele count is shown on the vertical axis, and the chromosomes are shown on the horizontal axis. Chromosome 13 involving highly homozygous FLT3-ITD is highlighted with a blue rectangle. Mut-Homo homozygously mutated, Mut-Hetero heterozygously mutated, WT wild type, Missing missing genotype.
Fig. 2
Fig. 2. The cellular-level mutual exclusivity of AML driver mutations.
ad Cell-level mutual exclusivity patterns of driver mutations in individual samples for four representative cases. a KRAS, NRAS, FLT3-non-ITD, and FLT3-ITD, b IDH1 and IDH2, c IDH1 p.R132C, IDH1 p.R132H, and TET2, d TP53 and PPM1D variants did not co-occur in the same cellular populations. Mut mutated, WT wild type, Missing missing genotype. Heat maps (left) show the genotype of each sequenced cell for each variant, with clustering based on the genotypes of driver mutations. Each column represents a cell at the indicated scale. Cells with mutations and wild-type cells are indicated in blue and white, respectively. Cells with missing genotypes are indicated in gray. The subclones located to the right of the red line comprised <1% of the total sequenced cells, and such small subclones can represent false positive or negative genotypes as a result of allele dropout or multiplets. The figures on the right show the pairwise association of mutations. The color and size of each panel represent the degree of the logarithmic odds ratio (log OR). The bar on the right side is a key indicating the association of the colors with the log OR. Co-occurrence and mutual exclusivity are indicated by red and blue, respectively. The statistical significance of the associations based on the false discovery rate (FDR) is indicated by the asterisks (*FDR < 0.1, **FDR < 0.05, ***FDR < 0.001). e Pairwise association of driver mutations in AML based on single-cell DNA sequencing (left) and bulk sequencing data (right). For each pair of mutations, their dependency was summarized as log OR, with positive values (red) indicating a degree of co-occurrence and negative values (blue) indicating a degree of mutual exclusivity. The statistical significance of the associations based on the q value is indicated by the dots and asterisks (**q < 0.1, *q < 0.01).
Fig. 3
Fig. 3. Inference of mutational history in AML.
a Summary of the clonal evolution patterns. Three of the 55 cases showing branching evolution patterns presented convergent evolution patterns. bi Inference of mutation phylogeny based on the single-cell DNA seqeuncing (scDNA-seq) data using the SCITE algorithm. Representative cases illustrating distinct patterns of clonal evolution are shown. Each node represents a mutational event, and each circle represents a subclone with cumulative mutational events, which can be traced with a dotted line and solid lines towards the root. The size of the circle is proportional to the clonal population, and the numbers within each circle are the number of cells and the percentage of each clone among the total tumor cells. The 95% credible intervals from the posterior sampling are shown to illustrate the uncertainty in the subclone sizes. The wild-type cells which did not carry any driver mutations are not shown. b, c Linear clonal evolution pattern, in which a subset of cells from the founder clone acquired additional mutations in a stepwise manner. The trunk clone exhibits a forked evolution pattern based on the status of additional mutations. di Branching clonal evolution pattern including convergent evolution patterns with molecular alterations in g NPM1-RAS/MAPK-IDH, h chromatin-RUNX1-RAS, and i NPM1-IDH-FLT3/RAS/MAPK pathways. The clonal evolution patterns are characterized by the parallel acquisition of multiple functionally redundant mutations in different cell populations. j, k Inference of the relative timing of loss of heterozygosity (LOH). Zygosity state based on the scDNA-seq data was incorporated into phylogeny reconstruction. Two representative cases with homozygous RUNX1 mutations involving LOH are shown. In both cases, each RUNX1 mutation was initially heterozygous and sequentially developed into homozygous state, without acquiring any additional mutations during LOH events. ADO allele dropout, FPR false-positive rate.
Fig. 4
Fig. 4. Clonal architecture in xenotransplanted models.
NSG-SGM3 mice engrafted with aliquotes of AML-38-001, AML-67-001, and AML-41-001 were analyzed by single-cell DNA sequencing (scDNA-seq). a Schematic figures of xenotransplant assay. PDX patient derived xenograft, BM bone marrow, PB peripheral blood. b Change in clonal diversity between human and xenotransplanted models. The types of samples are shown on the x-axis. The y-axis shows Shannon index. The thick line within each box represents the median, and the top and bottom edges of the box represent the 25th and 75th percentiles, respectively. The upper and lower whiskers represent the 75th percentile plus 1.5 times the interquartile range and the 25th percentile minus 1.5 times the interquartile range, respectively. Two-sided Student’s t test was used without adjustment for multiple comparisons (p = 0.000557). N = 19 samples from 3 cases. All data points are shown colored by the donors. PDX patient derived xenograft. c, d Clonal structure based on scDNA-seq data in human and xenotransplanted samples in c AML-38 and d AML-67. The phylogenetic trees visualize the estimated order of mutation acquisition and the proportion of subclones with a different combination of mutations at each timepoint. The wild-type cells which did not carry any driver mutations are not shown. ADO allele dropout, FPR false-positive rate.
Fig. 5
Fig. 5. The single-cell genotype–phenotype correlation.
a A heat map showing the cellular-level correlation between immunophenotype and genotype based on the entire sequenced cells. Each circle is colored by the r value of coefficient (red if positively correlated and blue if negatively correlated), with the size reflecting the absolute r value (*r < 0.05, **r < 0.01, ***r < 0.001). bd A representative case (AML-103-001) showing a stepwise mutation acquisition along with hematopoietic differentiation. b SCITE-inferred model 2 phylogeny tree showing a linear evolution pattern of driver mutations. c A heat map showing the immunophenotype of each genotype-defined subclone shown in Fig. 5b. d Flow cytometry data from the same patient. A cellular population delineated with a red line indicates CD45-dim cells. The blasts were CD34+CD33+CD13- myeloblasts. A subset of CD34+ blasts showed CD38 expression. Detailed flow cytometry data is available in Supplementary Fig. 13c, d. eg A representative case (AML-101-001) showing two distinct blasts populations determined by the simultaneous single-cell DNA and protein profiling. e SCITE-inferred model 2 phylogeny tree showing a linear evolution pattern. f The single-cell immunophenotyping data for selected cell surface markers. Each dot represents a sequenced cell. Relative expression of each cell surface marker is normalized by the degree of the logarithmic odds ratio (log OR, brown if high expression, yellow if low expression). g A heat map showing the immunophenotype of each genotype-defined subclone determined by the SCITE model from Fig. 5e. ADO allele dropout, FPR false-positive rate.
Fig. 6
Fig. 6. Clonal selection in response to FLT3 inhibitor-containing therapy.
A 74-year-old man with newly diagnosed therapy-related acute myelomonocytic leukemia showing a selection of FLT3 p.D835Y clone during a FLT3 inhibitor-containing therapy. The fish plot shows the inferred clonal evolution pattern based on the single-cell genotype data. The phylogenetic trees visualize the estimated order of mutation acquisition and the proportion of subclones with a different combination of mutations at each timepoint. The wild-type cells which did not carry any driver mutations are not shown. BL baseline, CR complete remission, C cycle, D day, REL relapse, ADO allele dropout, FPR false-positive rate. Full case description is available in Supplementary Methods.
Fig. 7
Fig. 7. Emergence of IDH1/FLT3/NRAS clones during IDH2 inhibitor-containing therapy.
A 76-year old woman with AML showing the parallel evolution of IDH1 p.R132C, FLT3-ITD, NRAS p.G60E, and PTPN11 p.I282V clones during an IDH2 inhibitor-containing therapy. Clad cladribine, LDAC low dose cytarabine, Ena enasidenib, VEN venetoclax, DAC decitabine. The fish plot shows the inferred clonal evolution pattern based on the single-cell genotype data. The phylogenetic trees visualize the estimated order of mutation acquisition and the proportion of subclones with a different combination of mutations at each timepoint. The wild-type cells which did not carry any driver mutations are not shown. BL baseline, CR complete remission, C cycle, D day, REL relapse, ADO allele dropout, FPR false-positive rate. Full case description is available in Supplementary Methods.
Fig. 8
Fig. 8. Parallel evolution of RAS/PTPN11 clones during FLT3 inhibitor-containing therapy.
A 58-year-old-man with refractory AML showing the clearance of FLT3-ITD clone with an expansion of PTPN11/RAS clones during a FLT3 inhibitor-containing therapy. The fish plot shows the inferred clonal evolution pattern based on the single-cell genotype data. The phylogenetic trees visualize the estimated order of mutation acquisition and the proportion of subclones with a different combination of mutations at each timepoint. The wild-type cells which did not carry any driver mutations are not shown. C cycle, D day, ADO allele dropout, FPR false-positive rate. Full case description is available in Supplementary Methods.
Fig. 9
Fig. 9. Selection of IDH1/RAS clones during FLT3 inhibitor-containing therapy.
A 76-year-old man with refractory secondary AML showing the clearance of FLT3-ITD clone with an expansion of IDH/RAS clones during a FLT3 inhibitor-containing therapy. The fish plot shows the inferred clonal evolution pattern based on the single-cell genotype data. The phylogenetic trees visualize the estimated order of mutation acquisition and the proportion of subclones with a different combination of mutations at each timepoint. The wild-type cells which did not carry any driver mutations are not shown. C cycle, D day, ADO allele dropout, FPR false-positive rate. Full case description is available in Supplementary Methods.

Similar articles

Cited by

References

    1. McGranahan N, Swanton C. Clonal heterogeneity and tumor evolution: past, present, and the future. Cell. 2017;168:613–628. doi: 10.1016/j.cell.2017.01.018. - DOI - PubMed
    1. Welch JS, et al. The origin and evolution of mutations in acute myeloid leukemia. Cell. 2012;150:264–278. doi: 10.1016/j.cell.2012.06.023. - DOI - PMC - PubMed
    1. Nik-Zainal S, et al. The life history of 21 breast cancers. Cell. 2012;149:994–1007. doi: 10.1016/j.cell.2012.04.023. - DOI - PMC - PubMed
    1. Strino F, Parisi F, Micsinai M, Kluger Y. TrAp: a tree approach for fingerprinting subclonal tumor composition. Nucleic Acids Res. 2013;41:e165. doi: 10.1093/nar/gkt641. - DOI - PMC - PubMed
    1. Paguirigan AL, et al. Single-cell genotyping demonstrates complex clonal diversity in acute myeloid leukemia. Sci. Transl. Med. 2015;7:281re282. doi: 10.1126/scitranslmed.aaa0763. - DOI - PMC - PubMed

Publication types

MeSH terms