. 2020 Oct 21;11(1):5341.
doi: 10.1038/s41467-020-18925-4.

Early-onset autoimmunity associated with SOCS1 haploinsufficiency

Affiliations

Early-onset autoimmunity associated with SOCS1 haploinsufficiency

Jérôme Hadjadj et al. Nat Commun. .

Abstract

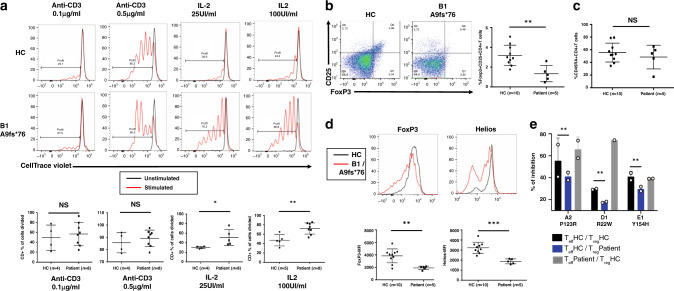
Autoimmunity can occur when a checkpoint of self-tolerance fails. The study of familial autoimmune diseases can reveal pathophysiological mechanisms involved in more common autoimmune diseases. Here, by whole-exome/genome sequencing we identify heterozygous, autosomal-dominant, germline loss-of-function mutations in the SOCS1 gene in ten patients from five unrelated families with early onset autoimmune manifestations. The intracellular protein SOCS1 is known to downregulate cytokine signaling by inhibiting the JAK-STAT pathway. Accordingly, patient-derived lymphocytes exhibit increased STAT activation in vitro in response to interferon-γ, IL-2 and IL-4 that is reverted by the JAK1/JAK2 inhibitor ruxolitinib. This effect is associated with a series of in vitro and in vivo immune abnormalities consistent with lymphocyte hyperactivity. Hence, SOCS1 haploinsufficiency causes a dominantly inherited predisposition to early onset autoimmune diseases related to cytokine hypersensitivity of immune cells.


Conflict of interest statement

The authors declare no competing interests.

Figures

Fig. 1
Fig. 1. Pedigrees and genetics of families with SOCS1 mutations.
a Pedigrees of families with SOCS1 mutations. Squares: males; circles: females; black: affected mutation carriers; gray: unaffected mutation carriers. WT: wild-type SOCS1 allele. b Clinical manifestations in patients with SOCS1 mutations. Discoid lupus erythematosus (D1, upper left), active lupus nephritis (E1, lower left) with segmental cellular crescent associated with mesangial hypercellularity (Masson’s trichrome × 400) and glomerular capillary wall and mesangial C1q deposition by immunofluorescence microscopy, abdominal MRI showing splenomegaly (C1, middle), and plaque, intertrigous and guttata psoriasis (E4, right). c SOCS1 protein domains and locations of the mutations (upper panel, black arrows). The kinase inhibitory region (KIR) functions as a pseudosubstrate that can inhibit the tyrosine kinase activity of Janus kinase (JAK) proteins. The SRC-homology 2 (SH2) domain binds the activation loop of the JAK proteins’ catalytic domain. The SOCS box recruits the ubiquitin-transferase system and initiates the proteasomal degradation of JAK proteins. The SOCS1 M161Afs*46 mutant leads to a predicted 46-residue neopeptide in the SOCS box domain three amino acids shorter than the wild-type protein (lower panel). d Top panel: position of the P123 and Y154 in human SOCS1 within a 3D model of the JAK1/SOCS1 complex. Bottom panel: a model of the human SOCS1’s SH2 domain. The two mutated amino acids (P123R and Y154H) are highlighted in the phosphotyrosine peptide binding groove (the pY and pY+3 pockets). The possible location of a phosphotyrosine peptide is shown in purple. e SOCS1 protein expression in patient-derived cells and transfected cells. Top: Western blot (WB) analysis of lysates from Epstein-Barr-virus (EBV)-tranformed B cells from patients A1, B2, and D1 and from two healthy controls (CT1 and CT2), following incubation with anti-SOCS1 antibodies (upper panel) or anti-actin antibodies as a loading control (lower panel). Bottom: HEK293T cells transiently transfected with an empty vector (EV), a vector coding for hemagglutinin (HA)-tagged wild-type (WT) SOCS1 protein, or vectors coding for the five HA-tagged mutant SOCS1 proteins. Lysates were incubated with anti-HA antibodies (upper panel) or anti-actin antibodies as a loading control (lower panel). Data are representative of two independent experiments.
Fig. 2
Fig. 2. SOCS1 mutations result in uncontrolled STAT pathways activation.
a, b Left: Western blots (WB) of patients (A1, B2, and D1) and healthy controls (CT) derived EBV-B cells stimulated with IFN-γ (103IU/ml for 1 h) (a) or IL-2 (104IU/ml for 2 h) (b). Lysates were incubated with an antibody against tyrosine-phosphorylated STAT (P-STAT) or against total STAT, as indicated. Right: densitometric quantification of the phospho-STAT/α-tubulin or β-actin ratio upon stimulation. a, b Data are representative of n = 3 (patients B2 and D1), n = 4 (A1, IL-2 stimulation), and n = 6 (A1, IFNγ stimulation) independent experiments. Statistics (versus CT2): IFNγ stimulation, A1 p = 0.0008, B1 p = 0.0029, D1 p = 0.0002; IL-2 stimulation, A1 p < 0.0001, B1 p = 0.0118, D1 p < 0.0001. c The nuclear and cytoplasmic fractions of EBV-B cells from a control (CT) and from patient A1 after stimulation with IFN-γ for 1 h (left) or with IL-2 for 2 h (right) were tested by WB for the presence of P-STAT1 and P-STAT5, respectively. Anti-lamin A/C and anti-α-tubulin antibodies were used to normalize the amount of nuclear and cytoplasmic proteins. Data are representative of two independent experiments. d Real-time quantitative RT-PCR assays of CXCL9 and CXCL10 expression 6 h after stimulation with IFN-γ (left), and assays of CISH and PIM1 expression 6 h after stimulation with IL-2 (right) in EBV-B cells from a CT and from patient A1. Results represent the fold-increased expression between stimulated and unstimulated states and are normalized to endogeneous GAPDH. Data are representative of n = 3 (IL-2 stimulation) and n = 4 (IFNγ stimulation) independent experiments performed in triplicate. Statistics: IFNγ stimulation, CXCL9 p = 0.0094, CXCL10 p = 0.0063; IL-2 stimulation, PIM1 p = 0.0105, CISH p = 0.0008. e Firefly luciferase activity in HEK293T cells transiently transfected with a gamma-activated sequence-driven IFN-γ reporter plasmid (GAS) and expression plasmids for WT or mutant SOCS1 proteins, and then stimulated with IFN-γ for 24 h. The results correspond to the fold-difference between the stimulated state and the unstimulated state. Results represent at least n = 4 independent experiments. All constructs were compared with WT SOCS1. Protein expression from the transfected plasmids was confirmed by immunoblotting the cell lysates (below, one representative result). Statistics: EV p < 0.0001, P123R p < 0.0001, A9FS*76 p < 0.0001, M161FS*46 p < 0.0001, R22W p = 0.0011, Y154H p = 0.0009. a, b, d, e Two-tailed p values were determined in an unpaired t est. Data indicate mean with SD. *P ≤ 0.05; **P ≤ 0.01; ***P ≤ 0.001; ****P ≤ 0.0001.
Fig. 3
Fig. 3. Inflammatory cytokine signature in serum from patients with SOCS1 mutations.
Cytokine array analysis of serum from patients with SOCS1 insufficiency, controls, patients with STAT1 GOF mutations, and patients with STAT3 GOF mutations. Gray: symptomatic patients; white: asymptomatic carriers. Decimal logarithms of the values determined in a multiplex bead assay were color-coded as follows: for each individual cytokine, median values obtained in the 17 HCs were defined as 0 (white). The X-fold standard deviation above this median (0 to +4, coded in red) or below this median (0 to −4, coded in blue) is shown with the individual squares. The color code was arbitrarily truncated at ±4 SDs.
Fig. 4
Fig. 4. Impact of SOCS1 mutations on T cell proliferation and on regulatory T cells.
a Proliferation of T-cell blasts from healthy controls (HC) and patients. Day-10 T-cell blasts were stimulated or not with IL-2 (100 IU/ml), or anti-CD3-coated beads for 4 days. Proliferation was determined from the level of dilution of the CellTrace Violet dye. The panel shows proliferation of all T cells (CD3+). Top: representative histograms showing cell divisions of T-cell blasts (red peak) from an HC and from patient B1. Peak in black: unstimulated cells. The data are quoted as the percentage of cells having undergone at least one division. Bottom: the percentage of dividing cells from HCs and patients (data pooled from n = 4 independent experiments including a total of four HC, five patients with IL-2 25UI/ml and eight patients with anti-CD3 or IL-2 100UI/ml). Two-tailed p values were determined in an unpaired t test (IL-2 25UI/ml p = 0.0433, IL2 100UI/ml p = 0.0038, NS, not significant). b Left: a representative flow cytometry analysis of FoxP3 and CD25 markers in CD4+ T cells from an HC and from patient B1. Right: FoxP3+CD25+ CD4+ T cells (as a percentage of total CD4+ T cells) in the peripheral blood of HCs (n = 10) and patients (n = 5). c Naïve CD45RA+CD4+ T cells (as a percentage of total CD4+ T cells) in the peripheral blood of HCs (n = 10) and patients (n = 5). d Top: representative histograms of FoxP3 and Helios expression in CD4+CD25+CD127low T cells from an HC (black) and patient B1 (red). Bottom: mean fluorescence intensity (MFI) of the respective Treg cell markers in HCs (n = 10) and patients (n = 5). bd Two-tailed p values were determined in a Mann–Whitney test (Panel B p = 0.0047; Panel D FoxP3 p = 0.008, Helios p = 0.0007, NS, not significant). ad Data indicate mean with SD, and each dot corresponds to an individual. e Suppressive activity of regulatory T cells. VioBlue-labeled Teff cells were cultured in the absence or presence of Treg cells from HCs and patients (A2, D1, and E1). Proliferation was determined from the level of dilution of the VioBlue dye. Graphs indicate percentages of suppression from patients. Data are from three independent experiments in duplicate with a healthy control and indicated patient tested in pairs. Data indicate mean with SD of technical replicates due to the lack of cells for more experiments. Two-tailed p value was determined in a paired t-test between patients and controls (p = 0.0055). ae *P ≤ 0.05; **P ≤ 0.01, ***P ≤ 0.001.
Fig. 5
Fig. 5. In vitro and ex vivo efficacy of JAK1/JAK2 inhibition.
a EBV-B cells from HCs and from patient A1 were stimulated with IFN-γ (103IU/ml for 1 h, left) and IL-2 (104IU/ml for 2 h, right) in the presence or absence of ruxolitinib (Ruxo). Lysates were incubated with the indicated anti-P-STAT and anti-STAT antibodies, or anti-actin antibodies as a loading control. Data are representative of two independent experiments. b EBV-B cells from controls (CT) and from patient A1 were preincubated or not with ruxolitinib for 1 h, and stimulated for 6 h with IFN-γ. mRNA expression of the STAT1-regulated gene CXCL9 was determined in a quantitative RT-PCR assay. Results represent the fold-increased expression between stimulated and unstimulated states and are normalized to endogeneous GAPDH. Experiment performed once. c Effect of in vitro treatment with ruxolitinib on T-cell proliferation. T-cell blasts from patient C1 were stimulated with IL-2 (100 IU/ml) or anti-CD3/CD28 beads, in the presence or absence of ruxolitinib. The panel shows the proliferation of all T cells (CD3+). Data are representative of two independent experiments with cells from five patients (A1, A2, B1, B2, and C1). d Primary monocytes from healthy control (CT, filled line) and E1 before (blue line) and under treatment by 2 mg (orange line) or 4 mg (red line) of baricitinib were stimulated with IFN-γ for 15 min and STAT1 phosphorylation (P-STAT1) was determined by intracelular flow cytometry.

References

    1. Goodnow CC. Multistep pathogenesis of autoimmune disease. Cell. 2007;130:25–35. doi: 10.1016/j.cell.2007.06.033. - DOI - PubMed
    1. Grimbacher B, Warnatz K, Yong PFK, Korganow A-S, Peter H-H. The crossroads of autoimmunity and immunodeficiency: Lessons from polygenic traits and monogenic defects. J. Allergy Clin. Immunol. 2016;137:3–17. doi: 10.1016/j.jaci.2015.11.004. - DOI - PubMed
    1. Villarino AV, Kanno Y, O’Shea JJ. Mechanisms and consequences of Jak-STAT signaling in the immune system. Nat. Immunol. 2017;18:374–384. doi: 10.1038/ni.3691. - DOI - PMC - PubMed
    1. Yoshimura A, Naka T, Kubo M. SOCS proteins, cytokine signalling and immune regulation. Nat. Rev. Immunol. 2007;7:454–465. doi: 10.1038/nri2093. - DOI - PubMed
    1. Liau NPD, et al. The molecular basis of JAK/STAT inhibition by SOCS1. Nat. Commun. 2018;9:1558. doi: 10.1038/s41467-018-04013-1. - DOI - PMC - PubMed

Publication types

MeSH terms

Substances