. 2020 Oct 21;7(1):363.
doi: 10.1038/s41597-020-00699-5.

Simultaneous BOLD-fMRI and constant infusion FDG-PET data of the resting human brain

Affiliations

Simultaneous BOLD-fMRI and constant infusion FDG-PET data of the resting human brain

Sharna D Jamadar et al. Sci Data. .

Abstract

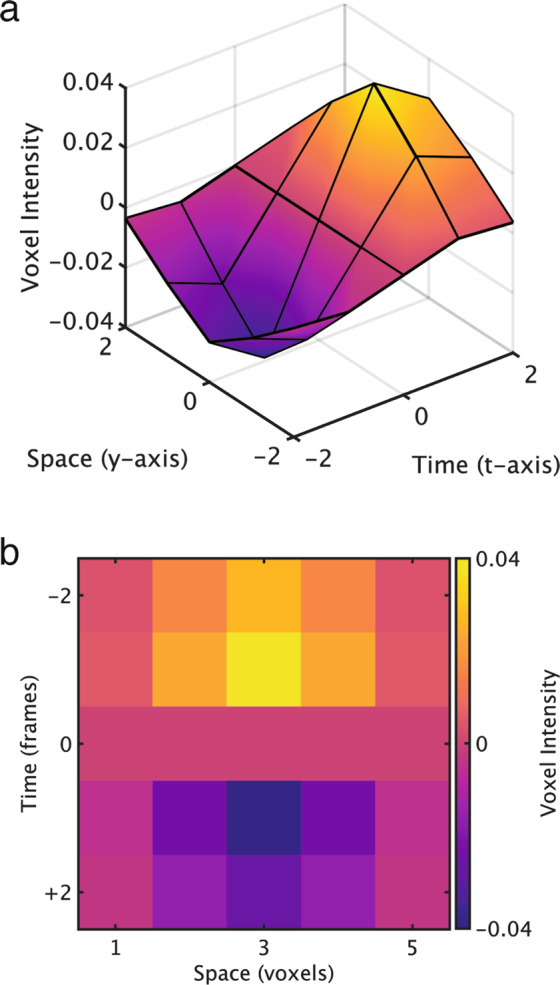
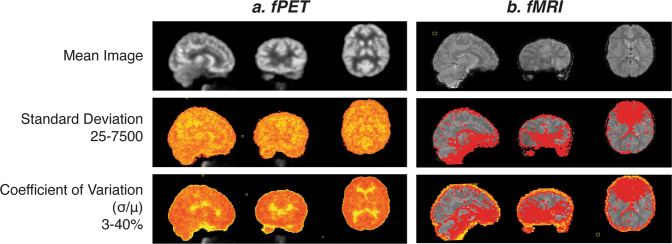
Simultaneous [18 F]-fluorodeoxyglucose positron emission tomography and functional magnetic resonance imaging (FDG-PET/fMRI) provides the capability to image two sources of energetic dynamics in the brain - cerebral glucose uptake and the cerebrovascular haemodynamic response. Resting-state fMRI connectivity has been enormously useful for characterising interactions between distributed brain regions in humans. Metabolic connectivity has recently emerged as a complementary measure to investigate brain network dynamics. Functional PET (fPET) is a new approach for measuring FDG uptake with high temporal resolution and has recently shown promise for assessing the dynamics of neural metabolism. Simultaneous fMRI/fPET is a relatively new hybrid imaging modality, with only a few biomedical imaging research facilities able to acquire FDG PET and BOLD fMRI data simultaneously. We present data for n = 27 healthy young adults (18-20 yrs) who underwent a 95-min simultaneous fMRI/fPET scan while resting with their eyes open. This dataset provides significant re-use value to understand the neural dynamics of glucose metabolism and the haemodynamic response, the synchrony, and interaction between these measures, and the development of new single- and multi-modality image preparation and analysis procedures.


Conflict of interest statement

Siemens Healthineers contributed financial support to the ARC Linkage project held by G.F.E., S.D.J., Z.C., A.F., M.P. & N.J.S. K.O’B. and D.S. are employees and shareholders of Siemens Healthcare Pty Ltd. P.G.D.W. & T.G.C. have no competing or conflicting interests.

Figures

Fig. 1
Fig. 1
Paradigm & workflow. Panels a–d indicate the workflow for the data available in the Monash rsPET-MR dataset and panels e-g indicate the workflow for the results presented under Technical Validation, and in Jamadar et al.. (a) Participants completed a demographics, safety screening and cognitive assessment an hour prior to MR-PET scanning. (b) Next, participants were prepared for scanning; a cannula was placed in the forearm vein of each arm, and then haemoglobin and blood sugar level was taken. (c) Participants then underwent a 95-minute MR-PET scan using the paradigm shown here. (d) Illustration of the data obtained for each method (left to right): Structural T1 MRI anatomical images for each subject (subj); static PET (sPET) acquired a single image per subject; functional PET (fPET) was binned into 16 sec images, resulting in a timeseries of images for each subject; fMR images were obtained with TR 2.45 sec, resulting in a timeseries for each subject. (e) Structural T1 MRI was registered to MNI space and then segmented into 82 regions of interest (ROI). This parcellation was applied to the sPET, fPET and fMRI images. (f) Illustration of example processing steps for each modality, as used in Jamadar et al. (2020). sPET was demeaned, parcellated into 82 regions (ROIs) and then correlated across subjects. Scatterplot shows an example correlation between two regions across subjects, out of a total of 82 × 82 region-wise correlations. fPET was motion corrected (moco), filtered, parcellated, and then correlated across time-series for each subject. Illustration shows 2 example timeseries of the total 82 × 82 region-by-region correlations conducted. fMRI was preprocessed, parcellated, correlated across time for each subject, then group-averaged. (g) Subject-level matrices for sPET, fPET and fMRI were then group averaged. Matrices are indicative of potential connectivity matrices, and are those that are reported in Jamadar et al..
Fig. 2
Fig. 2
Mean relative displacement (mm) for translational motion parameters for each subject.
Fig. 3
Fig. 3
Plasma radioactivity curves for each individual subject. A 2nd order polynomial was fit to the blood samples for each subject (shown in grey). The group average is shown plotted in black. Samples were not obtainable for 5 individuals.
Fig. 4
Fig. 4
(a) Group-average fPET connectivity matrix, as reported in Jamadar et al., 2020. (b) Stability of fPET connectivity matrix over the six experimental blocks. Refer to Fig. 1 for the experimental design.
Fig. 5
Fig. 5
Voxel weights for the spatiotemporal filter, depicted along the y-axis and the time axis. The filter is symmetrical in the x and z axis directions.
Fig. 6
Fig. 6
Variability of fPET connectivity matrix over a range of temporal (t) and spatial (s) filter widths.
Fig. 7
Fig. 7
Raw images for one individual subject showing signal intensity variation across the brain. Top panel shows mean image across a 10-minute run; middle panel shows standard deviation across the same run; and lower panel shows the coefficient of variation (standard deviation divided by the mean) across the run.

References

    1. Chen Z, et al. From simultaneous to synergistic MR‐PET brain imaging: A review of hybrid MR‐PET imaging methodologies. Hum. Brain Mapp. 2018;39:5126–5144. doi: 10.1002/hbm.24314. - DOI - PMC - PubMed
    1. Ekstrom A. How and when the fMRI BOLD signal relates to underlying neural activity: The danger in dissociation. Brain Res. Rev. 2010;62:233–244. doi: 10.1016/j.brainresrev.2009.12.004. - DOI - PMC - PubMed
    1. Logothetis NK. What we can do and what we cannot do with fMRI. Nature. 2008;453:869–878. doi: 10.1038/nature06976. - DOI - PubMed
    1. Birn RM. The role of physiological noise in resting-state functional connectivity. NeuroImage. 2012;62:864–870. doi: 10.1016/j.neuroimage.2012.01.016. - DOI - PubMed
    1. Chang C, Cunningham JP, Glover GH. Influence of heart rate on the BOLD signal: The cardiac response function. NeuroImage. 2009;44:857–869. doi: 10.1016/j.neuroimage.2008.09.029. - DOI - PMC - PubMed

Publication types

Substances