

Texture features from computed tomography correlate with markers of severity in acute alcohol-associated hepatitis
- PMID: 33087739
- PMCID: PMC7578052
- DOI: 10.1038/s41598-020-74599-4
Texture features from computed tomography correlate with markers of severity in acute alcohol-associated hepatitis
Abstract
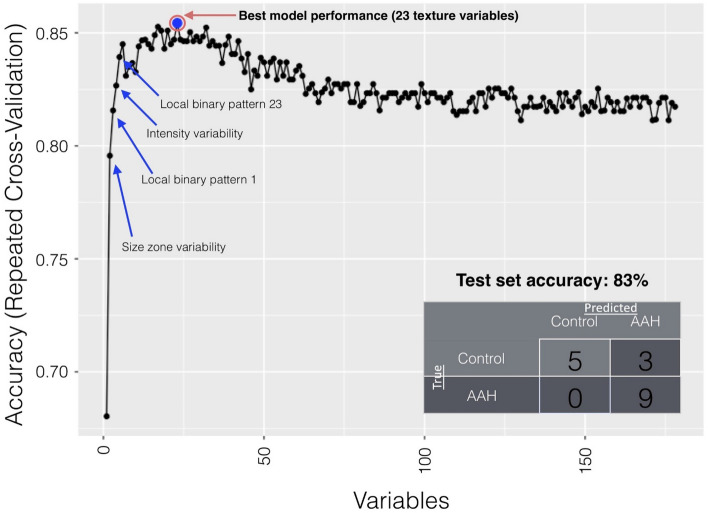
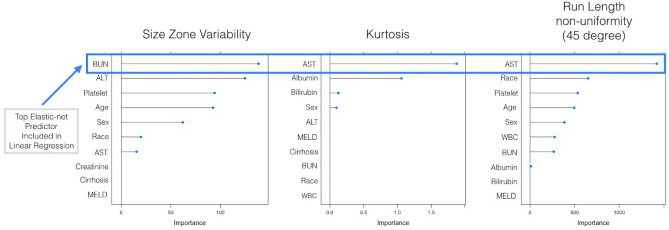
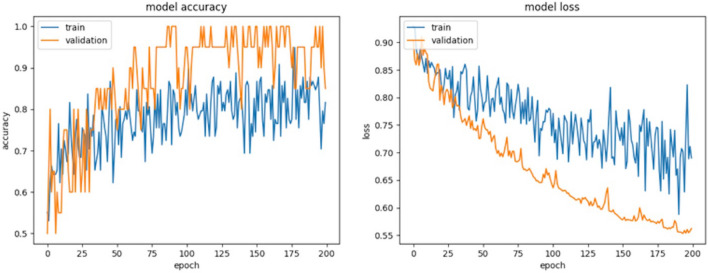
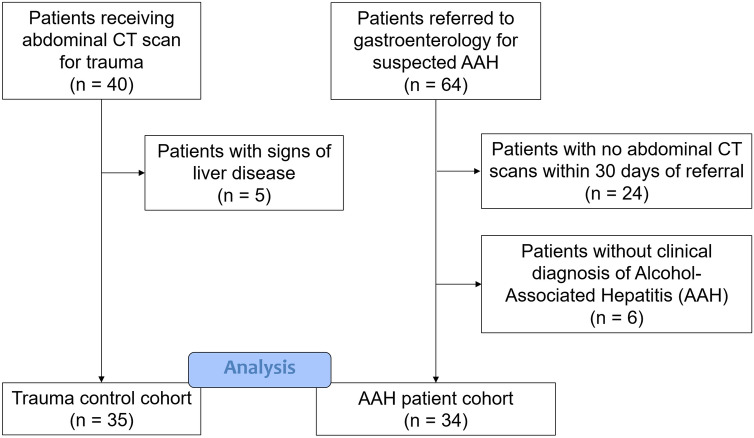
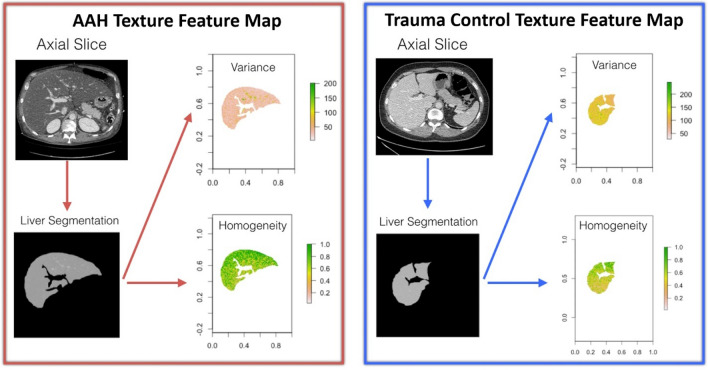
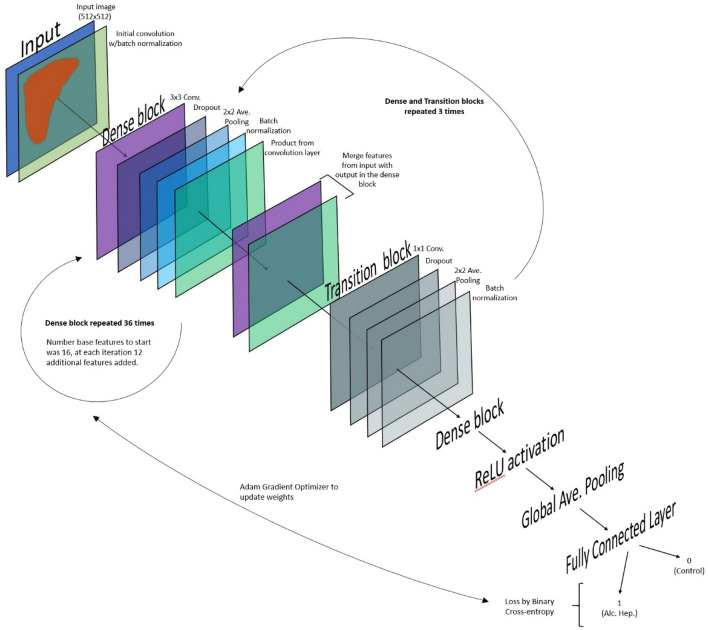
The aim of this study was to use texture analysis to establish quantitative CT-based imaging features to predict clinical severity in patients with acute alcohol-associated hepatitis (AAH). A secondary aim was to compare the performance of texture analysis to deep learning. In this study, mathematical texture features were extracted from CT slices of the liver for 34 patients with a diagnosis of AAH and 35 control patients. Recursive feature elimination using random forest (RFE-RF) was used to identify the best combination of features to distinguish AAH from controls. These features were subsequently used as predictors to determine associated clinical values. To compare machine learning with deep learning approaches, a 2D dense convolutional neural network (CNN) was implemented and trained for the classification task of AAH. RFE-RF identified 23 top features used to classify AAH images, and the subsequent model demonstrated an accuracy of 82.4% in the test set. The deep learning CNN demonstrated an accuracy of 70% in the test set. We show that texture features of the liver are unique in AAH and are candidate quantitative biomarkers that can be used in prospective studies to predict the severity and outcomes of patients with AAH.
Conflict of interest statement
The authors declare no competing interests.
Figures
Similar articles
-
"Pseudotumoral" hepatic areas in acute alcoholic hepatitis: a computed tomography and histological study.Am J Gastroenterol. 2005 Apr;100(4):831-6. doi: 10.1111/j.1572-0241.2005.41272.x. Am J Gastroenterol. 2005. PMID: 15784028
-
Deep feature classification of angiomyolipoma without visible fat and renal cell carcinoma in abdominal contrast-enhanced CT images with texture image patches and hand-crafted feature concatenation.Med Phys. 2018 Apr;45(4):1550-1561. doi: 10.1002/mp.12828. Epub 2018 Mar 25. Med Phys. 2018. PMID: 29474742
-
Machine learning-based quantitative texture analysis of CT images of small renal masses: Differentiation of angiomyolipoma without visible fat from renal cell carcinoma.Eur Radiol. 2018 Apr;28(4):1625-1633. doi: 10.1007/s00330-017-5118-z. Epub 2017 Nov 13. Eur Radiol. 2018. PMID: 29134348
-
Is liver biopsy necessary in the management of alcoholic hepatitis?World J Gastroenterol. 2013 Nov 28;19(44):7825-9. doi: 10.3748/wjg.v19.i44.7825. World J Gastroenterol. 2013. PMID: 24307775 Free PMC article. Review.
-
Automatic Segmentation of Multiple Organs on 3D CT Images by Using Deep Learning Approaches.Adv Exp Med Biol. 2020;1213:135-147. doi: 10.1007/978-3-030-33128-3_9. Adv Exp Med Biol. 2020. PMID: 32030668 Review.
Cited by
-
Artificial intelligence for hepatitis evaluation.World J Gastroenterol. 2021 Sep 14;27(34):5715-5726. doi: 10.3748/wjg.v27.i34.5715. World J Gastroenterol. 2021. PMID: 34629796 Free PMC article. Review.
-
Noninvasive imaging of hepatic dysfunction: A state-of-the-art review.World J Gastroenterol. 2022 Apr 28;28(16):1625-1640. doi: 10.3748/wjg.v28.i16.1625. World J Gastroenterol. 2022. PMID: 35581963 Free PMC article. Review.
-
Insights into ALD and AUD diagnosis and prognosis: Exploring AI and multimodal data streams.Hepatology. 2024 Dec 1;80(6):1480-1494. doi: 10.1097/HEP.0000000000000929. Epub 2024 May 14. Hepatology. 2024. PMID: 38743008 Review.
-
Multiparametric MRI and Machine Learning Based Radiomic Models for Preoperative Prediction of Multiple Biological Characteristics in Prostate Cancer.Front Oncol. 2022 Feb 7;12:839621. doi: 10.3389/fonc.2022.839621. eCollection 2022. Front Oncol. 2022. PMID: 35198452 Free PMC article.
