Meta-Analysis
. 2020 Oct 21;10(1):17936.
doi: 10.1038/s41598-020-74943-8.

Assessment of the course of acute pancreatitis in the light of aetiology: a systematic review and meta-analysis

Affiliations
Meta-Analysis

Assessment of the course of acute pancreatitis in the light of aetiology: a systematic review and meta-analysis

Emese Réka Bálint et al. Sci Rep. .

Abstract

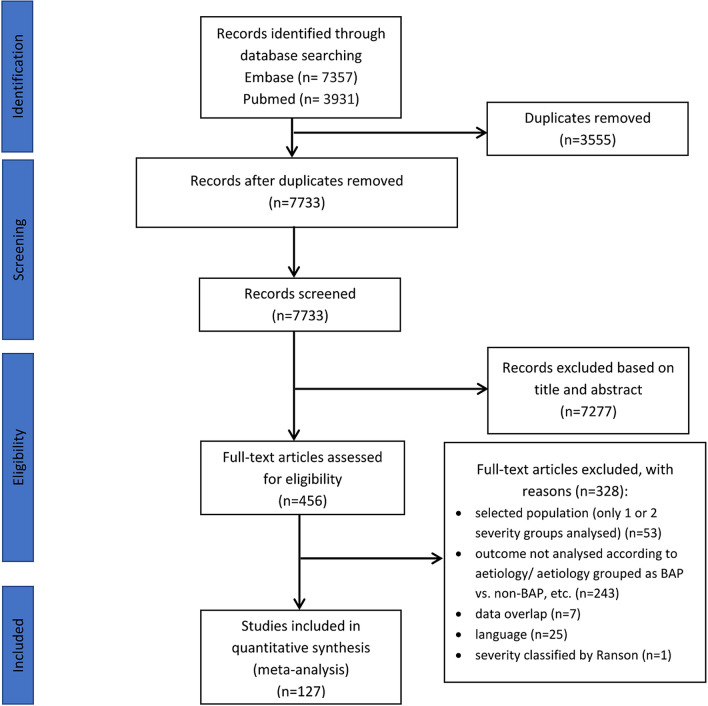
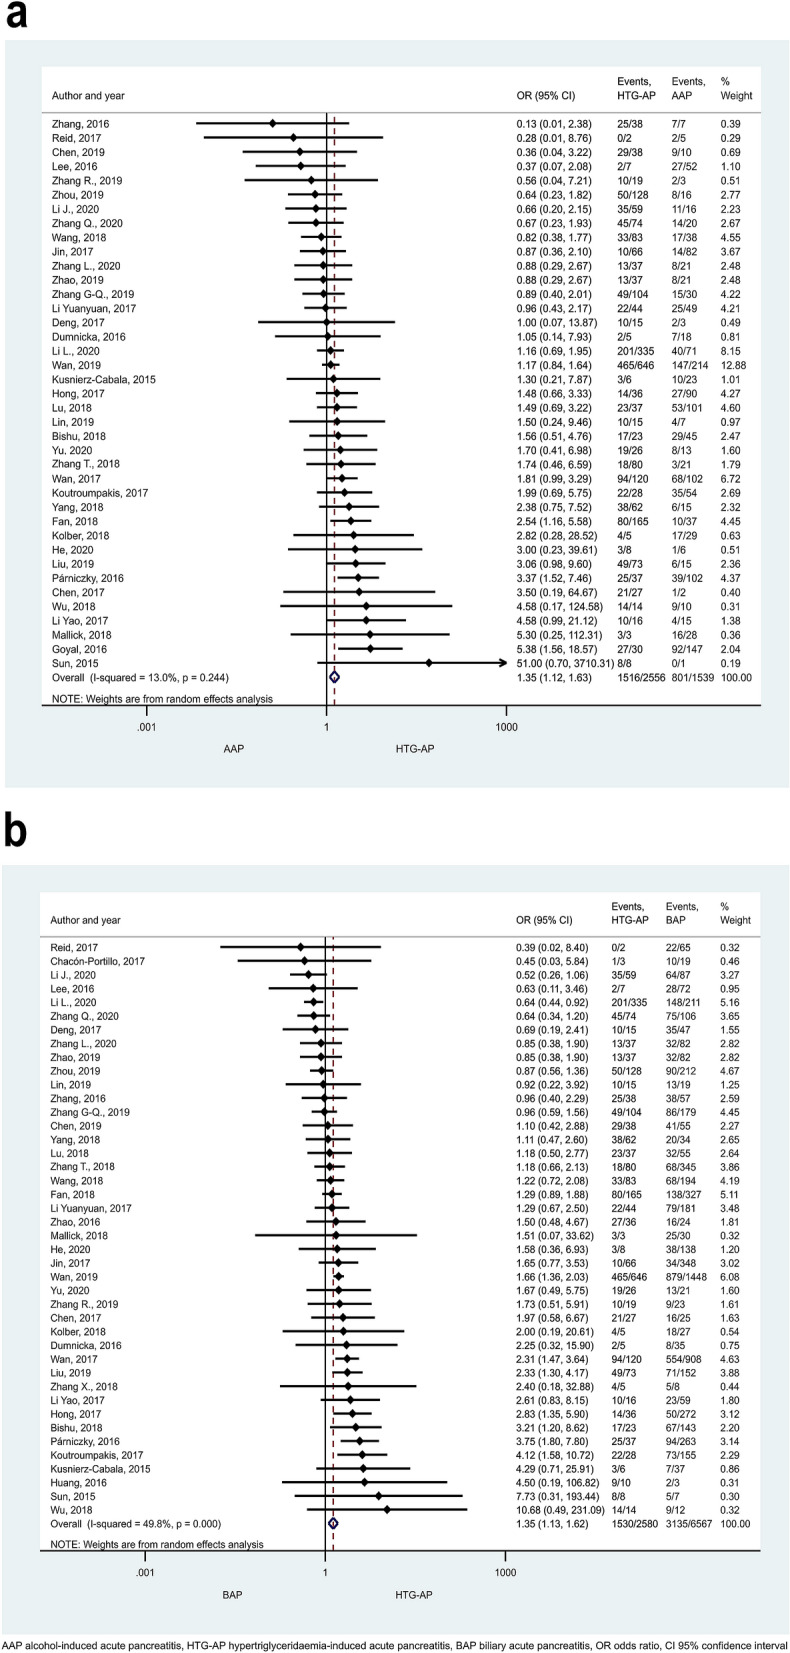
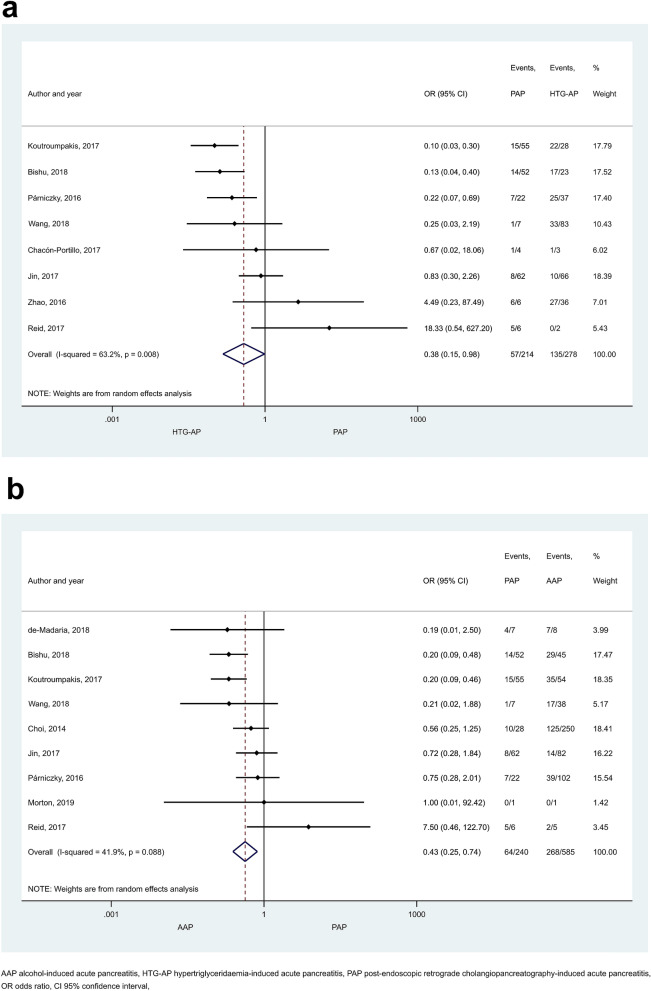
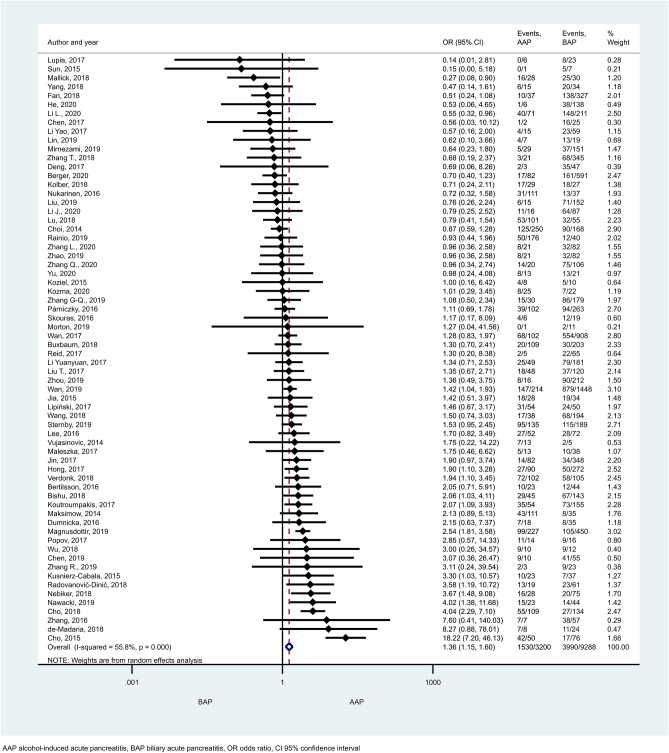
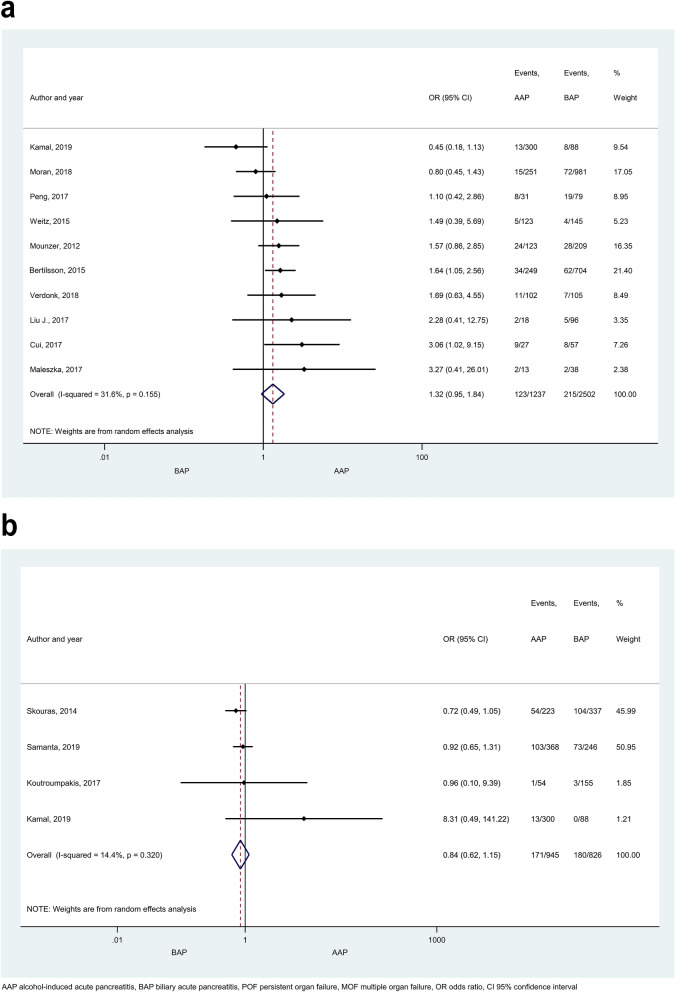
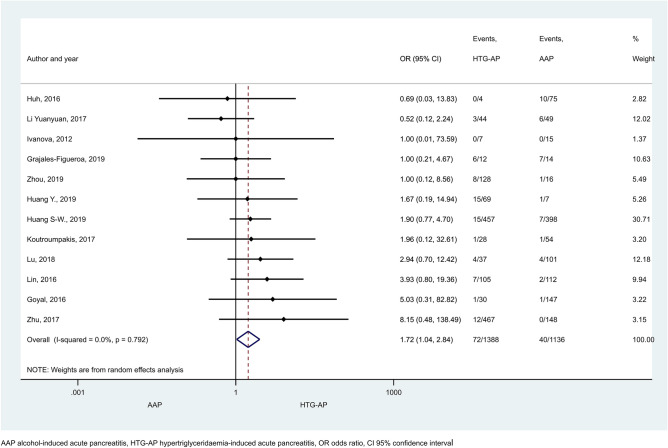
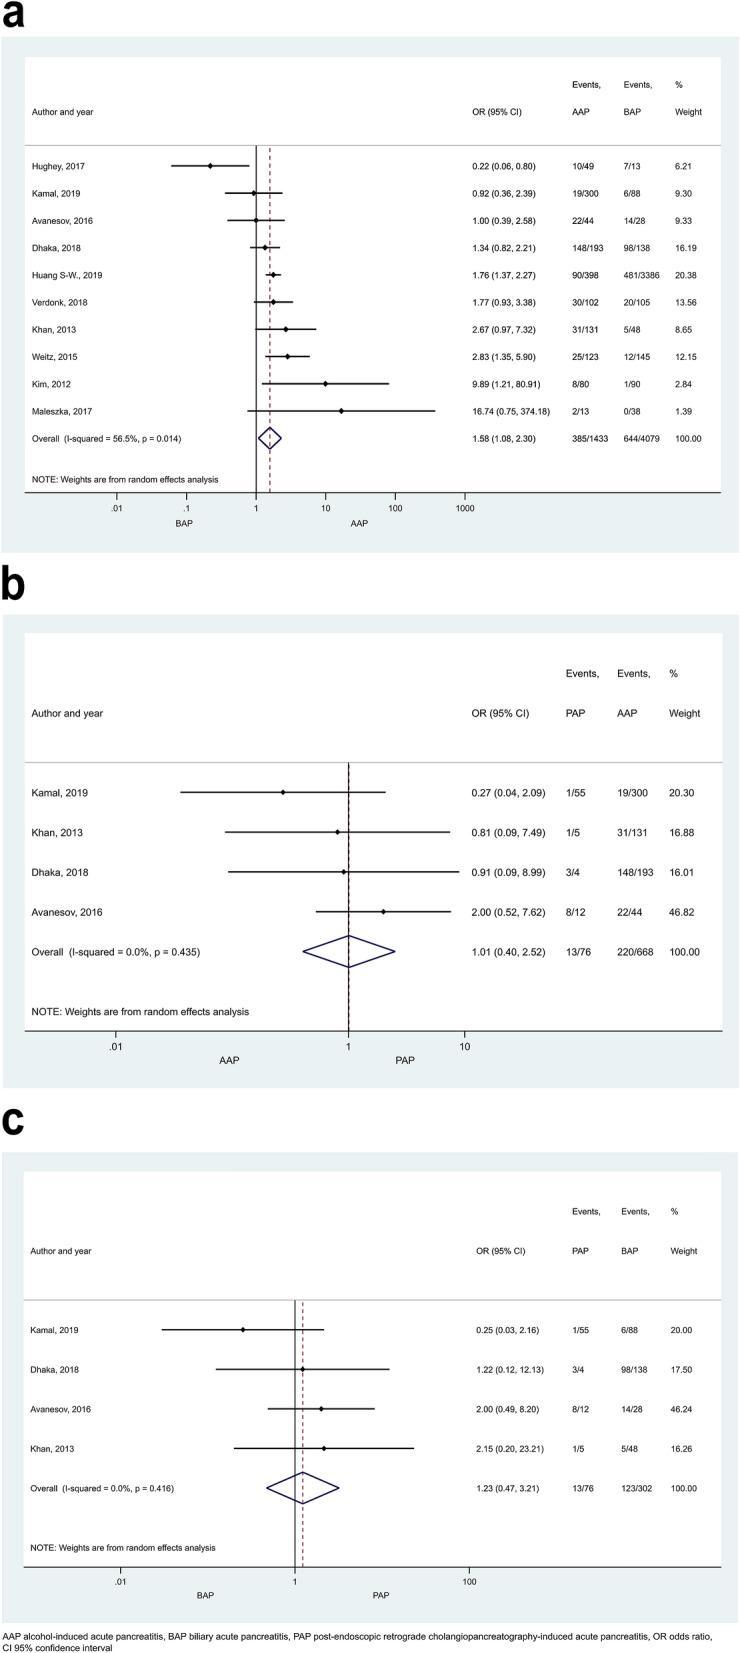
The main causes of acute pancreatitis (AP) are biliary disease, alcohol consumption, hypertriglyceridaemia (HTG) and endoscopic retrograde cholangiopancreatography (ERCP). The aim of this meta-analysis was to evaluate the effects of these aetiological factors on the severity and outcome of AP. Pubmed and Embase were searched between 01/01/2012 and 31/05/2020. Included articles involved adult alcoholic, biliary, HTG- or post-ERCP AP (PAP) patients. Primary outcome was severity, secondary outcomes were organ failures, intensive care unit admission, recurrence rate, pancreatic necrosis, mortality, length of hospital stay, pseudocyst, fluid collection and systematic inflammatory response syndrome. Data were analysed from 127 eligible studies. The risk for non-mild (moderately severe and severe) condition was the highest in HTG-induced AP (HTG-AP) followed by alcoholic AP (AAP), biliary AP (BAP) and PAP. Recurrence rate was significantly lower among BAP vs. HTG-AP or AAP patients (OR = 2.69 and 2.98, 95% CI 1.55-4.65 and 2.22-4.01, respectively). Mortality rate was significantly greater in HTG-AP vs. AAP or BAP (OR = 1.72 and 1.50, 95% CI 1.04-2.84 and 0.96-2.35, respectively), pancreatic necrosis occurred more frequently in AAP than BAP patients (OR = 1.58, 95% CI 1.08-2.30). Overall, there is a potential association between aetiology and the development and course of AP. HTG-AP is associated with the highest number of complications. Furthermore, AAP is likely to be more severe than BAP or PAP. Greater emphasis should be placed on determining aetiology on admission.


Conflict of interest statement

The authors declare no competing interests.

Figures

Figure 1
Figure 1
PRISMA 2009 flow diagram for identification of relevant articles.
Figure 2
Figure 2
Forest plot showing the comparison of disease severity in (A) HTG-AP and AAP, p = 0.001; (B) HTG-AP and BAP, p = 0.001. Filled diamonds represent the ORs derived from the articles analysed. Horizontal bars represent CI. Empty diamond shows the overall OR (middle of the diamond and CIs are the edges) for non-mild (moderately severe and severe groups based on the Revised Atlanta Classification) disease. Heterogeneity of the results was presented by I-square and p value.
Figure 3
Figure 3
Forest plot showing the comparison of disease severity in (A) HTG-AP and PAP, p = 0.045; (B) AAP and PAP, p = 0.002. Filled diamonds represent the ORs derived from the articles analysed. Horizontal bars represent CI. Empty diamond shows the overall OR (the middle of the diamond, CIs are the edges) for non-mild disease.
Figure 4
Figure 4
Forest plot showing the comparison of disease severity in AAP and BAP, p < 0.001. Filled diamonds represent the ORs derived from the articles analysed. Horizontal bars represent CI. Empty diamond shows the overall OR (middle of the diamond, CIs are the edges) for non-mild disease.
Figure 5
Figure 5
Forest plot showing the effect of different disease aetiologies on POF and MOF. The effects of BAP vs. AAP on (A) POF, p = 0.102; and (B) MOF, p = 0.284. Filled diamonds represent the ORs derived from the articles analysed. Horizontal bars represent CI. Empty diamond shows the overall OR (the middle of the diamond, CIs are the edges).
Figure 6
Figure 6
Forest plot showing the effect of HTG-AP and AAP on mortality, p = 0.034. Filled diamonds represent the ORs derived from the articles analysed. Horizontal bars represent CI. Empty diamond shows the overall OR (the middle of the diamond, CIs are the edges).
Figure 7
Figure 7
Forest plot showing the effects of different disease aetiologies on pancreatic necrosis. The effects of (A) BAP vs. AAP, p = 0.019; (B) AAP vs. PAP, p = 0.982; (C) BAP vs. PAP, p = 0.674. Filled diamonds represent the ORs derived from the articles analysed. Horizontal bars represent CI. Empty diamond shows the overall OR (the middle of the diamond, CIs are the edges).

Similar articles

Cited by

References

    1. Peery AF, et al. Burden and cost of gastrointestinal, liver, and pancreatic diseases in the United States: update 2018. Gastroenterology. 2019;156:254–272.e11. doi: 10.1053/j.gastro.2018.08.063. - DOI - PMC - PubMed
    1. Forsmark CE, Swaroop Vege S, Wilcox CM. Acute Pancreatitis. N. Engl. J. Med. 2016;375:1972–1981. doi: 10.1056/NEJMra1505202. - DOI - PubMed
    1. Petrov MS, Yadav D. Global epidemiology and holistic prevention of pancreatitis. Nat. Rev. Gastroenterol. Hepatol. 2019;16:175–184. doi: 10.1038/s41575-018-0087-5. - DOI - PMC - PubMed
    1. van Geenen EJM, van der Peet DL, Bhagirath P, Mulder CJJ, Bruno MJ. Etiology and diagnosis of acute biliary pancreatitis. Nat. Rev. Gastroenterol. Hepatol. 2010;7:495–502. doi: 10.1038/nrgastro.2010.114. - DOI - PubMed
    1. Yadav D, Whitcomb DC. The role of alcohol and smoking in pancreatitis. Nat. Rev. Gastroenterol. Hepatol. 2010;7:131–145. doi: 10.1038/nrgastro.2010.6. - DOI - PubMed

Publication types

MeSH terms