. 2021 Mar;28(3):1076-1090.
doi: 10.1038/s41418-020-00638-2. Epub 2020 Oct 21.

SPATA33 is an autophagy mediator for cargo selectivity in germline mitophagy

Affiliations

SPATA33 is an autophagy mediator for cargo selectivity in germline mitophagy

Ying Zhang et al. Cell Death Differ. 2021 Mar.

Abstract

Selective autophagic degradation of mitochondria (mitophagy) is important in maintaining proper cellular homeostasis. Here, we found that SPATA33 is a novel autophagy mediator for mitophagy in testis. The SPATA33 protein localizes on mitochondria via its binding of the carboxyl terminal with the outer mitochondrial membrane protein VDAC2. Upon starvation induction, SPATA33 is recruited to autophagosome by binding the autophagy machinery ATG16L1 via its N-terminal along with mitochondria. Notably, Spata33 knockout inhibited autophagy and overexpression can promote autophagosome formation for mitochondrial sequestration. Therefore, SPATA33 confers selectivity for mitochondrial degradation and promotes mitophagy in male germline cells.


Conflict of interest statement

The authors declare that they have no conflict of interest.

Figures
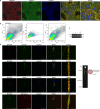
Fig. 1
Fig. 1. SPATA33 and ATG16L1 are colocalized in germline cells in mice.
a Immunofluorescence of SPATA33 and ATG16L1 proteins in mouse testis. Anti-SPATA33, anti-ATG16L1 (Alexa Fluor®488), and TRITC-conjugated goat anti-rabbit IgG (H + L) antibodies were used to detect SPATA33 (red) and ATG16L1 (green). The nuclei were stained by Hoechst (blue). Images were taken by confocal fluorescence microscopy (SP8, Leica, Wetzlar, Germany). Positive signals were detected in Leydig cells (LC), Sertoli cells (Sn), spermatogonia (Sg), spermatocytes (Sc), and spermatids (Sp). Scale bar, 25 μm; scale bar in enlarged panels: 20 μm. b Cell sorting of spermatogonia (Sg), spermatocytes (Sc), and the round spermatids (Sp) from testis by cell flow sorter. Serial charts of cells were indicated. c Expression of Spata33 was detected in spermatogonia (Sg), spermatocyte (Sc), the round spermatids (Sp), and spermatozoa (sperm). The sperm cells were isolated from epididymis of adult mouse. RT-PCR was performed from mRNAs isolated from these cells. Actin was used as an internal control. d SPATA33 was colocalized with ATG16L1, LC3B, and VDAC2 in the mid-piece region (mitochondria region) of the sperm cells. The spermatozoa were extracted from epididymis of adult mice. The cells were stained with MitoTracker (mitochondria matrix marker, red). Immunofluorescence analysis were performed with anti-SPATA33, anti-ATG16L1 (Alexa Fluor®488), anti-VDAC2, anti-LC3B (Alexa Fluor®488), TRITC-conjugated goat anti-rabbit IgG (H + L), and FITC-conjugated rabbit anti-goat IgG (H + L) antibodies. The enlarged images were originated from the squares in the merged panels. The nuclei were stained by Hoechst (blue). Images were taken by confocal fluorescence microscopy (SP8, Leica). The graph on the right indicates sperm ultrastructure, highlighting cross-section of the mid-piece region, including axoneme, outer dense fiber, and mitochondrial sheath (red). Scale bar: 25 μm; scale bar in enlarged panels: 6 μm.
Fig. 2
Fig. 2. SPATA33 interacts with ATG16L1 to form autophagic puncta upon starvation induction.
a Coimmunoprecipitation of MYC-SPATA33 with Cherry-FLAG-ATG16L1. HEK293T cells were transiently transfected with pMYC-SPATA33 and pCherry-FLAG-ATG16L1. After 48 h, the whole cell lysate was extracted for coimmunoprecipitation with anti-MYC, or anti-FLAG. Anti-FLAG or anti-MYC was also used for western blotting. Arrowheads indicate the immunoprecipitated bands. b Coimmunoprecipitation between MYC-SPATA33 and deletion mutants of ATG16L1. pMYC-SPATA33 was transiently co-transfected with pGFP-N-ATG16L1 or pGFP-C-ATG16L1 in HEK293T cells. Cell lysates were examined by western blotting using the anti-MYC or anti-GFP antibody. For coimmunoprecipitation, the lysates were immunoprecipitated with anti-MYC, followed by immunoblotting with the anti-GFP antibody. Arrowheads indicate the immunoprecipitated bands. c Endogenous ATG16L1 interacted with FLAG-SPATA33. HEK293T cells were transiently transfected with p3xFLAG-SPATA33, and after 48 h, the whole cell lysate was extracted for coimmunoprecipitation with anti-ATG16L1 or anti-FLAG. Anti-ATG16L1 or anti-FLAG antibody was also used for western blotting. d Colocalization of SPATA33 with ATG16L1 in HeLa cells under starvation condition. HeLa cells were transiently co-transfected with pCherry-SPATA33 and pGFP-ATG16L1. After cultured in normal medium for 24 h, the cells were starved in EBSS medium for 2 h, and analyzed by confocal microscopy. The nuclei were stained by Hoechst (blue). The insets showed an enlarged view of the indicated squares. Yellow puncta in merged panels are the colocalized puncta. Scale bar: 25 μm. e Statistical analysis of colocalized puncta between SPATA33 and ATG16L1. f Colocalization of SPATA33 with LC3B in HeLa cells under starvation condition. HeLa cells were transiently co-transfected with pCherry-SPATA33 and pGFP-LC3B and cultured in normal medium for 24 h. The cells were starved in EBSS medium for 2 h, and analyzed by confocal microscopy. The nuclei were stained by Hoechst (blue). The insets showed an enlarged view of the indicated squares. Yellow puncta in merged panel are the colocalized puncta. Scale bar: 25 μm. g Statistical analysis of colocalized puncta between SPATA33 and LC3B. Data are presented as means ± S.D. **p < 0.01 (n = 3 independent experiments).
Fig. 3
Fig. 3. Spata33 knockout inhibits autophagy.
a LC3B puncta were detected in WT TM4 cells after starvation culture (EBSS) for 0.5 h. The cells were cultured in EBSS for the indicated time and analyzed by immunofluorescence with the anti-LC3B antibody and confocal microscopy. The insets showed an enlarged view of the indicated squares and highlighted red LC3B puncta in the cytoplasm. The nuclei were stained with Hoechst reagent. Scale bar: 20 μm. b LC3B puncta were detected at 1 and 2 h under starvation culture in the Spata33−/− cells. Scale bar: 20 μm. c To rescue Spata33 expression in the Spata33−/− cells, the cells were infected with lentivirus expressing 3xFLAG-SPATA33. Immunofluorescence with the anti-LC3B antibody showed obvious LC3B puncta appeared again at 0.5 h under starvation culture. Scale bar: 20 μm. d To overexpress Spata33 in the WT TM4 cells, the cells were infected with lentivirus expressing 3xFLAG-SPATA33 and analyzed by immunofluorescence with the anti-LC3B antibody. Obvious LC3B puncta were detected again at 0.5 h under starvation culture. Scale bar: 20 μm. e. Statistical analysis of LC3B puncta from (a) to (d). The number of LC3B puncta in 30 cells was counted for each group. Data are presented as mean ± S.D. *p < 0.05; **p < 0.01 (n = 3 independent experiments).
Fig. 4
Fig. 4. Spata33 knockout inhibits mitophagy.
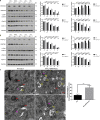
a Spata33 knockout decreased autophagy and mitochondrial related protein levels. WT TM4 and Spata33−/− cell lines (#32-10) were cultured in the EBSS medium for 0, 0.5, 1, 2, and 4 h, respectively. Cell lysates were analyzed by immunoblotting with the anti-SQSTM1, anti-LC3B, anti-VDAC2, or anti-COX-IV. GAPDH was used as an endogenous control. The graphs on the right panels indicate statistical analysis of the gray scanned SQSTM1, LC3B, VDAC2, and COX-IV from (a). b Atg16l1 knockout decreased autophagy and mitochondrial related protein levels. WT TM4 and Atg16l1−/− cell lines (#1-13, the group were not from single KO clone) were cultured in the EBSS medium for 0, 0.5, 1, 2, and 4 h, respectively. Cell lysates were analyzed by immunoblotting with the anti-SQSTM1, anti-LC3B, anti-VDAC2, or anti-COX-IV antibody. GAPDH was used as an endogenous control. The graphs on the right panels indicate statistical analysis of the gray scanned SQSTM1, LC3B, VDAC2, and COX-IV from (b). c Electron microscopy showed the mitophagosome in wild type and SPATA33-overexpressed GC-1 cells. Enlarged images were showed in the lower panels. The yellow arrow indicates autolysosome, the purple arrows show the degraded mitochondria in autolysosome, the white arrow indicates the normal mitochondria, and the red arrow indicates lysosome. Scale bar: 1 μm, scale bar in enlarged panels: 0.5 μm. The graphs on the right indicate statistical analysis of the percentage of mitophagosome/all mitochondria. Data are presented as means ± S.D. **p < 0.01 (n = 3 independent experiments).
Fig. 5
Fig. 5. MitoQC-based analysis.
ad Fluorescent microscopy of the pmCherry-GFP-FIS1101-152 tandem reporter in Spata33 knockout (spata33−/−, #33), Spata33 overexpression (spata33+/+), and wild-type GC-1 cell lines. The cells were transfected with the pmCherry-GFP-FIS1101-152 and cultured in normal (control), CCCP (10 μM, 1 h), EBSS medium (1 h) or EBSS with CCCP (10 μM, 1 h) addition, respectively. Single channel (red, green, or blue) and merged images were taken by confocal microscopy. The insets showed an enlarged view of the indicated squares. Scale bar: 10 μm. e Schematic diagram of MitoQC-based analysis principle. pmCherry-GFP-FIS1101-152 tandem reporter expresses a tandem mCherry-GFP tag fused to the mitochondrial outer membrane protein FIS1, MitoQC displays red and green fluorescence during steady-state conditions, but the mCherry signals become stable when mitophagy is induced, because mitochondria are delivered to the lysosome where the GFP signals are quenched. Therefore, mCherry-only puncta are seen during mitophagy activation. f Statistical analysis of vesicles positive for mCherry puncta (mitolysosome) (>15 cells per experiment) by t-test in the (ad). The mean ± SD are from three independent experiments. *p < 0.05; **p < 0.01.
Fig. 6
Fig. 6. SPATA33-associated autophagy flux.
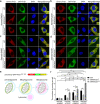
ad The pmCherry-GFP-LC3B tandem reporter analysis in Spata33 knockout (Spata33−/−, #33), SPATA33 rescued (stably expressing SPATA33 in Spata33−/− cell lines), SPATA33-N rescued (stably expressing SPATA33-N in Spata33−/− cell lines), SPATA33-C rescued (stably expressing SPATA33-C in Spata33−/− cell lines), and wild-type GC-1 cell lines. Representative images of the cells transfected with the pmCherry-GFP-LC3B reporter and cultured in normal (control), bafilomycin A1 (100 nM) addition (1 h), EBSS medium (1 h), or EBSS with bafilomycin A1 (100 nM) addition (1 h), respectively. Single channel (red, green or blue) and merged images were taken by confocal microscopy. Scale bar: 25 μm, scale bar in enlarged panels: 5 μm. e–h Statistical analysis of vesicles positive for both GFP and mCherry (autophagosomes) and for mCherry (autolysosomes) (>15 cells per experiment) by t-test in the (ad), respectively. The mean ± SD are from three independent experiments. *p < 0.05; **p < 0.01. i Determination of effectively rescuing of SPATA33-N and SPATA33-C. Endogenous SPATA33, FLAG-SPATA33, FLAG-SPATA33-N, and FLAG-SPATA33-C protein levels were analyzed by western blotting.
Fig. 7
Fig. 7. SPATA33 interaction with ATG16L1 and VDAC2.
a, b Coimmunoprecipitation between VDAC2 and deletion mutants of SPATA33. pCherry-FLAG-ATG16L1 was transiently co-transfected with pGFP-SPATA33, pGFP-N-SPATA33, or pGFP-C-SPATA33 in HEK293T cells, respectively. Cell lysates were examined by western blotting using the anti-FLAG or anti-GFP antibody. For coimmunoprecipitation, the lysates were immunoprecipitated with anti-FLAG or anti-GFP, followed by immunoblotting with the anti-GFP or anti-FLAG antibody. Arrowheads indicate the target bands. c, d Coimmunoprecipitation between ATG16L1 and deletion mutants of SPATA33. p3xFLAG-VDAC2 was transiently co-transfected with pGFP-SPATA33, pGFP-N-SPATA33, or pGFP-C-SPATA33 in HEK293T cells, respectively. Cell lysates were examined by western blotting using the anti-FLAG or anti-GFP antibody. For coimmunoprecipitation, the lysates were immunoprecipitated with anti-FLAG or anti-GFP, followed by immunoblotting with the anti-GFP or anti-FLAG antibody. Arrowheads indicate the target bands. e Coimmunoprecipitation analysis of interaction among endogenous SPATA33, ATG16L1, and VDAC2 in GC-1 cells. The GC-1 cell lysates were immunoprecipitated with anti-SPATA33, anti-ATG16L1, or anti-VDAC2 antibody, followed by immunoblotting with the anti-SPATA33, anti-VDAC2, or anti-ATG16L1 antibody, respectively. The whole cell lysates were examined by western blotting using the anti-ATG16L1, anti-VDAC2, or anti-SPATA33 antibody. Arrowheads indicate the target bands. f Colocalization analysis of SPATA33 with VDAC2 and ATG16L1. GC-1 cells were transiently co-transfected with pCherry-SPATA33 and pGFP-VDAC2. After 24 h in normal medium, the cells were cultured in normal (control), CCCP (10 μM, 1 h), EBSS medium (1 h), or EBSS with CCCP (10 μM, 1 h) addition, respectively. Immunofluorescence analysis was performed with anti-ATG16L1 and Dylight 405 Donkey anti-Rabbit IgG (H + L) antibodies. Single channel (red, green, or blue) and merged images were taken by confocal microscopy. Colocalizing structures are indicated in white (merge). Scale bar: 25 μm. g Statistical analysis of colocalized puncta between SPATA33, ATG16L1, and VDAC2. Data are presented as means ± S.D. **p < 0.01 (n = 3 independent experiments, >15 cells per experiment). h SPATA33 mediates mitophagy via interaction with VDAC2 and ATG16L1. SPATA33 interacts with mitochondrial outer membrane protein VDAC2 through its carboxyl terminal, while its amino terminal interacts with WD40 region of ATG16L1 protein. Upon starvation stress, damaged mitochondria are encapsulated by autophagosome through mediator SPATA33 linking between VDAC2 and ATG16L1 to initiate mitophagy.

Comment in

Similar articles

Cited by

References

    1. Hermo L, Pelletier RM, Cyr DG, Smith CE. Surfing the wave, cycle, life history, and genes/proteins expressed by testicular germ cells. Part 1: background to spermatogenesis, spermatogonia, and spermatocytes. Microsc Res Tech. 2010;73:241–78. - PubMed
    1. Gao H, Khawar MB, Li W. Essential role of autophagy in resource allocation during sexual reproduction. Autophagy. 2020;16:18–27. - PMC - PubMed
    1. Da Ros M, Lehtiniemi T, Olotu O, Fischer D, Zhang FP, Vihinen H, et al. FYCO1 and autophagy control the integrity of the haploid male germ cell-specific RNP granules. Autophagy. 2017;13:302–21. - PMC - PubMed
    1. Youle RJ, Narendra DP. Mechanisms of mitophagy. Nat Rev Mol Cell Biol. 2011;12:9–14. - PMC - PubMed
    1. Liu J, Liu W, Li R, Yang H. Mitophagy in parkinson’s disease: from pathogenesis to treatment. Cells. 2019;8:712. - PMC - PubMed

Publication types

Substances