. 2020 Nov;17(11):1156-1166.
doi: 10.1038/s41592-020-00981-9. Epub 2020 Oct 21.

Next-generation GRAB sensors for monitoring dopaminergic activity in vivo

Affiliations

Next-generation GRAB sensors for monitoring dopaminergic activity in vivo

Fangmiao Sun et al. Nat Methods. 2020 Nov.

Abstract

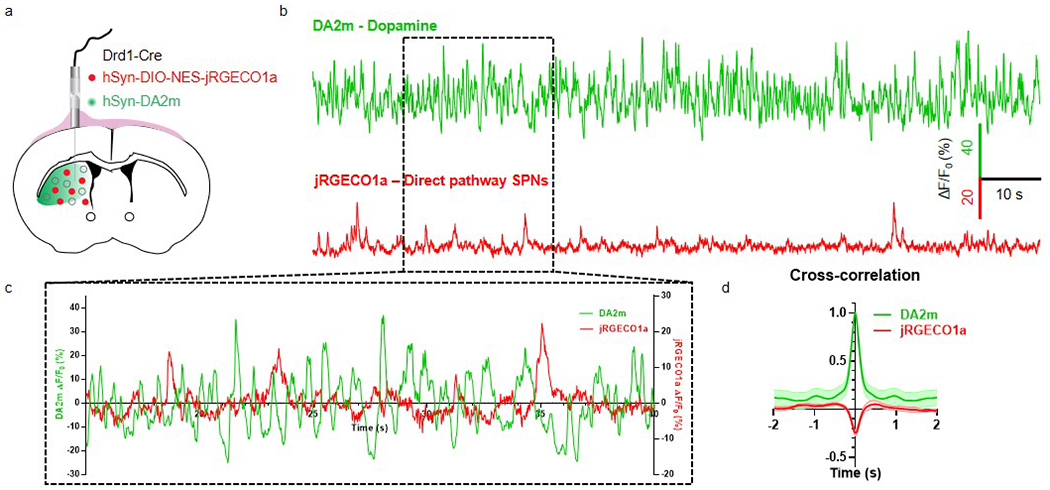
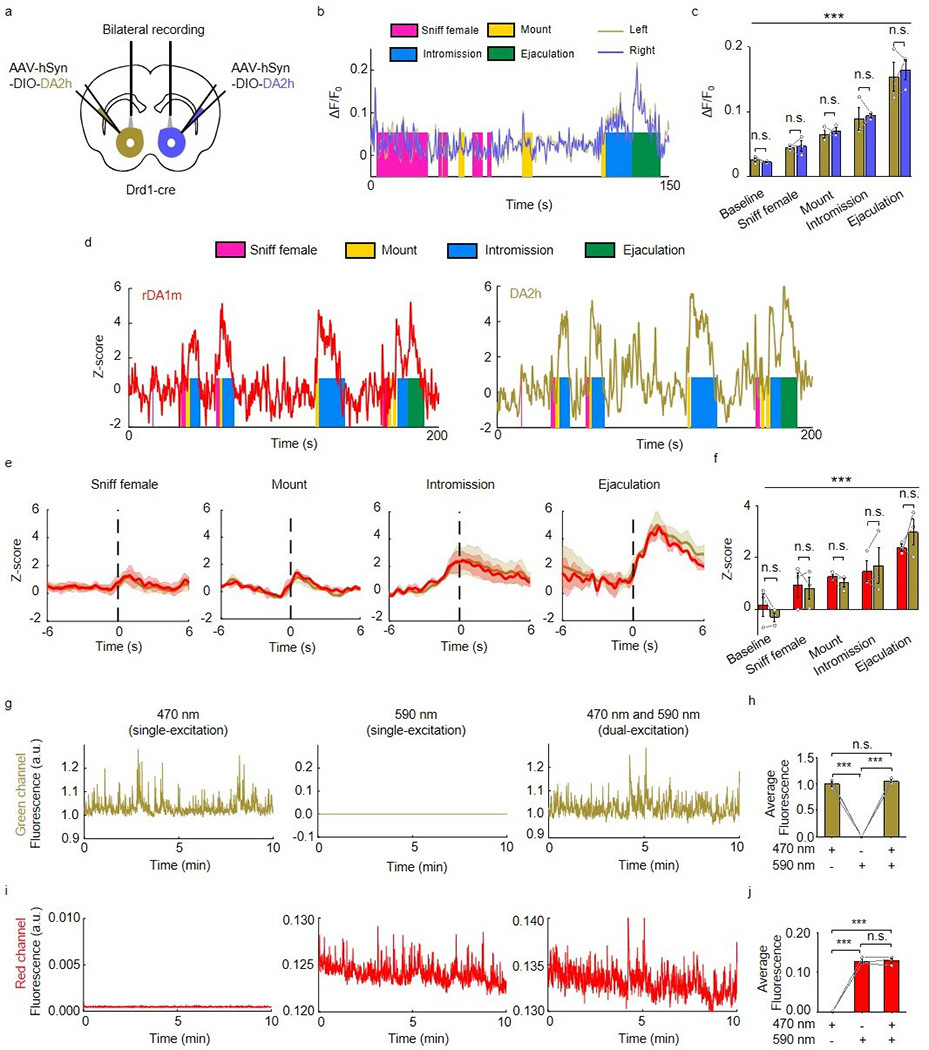
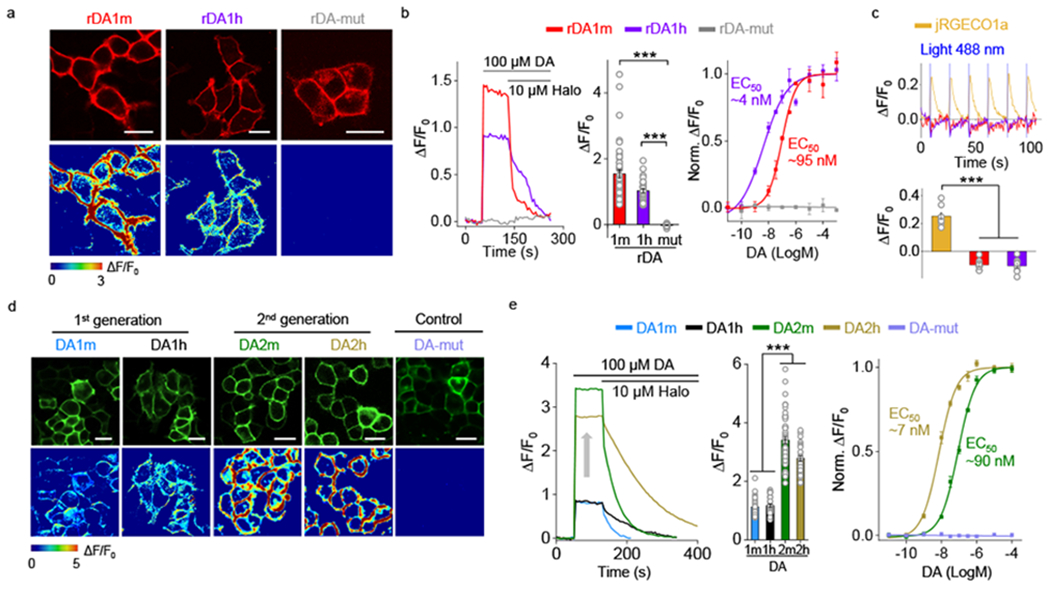
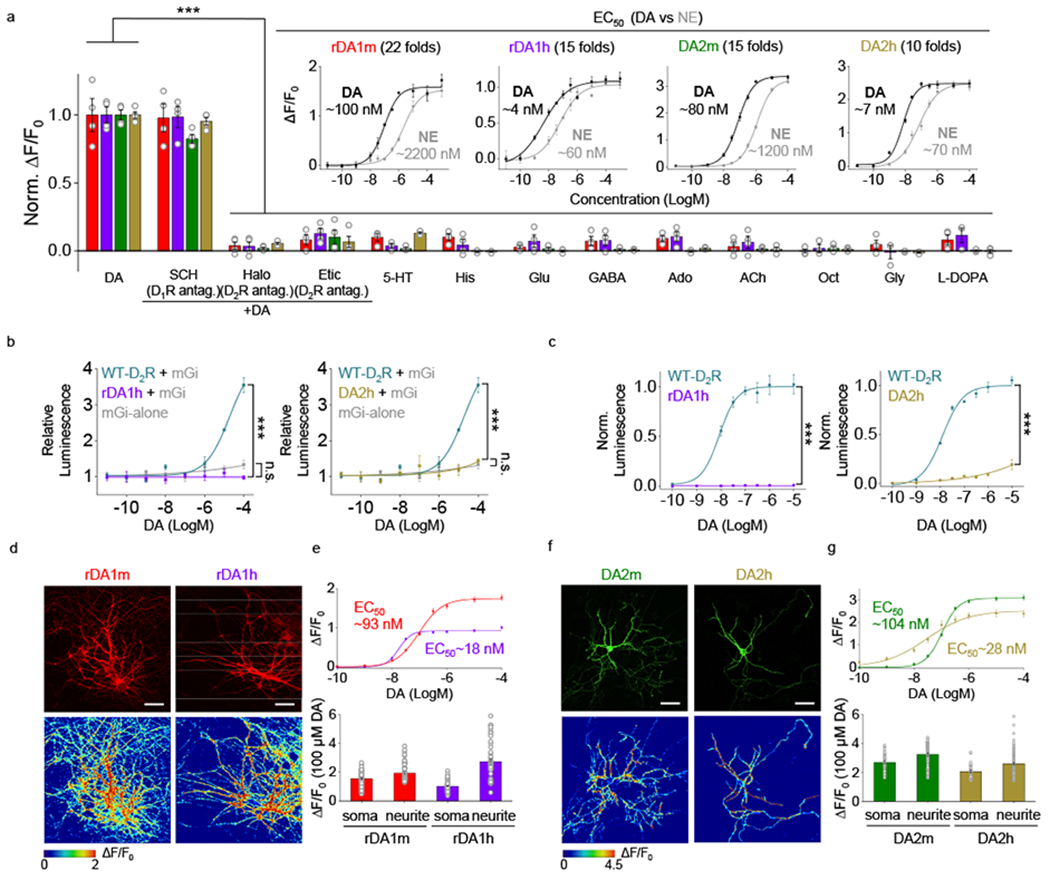
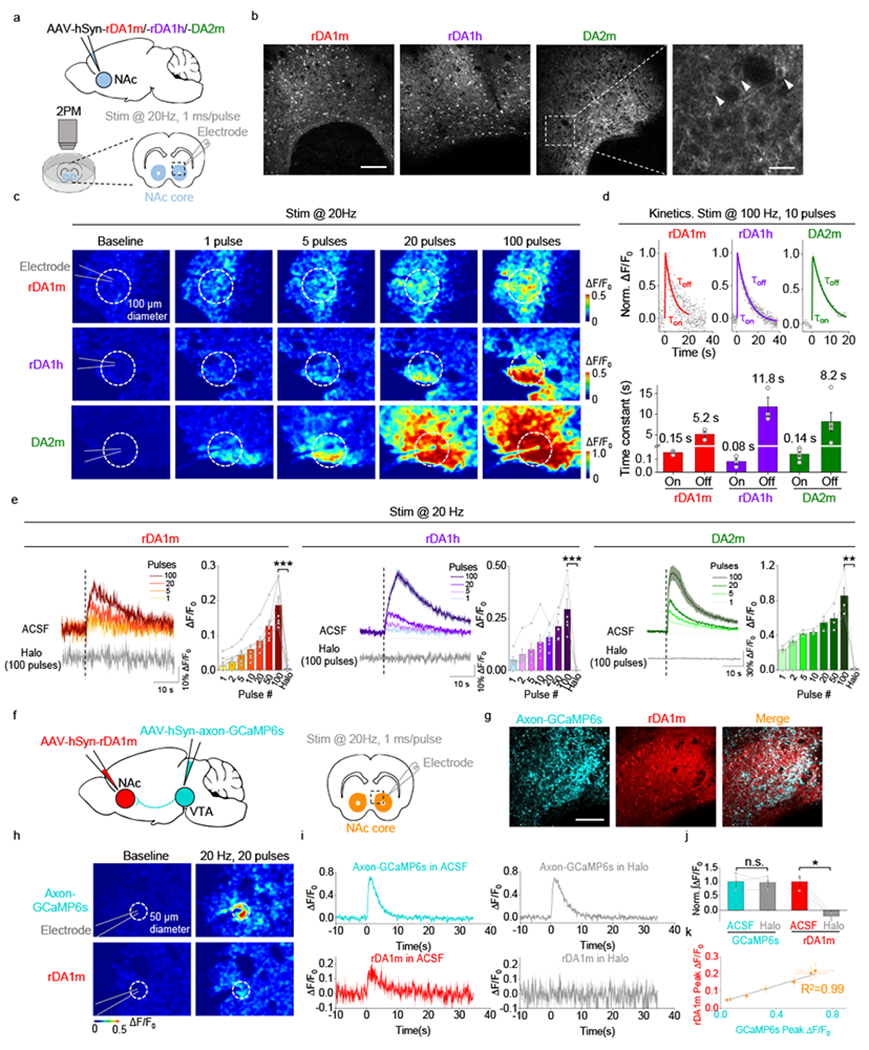
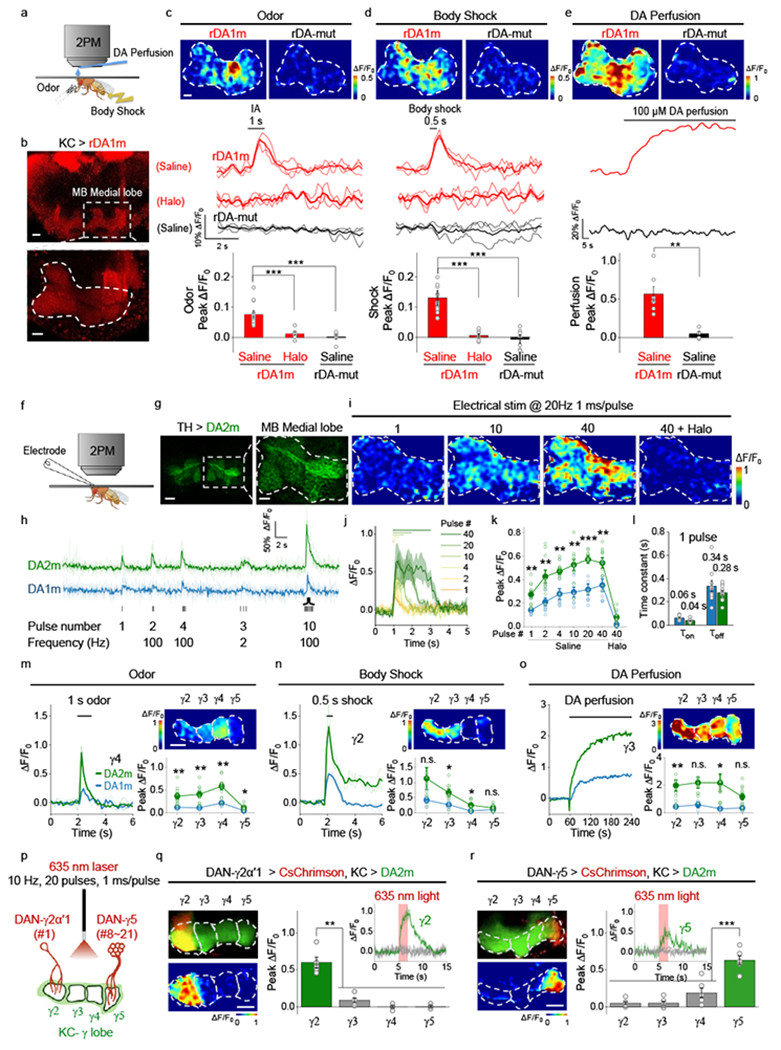
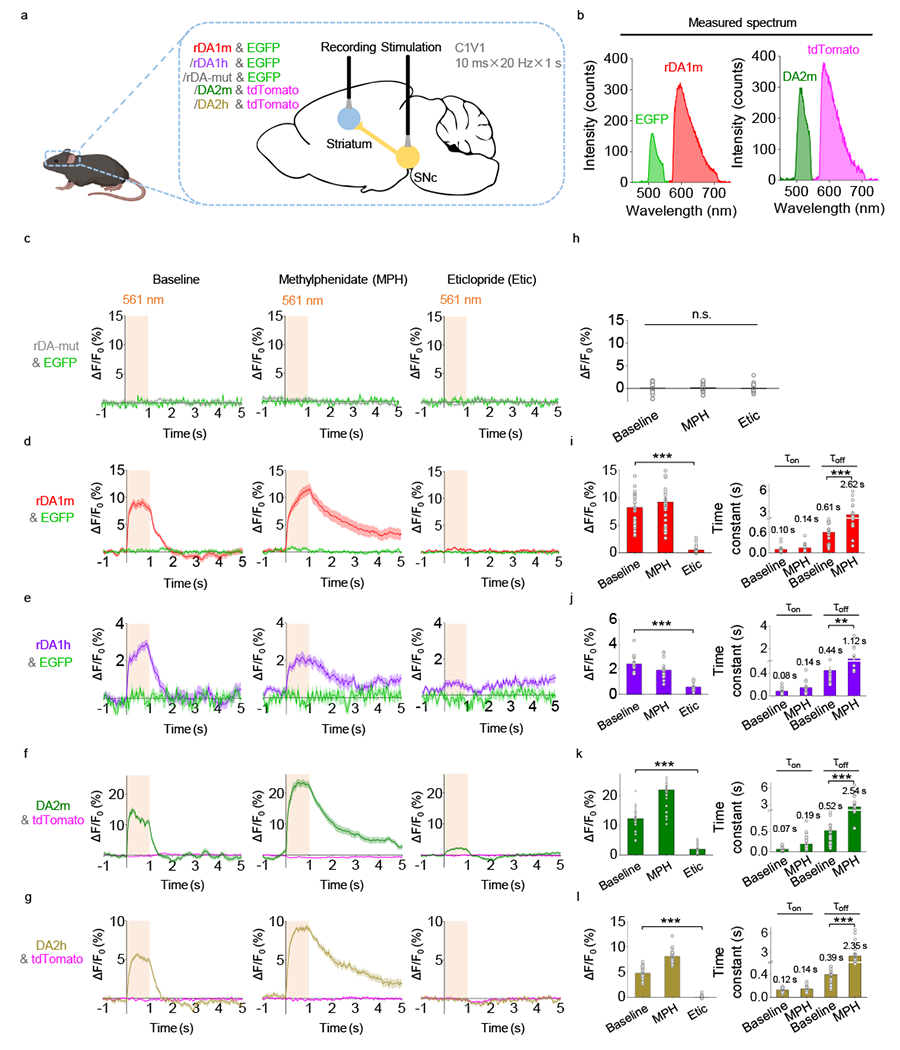
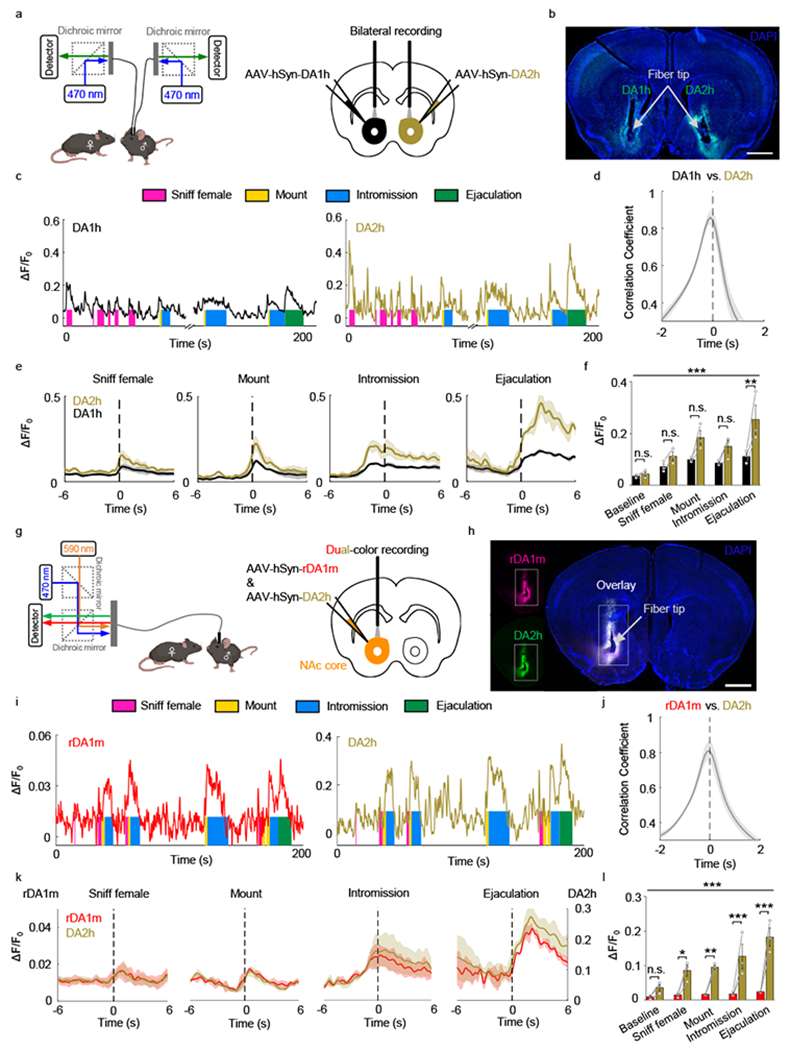
Dopamine (DA) plays a critical role in the brain, and the ability to directly measure dopaminergic activity is essential for understanding its physiological functions. We therefore developed red fluorescent G-protein-coupled receptor-activation-based DA (GRABDA) sensors and optimized versions of green fluorescent GRABDA sensors. In response to extracellular DA, both the red and green GRABDA sensors exhibit a large increase in fluorescence, with subcellular resolution, subsecond kinetics and nanomolar-to-submicromolar affinity. Moreover, the GRABDA sensors resolve evoked DA release in mouse brain slices, detect evoked compartmental DA release from a single neuron in live flies and report optogenetically elicited nigrostriatal DA release as well as mesoaccumbens dopaminergic activity during sexual behavior in freely behaving mice. Coexpressing red GRABDA with either green GRABDA or the calcium indicator GCaMP6s allows tracking of dopaminergic signaling and neuronal activity in distinct circuits in vivo.


Conflict of interest statement

Competing interests

F.S. and Y. L. have filed patent applications whose value might be affected by this publication.

Figures

Extended Data Fig. 1
Extended Data Fig. 1. The development of red fluorescent DA sensors and second-generation green fluorescent DA sensors.
a, Schematic illustration showing the design and optimization of the red fluorescent GRABDA sensors. b, The response to 100 μM DA measured for red fluorescent DA sensor variants during steps 1‒3. The variant with the highest fluorescence change (named rDA0.5) was then sequentially mutated as shown to generate rDA1m, rDA1h, and rDA-mut. c, Schematic illustration showing the design and optimization of the green fluorescent GRABDA sensors. d, Normalized ΔF/F0 in response to 100 μM DA measured for green fluorescent DA sensor variants, normalized to the first-generation DA1h sensor. DA2h was then mutated as shown to generate DA2m and DA-mut. The superscripts in the insets of b,d are based on the Ballesteros–Weinstein numbering scheme, indicating the mutation sites in the D2R.
Extended Data Fig. 2
Extended Data Fig. 2. The sequences of GRABDA sensors and the residues related to affinity-tuning, cpRFP and cpEGFP optimization.
a,b, The sequences of rGRABDA1m (a) and GRABDA2m (b). The residues related to affinity-tuning, cpRFP (a) and cpEGFP (b) optimization are marked. T2055.54M was introduced to rDA1m and DA2m to generate rDA1h and DA2h, respectively.
Extended Data Fig. 3
Extended Data Fig. 3. Characterization of the sensors in HEK293T cells.
a,b, Schematic illustration showing the local perfusion system. Scale bars, 10 μm. c,d, Representative traces showing the response to DA (left) and subsequent addition of Halo (right). The traces were the average of 3 different regions of interest (ROIs) on the scanning line, shaded with ± s.e.m.. Each trace was fitted with a single-exponential function to determine τon (left) and τoff (right). Similar results were observed for 7-10 cells. e,f, Group summary of τon and τoff. n=10, 7, 9, 8, 10, 8, 10, 8 cells for rDA1m (τon), rDA1m (τoff), rDA1h (τon), rDA1h (τoff), DA2m (τon), DA2m (τoff), DA2h (τon), DA2h (τoff). g-i, Excitation and emission spectra for the indicated sensors in the absence and presence of DA. j, Photostability of rDA1m and rDA1h (in the presence of 100 μM DA) and the indicated fluorescent proteins was measured using 1-photon and 2-photon microscopy. Each photobleaching curve was fitted to a single-exponential function to determine the time constant. 1-photon, n=12 cells each. 2-photon, n=10, 10, 9, 10 cells for rDA1m, rDA1h, jRGECO1a, tdTomato. Two-tailed Student’s t-test was performed. 1-photon, p=0.9755 (n.s.) between rDA1m and rDA1h; p=2.72×10⁻⁵ (***) between rDA1m and mCherry; p=7.10×10⁻⁹ (***) between rDA1m and mRuby3; p=7.90×10⁻¹⁰ (***) between rDA1m and tdTomato; p=1.95×10⁻⁹ (***) between rDA1m and mScarlet; p=1.28×10⁻⁵ (***) between rDA1h and mCherry; p=2.50×10⁻⁹ (***) between rDA1h and mRuby3; p=2.66×10⁻¹⁰ (***) between rDA1h and tdTomato; p=6.75×10⁻¹⁰ (***) between rDA1h and mScarlet. 2-photon, p=0.0963 (n.s.) between rDA1m and rDA1h; p=0.0511 (n.s.) between rDA1m and jRGECO1a; p=0.0139 (*) between rDA1h and jRGECO1a; p=2.82×10⁻¹¹ (***) between rDA1m and tdTomato; p=1.71×10⁻¹⁰ (***) between rDA1h and tdTomato; p=2.96×10⁻⁶ (***) between jRGECO1a and tdTomato. Data are presented as the mean ± s.e.m. in e, f, j (bar graph).
Extended Data Fig. 4
Extended Data Fig. 4. The response of GRABDA sensors to different compounds.
a, The normalized dose-response curves for DA and NE in sensor-expressing HEK293T cells. n=3 wells with 200–800 cells/well. b, The ΔF/F0 in sensor-expressing cells in response to the indicated compounds applied at 1 μM. n=3 wells for rDA1h in response to NE, 5-HT, Oct, Gly and L-DOPA. n=4 wells for the others. Each well contains 200-1200 cells. Data are presented as the mean ± s.e.m.. Data replotted from Fig. 2a.
Extended Data Fig. 5
Extended Data Fig. 5. The minimal coupling of GRABDA sensors to downstream Gi pathway and β-arrestin pathway.
a,b, Normalized ΔF/F0 in sensor-expressing cells in response to DA, with or without the pre-bathing of GTPγS. n=3 wells with 500–3000 cells/well. c,d, The representative trace of ΔF/F0 (c) and the group summary of normalized ΔF/F0 (d) in rDA1m-expressing neurons during a 2-hour treatment of 100 μM DA. n=9 neurons. For the group summary, the averaged ΔF/F0 of each neuron during the 2-hour DA treatment is normalized to 1. Two-tailed Student’s t-test was performed. p=2.10×10⁻²¹ (***) between baseline and 0 min; p=2.99×10⁻¹⁷ (***) between 120 min and Halo; p=1.24×10⁻⁵ (***) between 0 min and 120 min. e,f, Similar to c and d except that rDA1h was expressed in cultured neurons. n=11 neurons. Two-tailed Student’s t-test was performed. p=1.87×10⁻⁶ (***) between baseline and 0 min; p=3.43×10⁻¹⁷ (***) between 120 min and Halo; p=0.1519 (n.s.) between 0 min and 120 min. g,h, Similar to c and d except that DA2m was expressed in cultured neurons. n=15 neurons. Two-tailed Student’s t-test was performed. p=2.48×10−39 (***) between baseline and 0 min; p=7.42×10⁻³⁵ (***) between 120 min and Halo; p=0.3322 (n.s.) between 0 min and 120 min. i,j, Similar to c and d except that DA2h was expressed in cultured neurons. n=17 neurons. Two-tailed Student’s t-test was performed. p=1.14×10−52 (***) between baseline and 0 min; p=9.80×10−38 (***) between 120 min and Halo; p=0.0061 (**) between 0 min and 120 min. k, Top, schematic illustration depicting the in vivo perfusion experiment. Bottom, the fluorescence image of a transgenic fly expressing DA2m in MB KCs. Scale bar, 50 μm. l,m, Representative images (l, top), trace (l, bottom) and group summary (m) of ΔF/F0 in response to the 1-hour perfusion of 1 mM DA followed by 100 μM Halo in a transgenic fly expressing DA2m in MB KCs. n=3 flies. Scale bar, 25 μm. Two-tailed Student’s t-test was performed. p=0.0382 (*) between baseline and 10 min; p=0.0293 (*) between 60 min and Halo; p=0.5289 (n.s.), 0.5593 (n.s.), 0.9559 (n.s.), 0.8537 (n.s.), 0.6346 (n.s.), 0.6530 (n.s.), 0.2760 (n.s.), 0.1649 (n.s.), 0.1547 (n.s.), 0.1152 (n.s.), 0.1044 (n.s.) between 5 min and 10 min, 15 min, 20 min, 25 min, 30 min, 35 min, 40 min, 45 min, 50 min, 55 min, 60 min, respectively. Data are presented as the mean ± s.e.m.. in a, b, d, f, h, j, m.
Extended Data Fig. 6
Extended Data Fig. 6. Comparison between dLight and GRABDA.
a, Representative bright-field and fluorescence images acquired before (baseline) and after application of DA in sensor-expressing HEK293T cells. Similar results were observed for more than 20 cells. Scale bar, 50 μm. b, Representative traces of ΔF/F0 in response to 100 μM DA followed by either 10 μM SCH or 10 μM Halo. Similar results were observed for more than 30 cells. c, Normalized dose-response curves. n=3 wells with 100–500 cells/well. d-f, Group summary of the peak ΔF/F0 (d), relative brightness (green/red ratio, GR ratio) (e), and signal-to-noise ratio (SNR) (f) in response to 100 μM DA. d, n=73, 62, 61, 20 cells for dLight1.1, dLight1.2, DA2m, dLight1.3b. e, n=77, 66, 20, 60 cells for dLight1.1, dLight1.2, dLight1.3b, DA2m. f, n=74, 63, 61 cells for dLight1.1, dLight1.2, DA2m. Two-tailed Student’s t-test was performed. d, p=2.10×10−48 (***) between dLight1.1 and DA2m; p=1.31×10⁻¹² (***) between dLight1.2 and DA2m; p=1.22×10⁻¹⁰ (***) between dLight1.3 and DA2m. f, p=4.09×10⁻²² (***) between dLight1.1 and DA2m; p=1.13×10⁻³³ (***) between dLight1.2 and DA2m. g-i, Dose-response curves (g), relative brightness (h), and fold change of SNR (i) for dLight1.3b and DA2m. n=20 cells each. j-m, Similar to a-f, except that dLight1.1 and DA2m were expressed in cultured neurons. m, left, n=30, 28 cells for dLight1.1, DA2m. m, right, n=30 cells each. Scale bar, 50 μm. Two-tailed Student’s t-test was performed. m, left, p=4.43×10⁻⁸ (***); right, p=3.59×10⁻⁸ (***). n, Schematic illustration depicting the location of the Drosophila olfactory mushroom body (MB). o, Fluorescence images of the MB using 2-photon microscopy at the indicated laser power settings. Enhanced-contrast images at 15% laser power are shown. Fluorescence is shown in grayscale, with saturated pixels shown in red. Similar results were observed for 4-5 flies. Scale bars, 10 μm. p-r, Representative traces (top) and group summary of relative brightness during odorant application (p), body shock (q), and DA perfusion (r). p,r, n=5 flies each. q, n=5, 4 flies for DA2m, dLight1.3b. Average traces (bold) overlaid with single-trial traces (light) from one fly are shown for representation in p, q. Data are presented as the mean ± s.e.m. in c, d, e, f, g, h, i, l, m, p, q, r.
Extended Data Fig. 7
Extended Data Fig. 7. Expressing GRABDA2m or GRABrDA1m sensors shows no significant effect on cAMP or calcium signaling respectively in vivo.
a, Schematic illustration depicting the experimental setup. b-e, Schematic illustrations depicting the experimental strategy (b,d), representative fluorescence images and ΔF/F0 traces (c,e) in flies expressing the cAMP sensor Pink-Flamindo (b,c) or co-expressing Pink-Flamindo and DA2m (d,e) in MB KCs. The ROIs for measuring the γ2-γ3 compartments in the MB are indicated by dashed white lines. Scale bars, 25 μm. f, Group summary of peak ΔF/F0. n=9, 7 flies for Pink Flamindo alone, Pink Flamindo & DA2m. Two-tailed Student’s t-test was performed. p= 0.7332 (n.s.). g-j, Schematic illustrations depicting the experimental strategy (g,i), representative fluorescence images and ΔF/F0 traces (h,j) in flies expressing the calcium sensor GCaMP5 (g,h) or co-expressing GCaMP5 and rDA1m (i,j) in MB KCs. The ROIs for measuring the MB media lobe are indicated by dashed white lines. Similar results were observed for 7 flies. Scale bars, 25 μm. k,l, Group summary of GCaMP5 peak ΔF/F0 and time constants. n=7 flies each. Two-tailed Student’s t-test was performed. k, p=0.607 (n.s.). l, p=0.601 (n.s.), 0.735 (n.s.) for τon, τoff. Average traces (bold) overlaid with single-trial traces (light) from one fly are shown for representation in c, e, h, j. Data are presented as the mean ± s.e.m. in f, k, l.
Extended Data Fig. 8
Extended Data Fig. 8. Optogenetically induced nigrostriatal DA release in freely moving mice is not affected by desipramine or yohimbine.
a-c, Average traces of ΔF/F0 in mice expressing rDA1m and EGFP (a), rDA1h and EGFP (b), or DA2h and tdTomato (c) in the dorsal striatum. Where indicated, the experiments were conducted in mice treated with either the norepinephrine transporter blocker desipramine or the α2AR antagonist yohimbine. d-f, Group summary of ΔF/F0 and τoff for the experiments shown in a-c, respectively. n=30 trials from 6 hemispheres of 6 mice for rDA1m. n=15 trials from 3 hemispheres of 3 mice for rDA1h, n=25 trials from 5 hemispheres of 4 mice for DA2h. Two-tailed Student’s t-test was performed. d, left, p=0.1614 (n.s.); right, p=0.9836 (n.s.). e, left, p=0.9018 (n.s.); right, p=0.6605 (n.s.). f, left, p=0.6489 (n.s.); right, p=0.2322 (n.s.). Average traces shaded with ± s.e.m. are shown in a-c. Data are presented as the mean ± s.e.m. in d-f.
Extended Data Fig. 9
Extended Data Fig. 9. Dual-color recording of DA dynamics and striatal neural activity using DA2m and jRGECO1a in freely moving mice.
a, Schematic illustration depicting the experimental strategy. b, Representative traces showing the fluorescence responses of DA2m and jRGECO1a. c, The zoom-in traces from b during a 25 s recording. d, The cross-correlation between the fluorescence responses of DA2m and jRGECO1a during a 2 min recording. n=8 hemispheres of 5 mice. Average traces shaded with ± s.e.m. are shown.
Extended Data Fig. 10
Extended Data Fig. 10. The DA signal in the mouse NAc during sexual behavior.
a, Schematic illustration depicting the experimental strategy. b,c, Representative traces (b) and group summary (c) of ΔF/F0 measured from left and right hemispheres during the indicated stages of mating. n=3 mice. F4,16=80.92, p<10−6 (***) for row factor and F1,4=0.1224, p=0.7441 (n.s.) for column factor by two-way ANOVA. Bonferroni’s multiple comparisons test was performed between groups, p>0.9999 (n.s.), p>0.9999 (n.s.), p>0.9999 (n.s.), p>0.9999 (n.s.), p>0.9999 (n.s.). d, Representative traces of the concurrent Z-score signals of rDA1m and DA2h during the indicated stages of sexual behavior. Similar results were observed for 3 mice. e, Average post-stimulus histograms showing the Z-score signals of rDA1m and DA2h aligned to the onset of the indicated mating events. n=3 mice. Average traces shaded with ± s.e.m. are shown. f, Group summary of the Z-scores measured for rDA1m and DA2h during the indicated mating events. n=3 mice. F4,16=13.02, p=6.6×10⁻⁵ (***) for row factor and F1,4=0.001, p=0.9797 (n.s.) for column factor by two-way ANOVA. Bonferroni’s multiple comparisons test was performed, p>0.99 (n.s.), p>0.99 (n.s.), p>0.99 (n.s.), p>0.99 (n.s.), p>0.99 (n.s.). g, h, The representative fluorescence signal (g) and group analysis (h) in the green channel when the excitation light is delivered at 470 nm alone (g, left), at 590 nm alone (g, center) or at 470 nm and 590 nm simultaneously (g, right). n=3 mice. F2,4=531.6, p=3.1×10⁻⁵ (***) by one-way ANOVA. Tukey’s multiple comparisons test was performed between groups, p=3.1×10⁻⁵ (***), p=2.6×10⁻⁵ (***), p=0.4904 (n.s.). i, j, Similar to g and h except the fluorescence signal in the red channel is analyzed. n=3 mice. F2,4=414.2, p=2.3×10⁻⁵ (***) by one-way ANOVA. Tukey’s multiple comparisons test was performed between groups, p=4.8×10⁻⁵ (***), p=4.6×10⁻⁵ (***), p=0.9738 (n.s.). Data are presented as the mean ± s.e.m. in c, f, h, j.
Fig. 1 |
Fig. 1 |. Development of red fluorescent DA sensors and second-generation green fluorescent DA sensors.
a, Representative images of sensor expression (top) and response to 100 μM DA (bottom) in HEK293T cells expressing the indicated sensor variants. Similar results were observed for more than 10 cells. Scale bars, 20 μm. b, Representative traces (left), group summary of peak ΔF/F0 in response 100 μM DA (center), and normalized dose-response curves (right) in response to DA. Center, n=46, 32, 17 cells for rDA1m, rDA1h, rDA-mut. Right, n=3 wells with 200–400 cells/well. Two-tailed Student’s t-test was performed. p=3.52×10⁻¹⁰ (***) between rDA1m and rDA-mut; p=4.79×10⁻¹⁸ (***) between rDA1h and rDA-mut. c, Representative traces (top) and group summary of ΔF/F0 in response to blue light in cells expressing jRGECO1a, rDA1m, or rDA1h. Bottom, n=8, 9, 8 cells for jRGECO1a, rDA1m, rDA1h. Two-tailed Student’s t-test was performed. p=1.23×10⁻⁹ (***) between jRGECO1a and rDA1m; p=1.56×10⁻⁸ (***) between jRGECO1a and rDA1h. d, Representative images of sensor expression (top) and response to 100 μM DA (bottom) in HEK293T cells expressing the indicated sensor variants. Similar results were observed for more than 20 cells. Scale bars, 20 μm. e, Representative traces (left), group summary of peak ΔF/F0 in response 100 μM DA (center), and normalized dose-response curves in response to DA (right). Center, n=66, 36, 52, 33 cells for DA1m, DA1h, DA2m, DA2h. Right, n=3 wells with 200–500 cells/well. Two-tailed Student’s t-test was performed. p=2.15×10−41 (***) between DA1m and DA2m; p=8.34×10−39 (***) between DA1m and DA2h; p=9.90×10⁻²⁶ (***) between DA1h and DA2m; p=4.66×10⁻²⁴ (***) between DA1h and DA2h. Data are presented as the mean ± s.e.m. in b (center and right), c (bottom), e (center and right).
Fig. 2 |
Fig. 2 |. Characterization of GRABDA sensors in HEK293T cells and cultured rat cortical neurons.
a, Normalized ΔF/F0 in sensor-expressing HEK293T cells following the application of DA alone, DA+SCH-23390 (SCH), DA+haloperidol (Halo), DA+eticlopride (Etic), serotonin (5-HT), histamine (His), glutamate (Glu), gamma-aminobutyric acid (GABA), adenosine (Ado), acetylcholine (ACh), octopamine (Oct), glycine (Gly), or L-DOPA (all applied at 1 μM). n=3 wells for rDA1h in response to 5-HT, Oct, Gly and L-DOPA. n=4 wells for the others. Each well contains 200-1200 cells. The insets show dose-response curves for DA and norepinephrine (NE); n=3 wells with 200–800 cells/well each. Two-tailed Student’s t-test was performed. rDA1m, p=0.8816 (n.s.), 0.0001 (***), 0.0002 (***), 0.0002 (***), 0.0002 (***), 8.94×10⁻⁵ (***), 0.0001 (***), 0.0001 (***), 0.0001 (***), 7.65×10⁻⁵ (***), 0.0001 (***), 0.0002 (***) between DA and DA+SCH, DA+Halo, DA+Etic, 5-HT, His, Glu, GABA, Ado, ACh, Oct, Gly, L-DOPA, respectively. rDA1h, p=0.8648 (n.s.), 4.12×10⁻⁶ (***), 7.94×10⁻⁶ (***), 2.34×10⁻⁵ (***), 5.13×10⁻⁶ (***), 7.89×10⁻⁶ (***), 5.77×10⁻⁶ (***), 6.37×10⁻⁶ (***), 7.45×10⁻⁶ (***), 2.63×10⁻⁵ (***), 3.86×10⁻⁵ (***), 8.60×10⁻⁵ (***) between DA and DA+SCH, DA+Halo, DA+Etic, 5-HT, His, Glu, GABA, Ado, ACh, Oct, Gly, L-DOPA, respectively. DA2m, p=0.0105 (*), 1.99×10⁻⁷ (***), 7.18×10⁻⁶ (***), 1.92×10⁻⁷ (***), 1.54×10⁻⁷ (***), 2.00×10⁻⁷ (***), 1.77×10⁻⁷ (***), 1.55×10⁻⁷ (***), 1.80×10⁻⁷ (***), 2.46×10⁻⁷ (***), 1.50×10⁻⁷ (***), 1.62×10⁻⁷ (***) between DA and DA+SCH, DA+Halo, DA+Etic, 5-HT, His, Glu, GABA, Ado, ACh, Oct, Gly, L-DOPA, respectively. DA2h, p=0.2613 (n.s.), 2.90×10⁻⁸ (***), 1.15×10⁻⁶ (***), 4.20×10⁻⁸ (***), 1.50×10⁻⁸ (***), 1.83×10⁻⁸ (***), 1.61×10⁻⁸ (***), 1.80×10⁻⁸ (***), 3.51×10⁻⁸ (***), 1.87×10⁻⁸ (***), 1.46×10⁻⁸ (***), 2.83×10⁻⁸ (***) between DA and DA+SCH, DA+Halo, DA+Etic, 5-HT, His, Glu, GABA, Ado, ACh, Oct, Gly, L-DOPA, respectively. b, Luciferase complementation assay for assessing Gi coupling. n=3 wells each. The luminescence signals are normalized against the luminescence signals measured in the control buffer-treated cells. Cells expressing mGi alone serve as the control. Two-tailed Student’s t-test was performed. p=9.87×10⁻⁵ (***) between rDA1h and WT-D2R; p=0.1124 (n.s.) between rDA1h and mGi-alone; p=0.0001 (***) between DA2h and WT-D2R; p=0.2836 (n.s.) between DA2h and mGi-alone. c, TANGO assay for measuring β-arrestin coupling. n=3 wells each. The maximum luminescence signals of WT-D2R are normalized to 1. Two-tailed Student’s t-test was performed. p=0.0004 (***) between rDA1h and WT-D2R; p=0.0001 (***) between DA2h and WT-D2R. d, Representative images of sensor expression (top) and response to 100 μM DA (bottom) in neurons expressing the indicated sensors. Similar results were observed for more than 30 neurons. Scale bars, 10 μm. e, Dose-response curves (top) and group summary (bottom) of the responses measured in the soma and neurites of sensor-expressing neurons. Top, n=34, 14 neurons for rDA1m, rDA1h. Bottom, n=59, 68 ROIs from 59 neurons for rDA1m (soma), rDA1m (neurite); n=58, 58 ROIs from 58 neurons for rDA1h (soma), rDA1h (neurite). f, Representative images of sensor expression (top) and response to 100 μM DA (bottom) in neurons expressing the indicated sensors. Similar results were observed for more than 20 neurons. Scale bars, 10 μm. g, Dose-response curves (top) and group summary (bottom) of the responses measured in the soma and neurites of sensor-expressing neurons. Top, n=32, 21 neurons for DA2m and DA2h. Bottom, n=54, 85 ROIs from 54 neurons for DA2m (soma), DA2m (neurite); n=30, 145 ROIs from 30 neurons for DA2h (soma), DA2h (neurite). Data are presented as the mean ± s.e.m. in a, b, c, e, g.
Fig. 3 |
Fig. 3 |. GRABDA sensors can be used to measure DA release in acute mouse brain slices.
a, Schematic illustration depicting the experimental design for panels b-e. b, Representative fluorescence images showing the expression of sensors in the NAc. The arrowheads indicate the somas of individual neurons. Similar results were observed for 3-4 mice. Scale bar, 100 μm (left) and 20 µm (right). c, Responses to electrical stimulation measured in sensor-expressing brain slices. The dashed circles indicate the ROIs used to analyze the signals. d, Representative traces showing the normalized ΔF/F0 (top) and group summary of τon and τoff (bottom) in response to 10 electrical stimuli applied at 100 Hz. The data were processed with 2×binning. Each trace was fitted with a single-exponential function to determine τon and τoff. n=3 slices from 2 mice for rDA1m, n=3 slices from 2 mice for rDA1h, n=5 slices from 3 mice for DA2m. e, Representative traces and group summary of the ΔF/F0 in response to electrical stimulation. n=7 slices from 4 mice for rDA1m, n=6 slices from 4 mice for rDA1h, n=3 slices from 2 mice for DA2m. Two-tailed Student’s t-test was performed. p=2.97×10⁻⁵ (***), 0.0002 (***), 0.0061 (**) for rDA1m, rDA1h, DA2m. f, Schematic illustration depicting the experimental design for panels g-j. g, Representative fluorescence images showing the expression of GCaMP6s and rDA1m in the NAc. Similar results were observed for 3 mice. Scale bar, 100 μm. h, Response images of axon-GCaMP6s and rDA1m following electrical stimulation. The dashed circles indicate the ROIs used to analyze the signals. i-j, Representative traces (i) and group summary (j) of the ΔF/F0 in response to electrical stimulation. n=3 slices from 3 mice. Two-tailed Student’s t-test was performed. p=0.8361 (n.s.), 0.0244 (*) for GCaMP6s, rDA1m. k, The peak ΔF/F0 of rDA1m plotted against the peak ΔF/F0 of axon-GCaMP6s in response to various numbers of pulses applied at 20 Hz. The data were fitted to a linear function. n=8 slices from 3 mice. Average traces shaded with ± s.e.m. from one slice are shown for representation in e, i. Data are presented as the mean ± s.e.m. in d (bottom), e, j, k.
Fig. 4 |
Fig. 4 |. In vivo 2-photon imaging of DA dynamics in Drosophila using GRABDA sensors.
a, Schematic illustration depicting the experimental setup for imaging fluorescence changes in response to various stimuli. b, Representative fluorescence images of rDA1m expressed in Kenyon cells (KCs), with an expanded view of the olfactory mushroom body (MB) medial lobe. Similar results were observed for 15 flies. Scale bars, 20 µm (top) and 10 µm (bottom). c-e, Representative images (top; the dashed area indicates the MB medial lobe), traces (center), and group summary (bottom) of ΔF/F0 in response to odorant (c), body shock (d), and DA perfusion (e). Scale bar, 10 µm. c, n=15, 7, 6 flies for rDA1m (saline), rDA1m (Halo), rDA-mut. d, n=15, 7, 8 flies for rDA1m (saline), rDA1m (Halo), rDA-mut (saline). e, n=7, 5 flies for rDA1m (saline), rDA-mut (saline). Two-tailed Student’s t-test was performed. c, p=0.0002 (***) between rDA1m (saline) and rDA1m (Halo); p=6.70×10⁻⁶ (***) between rDA1m (saline) and rDA-mut (Saline). d, p=5.48×10⁻⁵ (***) between rDA1m (saline) and rDA1m (Halo); p=1.71×10⁻⁶ (***) between rDA1m (saline) and rDA-mut (Saline). e, p=0.0016 (**) between rDA1m (saline) and rDA-mut (Saline). f, Schematic illustration depicting the experimental setup for imaging electrical stimulation–evoked DA release. g, Representative fluorescence images of DA2m expressed in dopaminergic neurons (DANs), with an expanded view of the MB medial lobe. Similar results were observed for 10 flies. Scale bars, 20 μm (left) and 10 μm (right). h, Representative traces of DA2m and DA1m fluorescence; where indicated, electrical stimuli were applied. i,j, Representative images (i) and traces (j) of DA2m ΔF/F0 in response to electrical stimuli. Similar results were observed for 10 flies. k, Group summary of DA2m and DA1m ΔF/F0 in response to electrical stimuli. n=9, 5, 10, 10 flies for DA1m (saline), DA1m (Halo), DA2m (saline), DA2m (Halo). Two-tailed Student’s t-test was performed. p=0.0023 (**), 0.0047 (**), 0.0025 (**), 0.0014 (**), 0.0002 (***), 0.0091 (**) for 1, 2, 4, 10, 20, 40 pulse(s), respectively. l, Kinetics (τon and τoff) of DA2m and DA1m in response to a single electrical stimulus. n=9, 10 flies for DA1m, DA2m. m-o, Representative traces (left), fluorescence images (top right), and group summary (bottom right) of the indicated MB lobe compartments in response to odorant (m), body shock (n), and 1mM DA perfusion (o). m, n= 4, 9 flies for DA1m, DA2m. n, n=6, 8 flies for DA1m, DA2m. o, n=3, 11 flies for DA1m, DA2m. Two-tailed Student’s t-test was performed. m, p=0.0070 (**), 0.0024 (**), 0.0091 (**), 0.0171 (*) for γ2, γ3, γ4, γ5. n, p=0.0910 (n.s.), 0.0137 (*), 0.0207 (*), 0.3808 (n.s.) for γ2, γ3, γ4, γ5. o, p= 0.0033 (**), 0.0701 (n.s.), 0.0150 (*), 0.0990 (n.s.) for γ2, γ3, γ4, γ5. p, Schematic illustration depicting the strategy for imaging optogenetically induced DA release. DA2m is expressed in the KCs, and CsChrimson is expressed in the DANs in either the γ2 or γ5 MB compartment (with the number of innervating cells indicated). q,r, Representative fluorescence images (top left), response images (bottom left), representative traces (top right), and group summary (bottom right) of DA2m fluorescence in the γ2 (q) and γ5 (r) MB compartments in response to optogenetic stimulation. Scale bars, 20 μm. q, n=5 flies. r, n=6 flies. Two-tailed Student’s t-test was performed. q, p=0.0035 (**), 0.0012 (**), 0.0013 (**) between γ2 and γ3, γ4, γ5. r, p=0.0002 (***), 0.0003 (***), 0.0001 (***) between γ5 and γ2, γ3, γ4. The group data for DA1m shown in panels k, m, n, and o were reproduced from Sun et al. with permission. Average traces (bold), overlaid with single-trial traces (light) from one fly are shown for representation in c, d, h, m, n. Average traces shaded with ± s.e.m. from one fly are shown for representation in j, q, r. Data are presented as the mean ± s.e.m. in c, d, e, k, l, m, n, o, q, r.
Fig. 5 |
Fig. 5 |. GRABDA sensors can detect optogenetically induced nigrostriatal DA release in freely moving mice.
a, Schematic illustration depicting the experimental setup. b, Measured emission spectra in vivo using fiber photometry. c-g, Average ΔF/F0 traces of the indicated sensors and fluorescent proteins during optogenetic stimulation under control conditions (left) or in the presence of methylphenidate (MPH) or eticlopride (Etic). h-l, Group summary of ΔF/F0 and time constants (where applicable) for the corresponding sensors in panels c-g, respectively. n=30 trials from 6 hemispheres of 3 mice for rDA-mut. n=30 trials from 6 hemispheres of 6 mice for rDA1m. n=15 trials from 3 hemispheres of 3 mice for rDA1h. n=30 trials from 6 hemispheres of 3 mice for DA2m. n=25 trials from 5 hemispheres of 4 mice for DA2h. Two-tailed Student’s t-test was performed. h, p=0.6066 (n.s.) between baseline and MPH; p=0.7130 (n.s.) between baseline and Etic; p=0.3216 (n.s.) between MPH and Etic. i, left, p=1.27×10⁻¹⁶ (***); right, p=2.98×10⁻¹⁵ (***). j, left, p=7.07×10⁻¹⁰ (***); right, p=0.0034 (**). k, left, p=7.86×10⁻²¹ (***); right, p=1.07×10⁻⁶ (***). l, left, p=1.86×10⁻²⁵ (***); right, p=2.06×10⁻⁷ (***). Average traces shaded with ± s.e.m. are shown in c-g. Data are presented as the mean ± s.e.m. in h-l.
Fig. 6 |
Fig. 6 |. GRABDA sensors can be used to measure dopaminergic activity in the mouse NAc during sexual behavior.
a, Schematic illustration depicting the experimental strategy for panels b-f. b, Representative image showing the expression of DA1h and DA2h in opposite hemispheres. Similar results were observed for 3 mice. Scale bar, 1 mm. c, Representative traces of DA1h and DA2h ΔF/F0 measured during the indicated stages of mating. Similar results were observed for 3 mice. d, The time shift correlation coefficient between the DA1h and DA2h signals. n=3 mice. e, Average post-stimulus histograms aligned to the onset of the indicated mating events. n=3 mice. f, Group summary of ΔF/F0 measured for DA1h and DA2h during the indicated mating events. n=3 mice. F4,16=15.43, p=2.0×10⁻⁵ (***) for row factor and F1,4=10.72, p=0.0307 (*) for column factor by two-way ANOVA. Bonferroni’s multiple comparisons test were performed between groups, p>0.99 (n.s.), p>0.99 (n.s.), p=0.0732 (n.s.), p=0.2993 (n.s.), p=0.0013 (**). g, Schematic illustration depicting the experimental strategy for panels h-l. h, Representative images showing the colocalized expression of rDA1m and DA2h. Similar results were observed for 3 mice. Scale bar, 1 mm. i, Representative traces of rDA1m and DA2h ΔF/F0 measured during the indicated stages of mating. Similar results were observed for 3 mice. j, The time shift correlation coefficient between the rDA1m and DA2h signals. n=3 mice. k, Average post-stimulus histograms aligned to the onset of the indicated mating events. n=3 mice. l, Group summary of the ΔF/F0 measured for rDA1m and DA2h during the indicated mating events. n=3 mice. F4,16=8.613, p=0.0007 (***) for row factor and F1,4=52.46, p=0.0019 (**) by two-way ANOVA. Bonferroni’s multiple comparisons test were performed between groups, p>0.99 (n.s.), p=0.0208 (*), p=0.0092 (**), p=0.0004 (***), p=2.0×10⁻⁶ (***). Average traces shaded with ± s.e.m. are shown in d, e, j, k. Data are presented as the mean ± s.e.m. in f, l.

References

    1. Björklund A & Dunnett SB Dopamine neuron systems in the brain: an update. Trends in neurosciences 30, 194–202 (2007). - PubMed
    1. Wise RA Dopamine, learning and motivation. Nature reviews neuroscience 5, 483–494 (2004). - PubMed
    1. Klein MO et al. Dopamine: functions, signaling, and association with neurological diseases. Cellular and molecular neurobiology 39, 31–59 (2019). - PMC - PubMed
    1. Tidey JW & Miczek KA Social defeat stress selectively alters mesocorticolimbic dopamine release: an in vivo microdialysis study. Brain research 721, 140–149 (1996). - PubMed
    1. Robinson DL, Venton BJ, Heien ML & Wightman RM Detecting subsecond dopamine release with fast-scan cyclic voltammetry in vivo. Clinical chemistry 49, 1763–1773 (2003). - PubMed

Publication types

MeSH terms