. 2020 Nov;587(7832):115-120.
doi: 10.1038/s41586-020-2836-1. Epub 2020 Oct 21.

TGF-β suppresses type 2 immunity to cancer

Affiliations

TGF-β suppresses type 2 immunity to cancer

Ming Liu et al. Nature. 2020 Nov.

Abstract

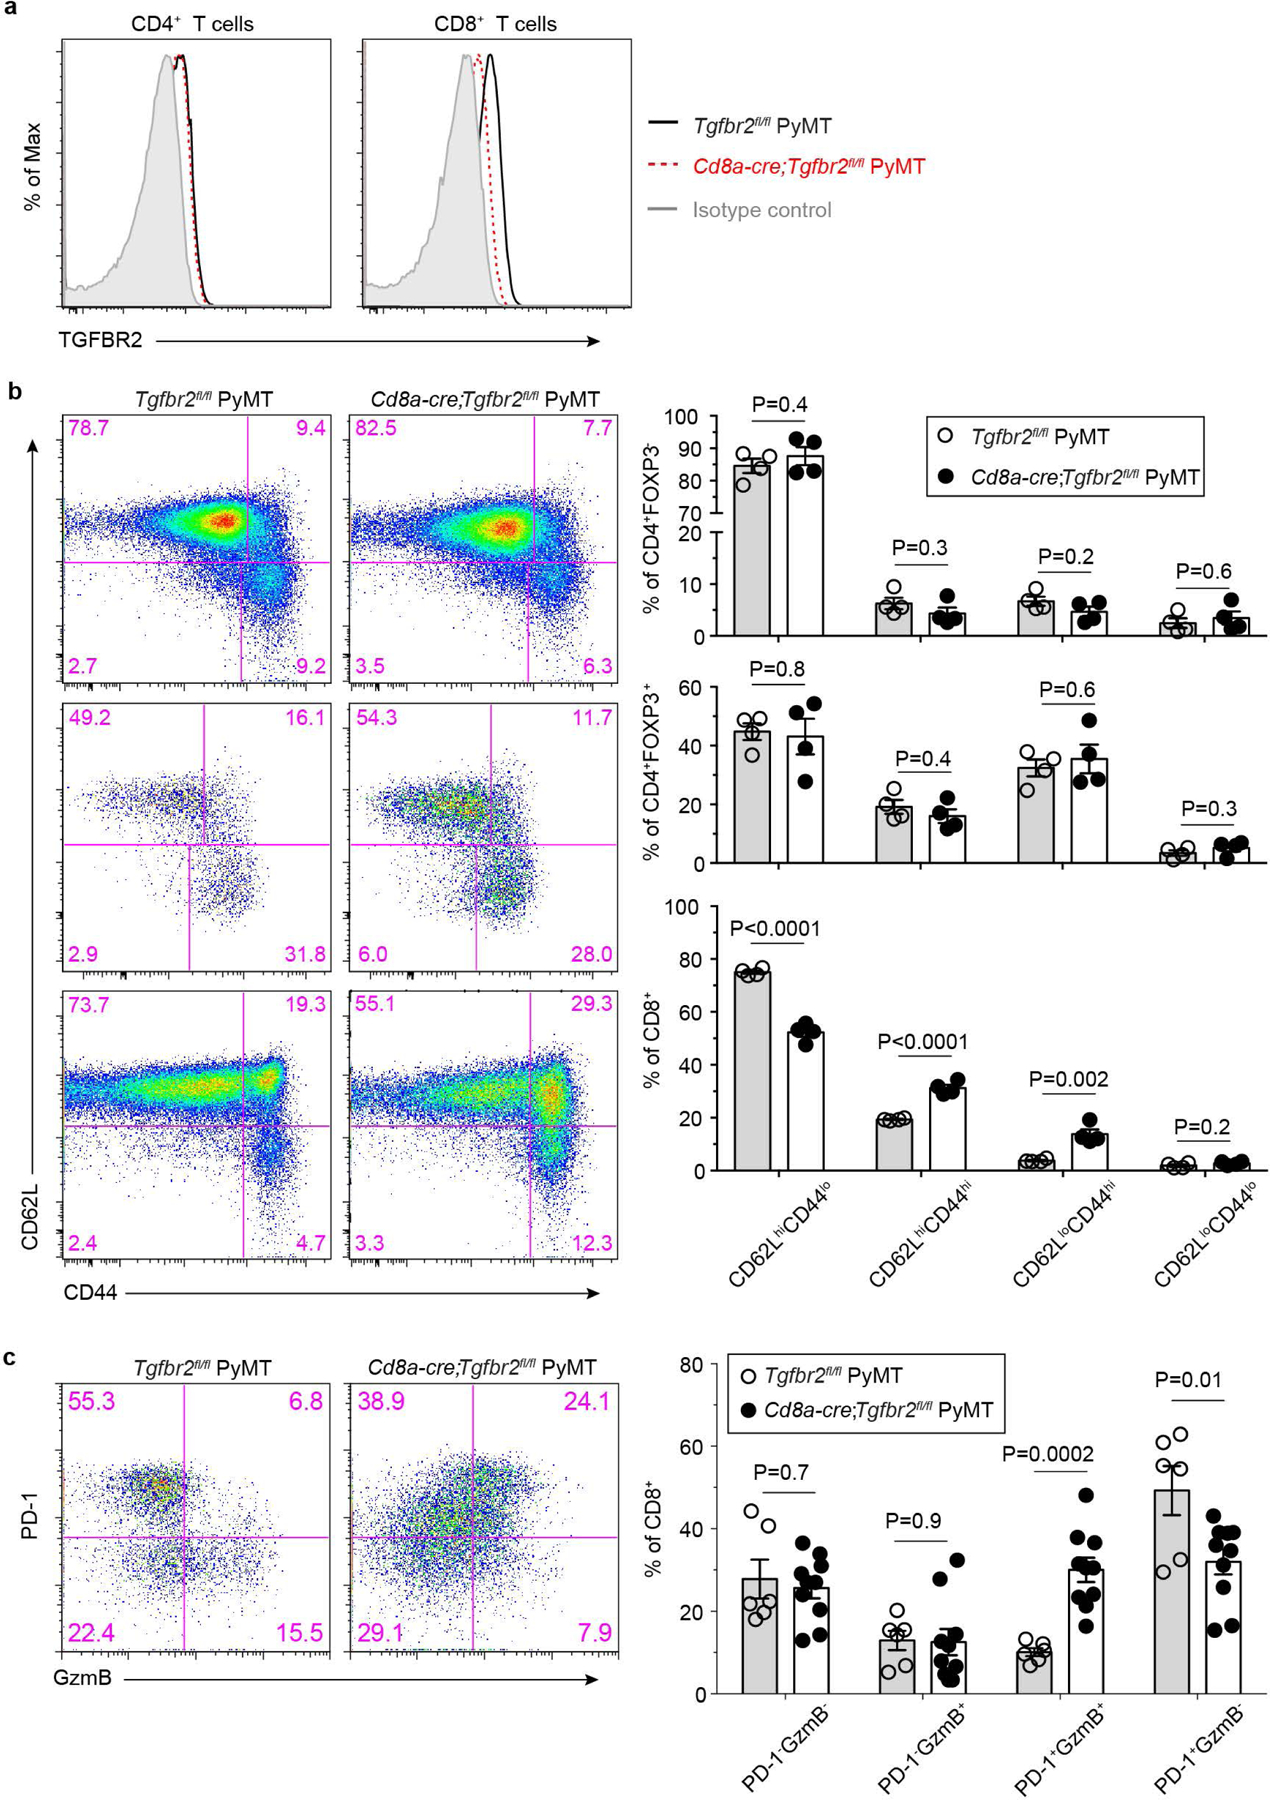
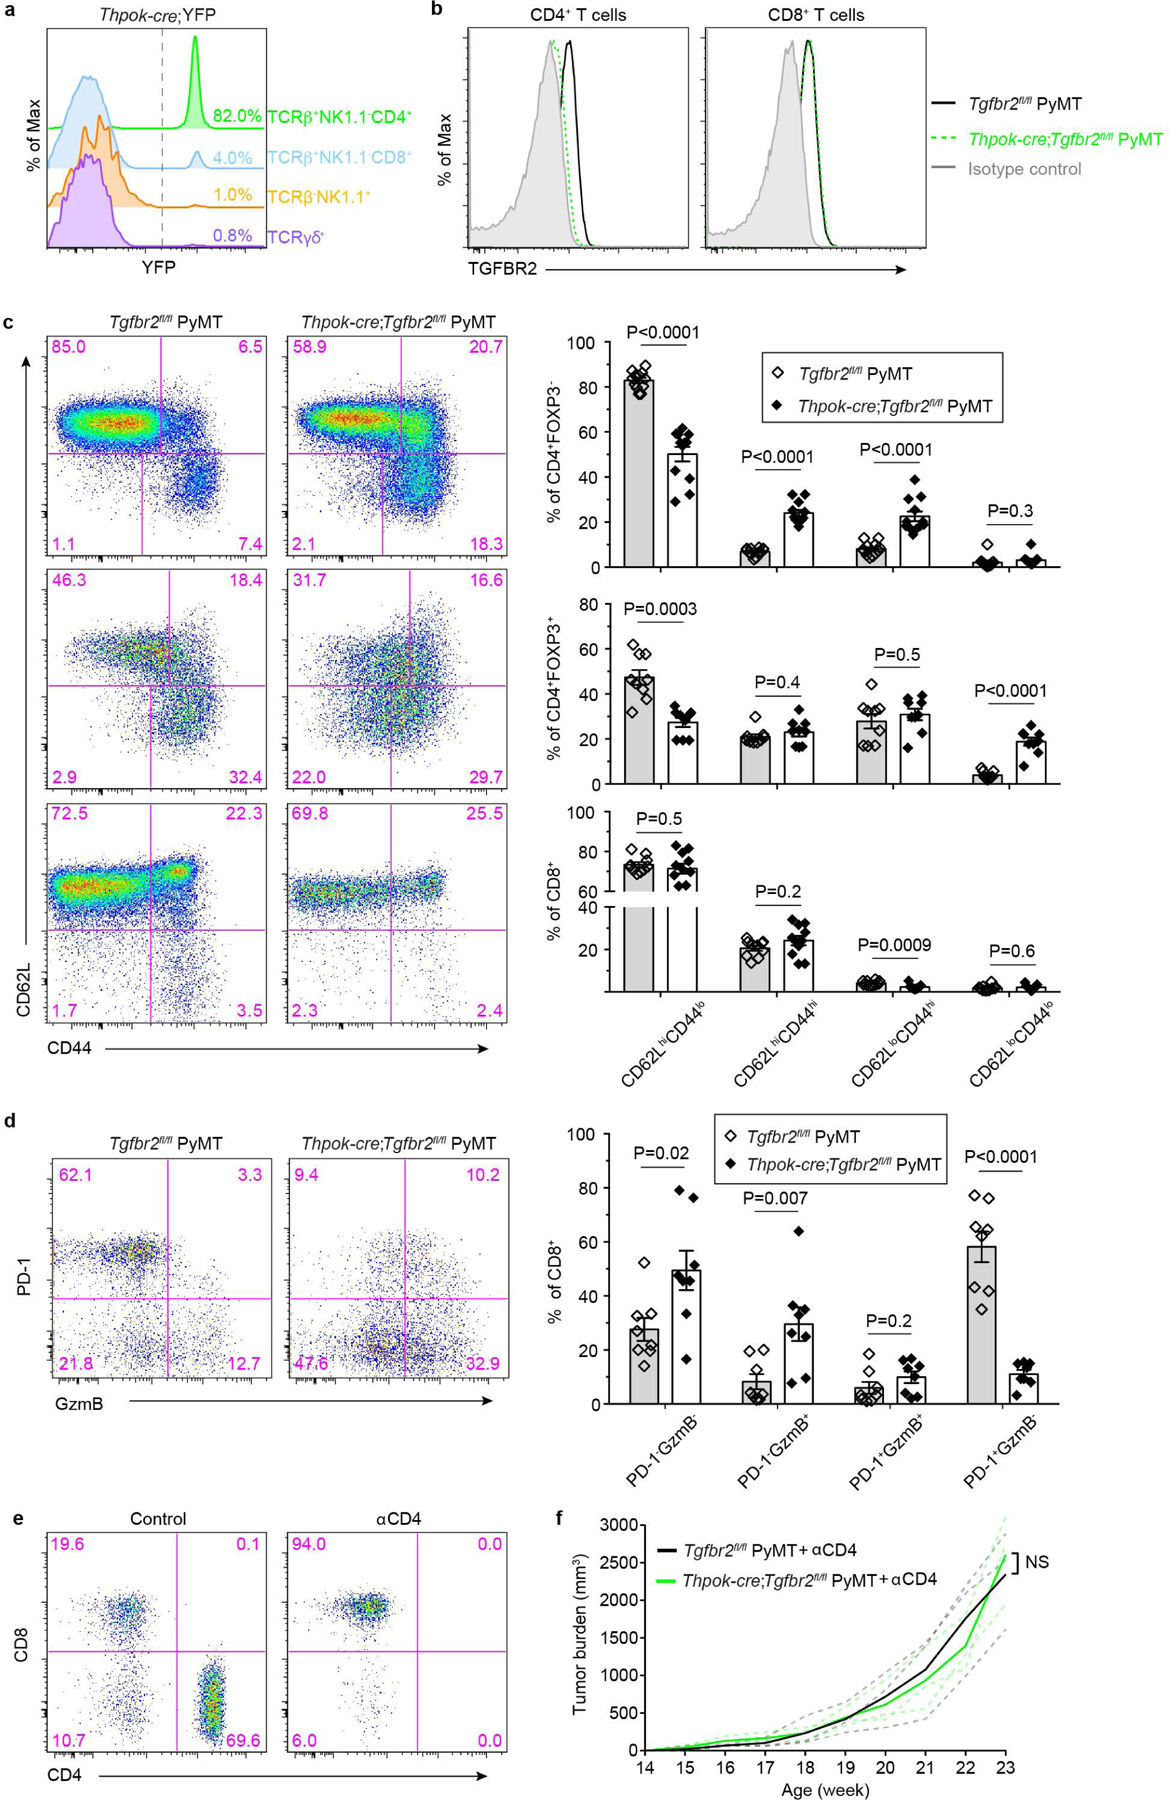
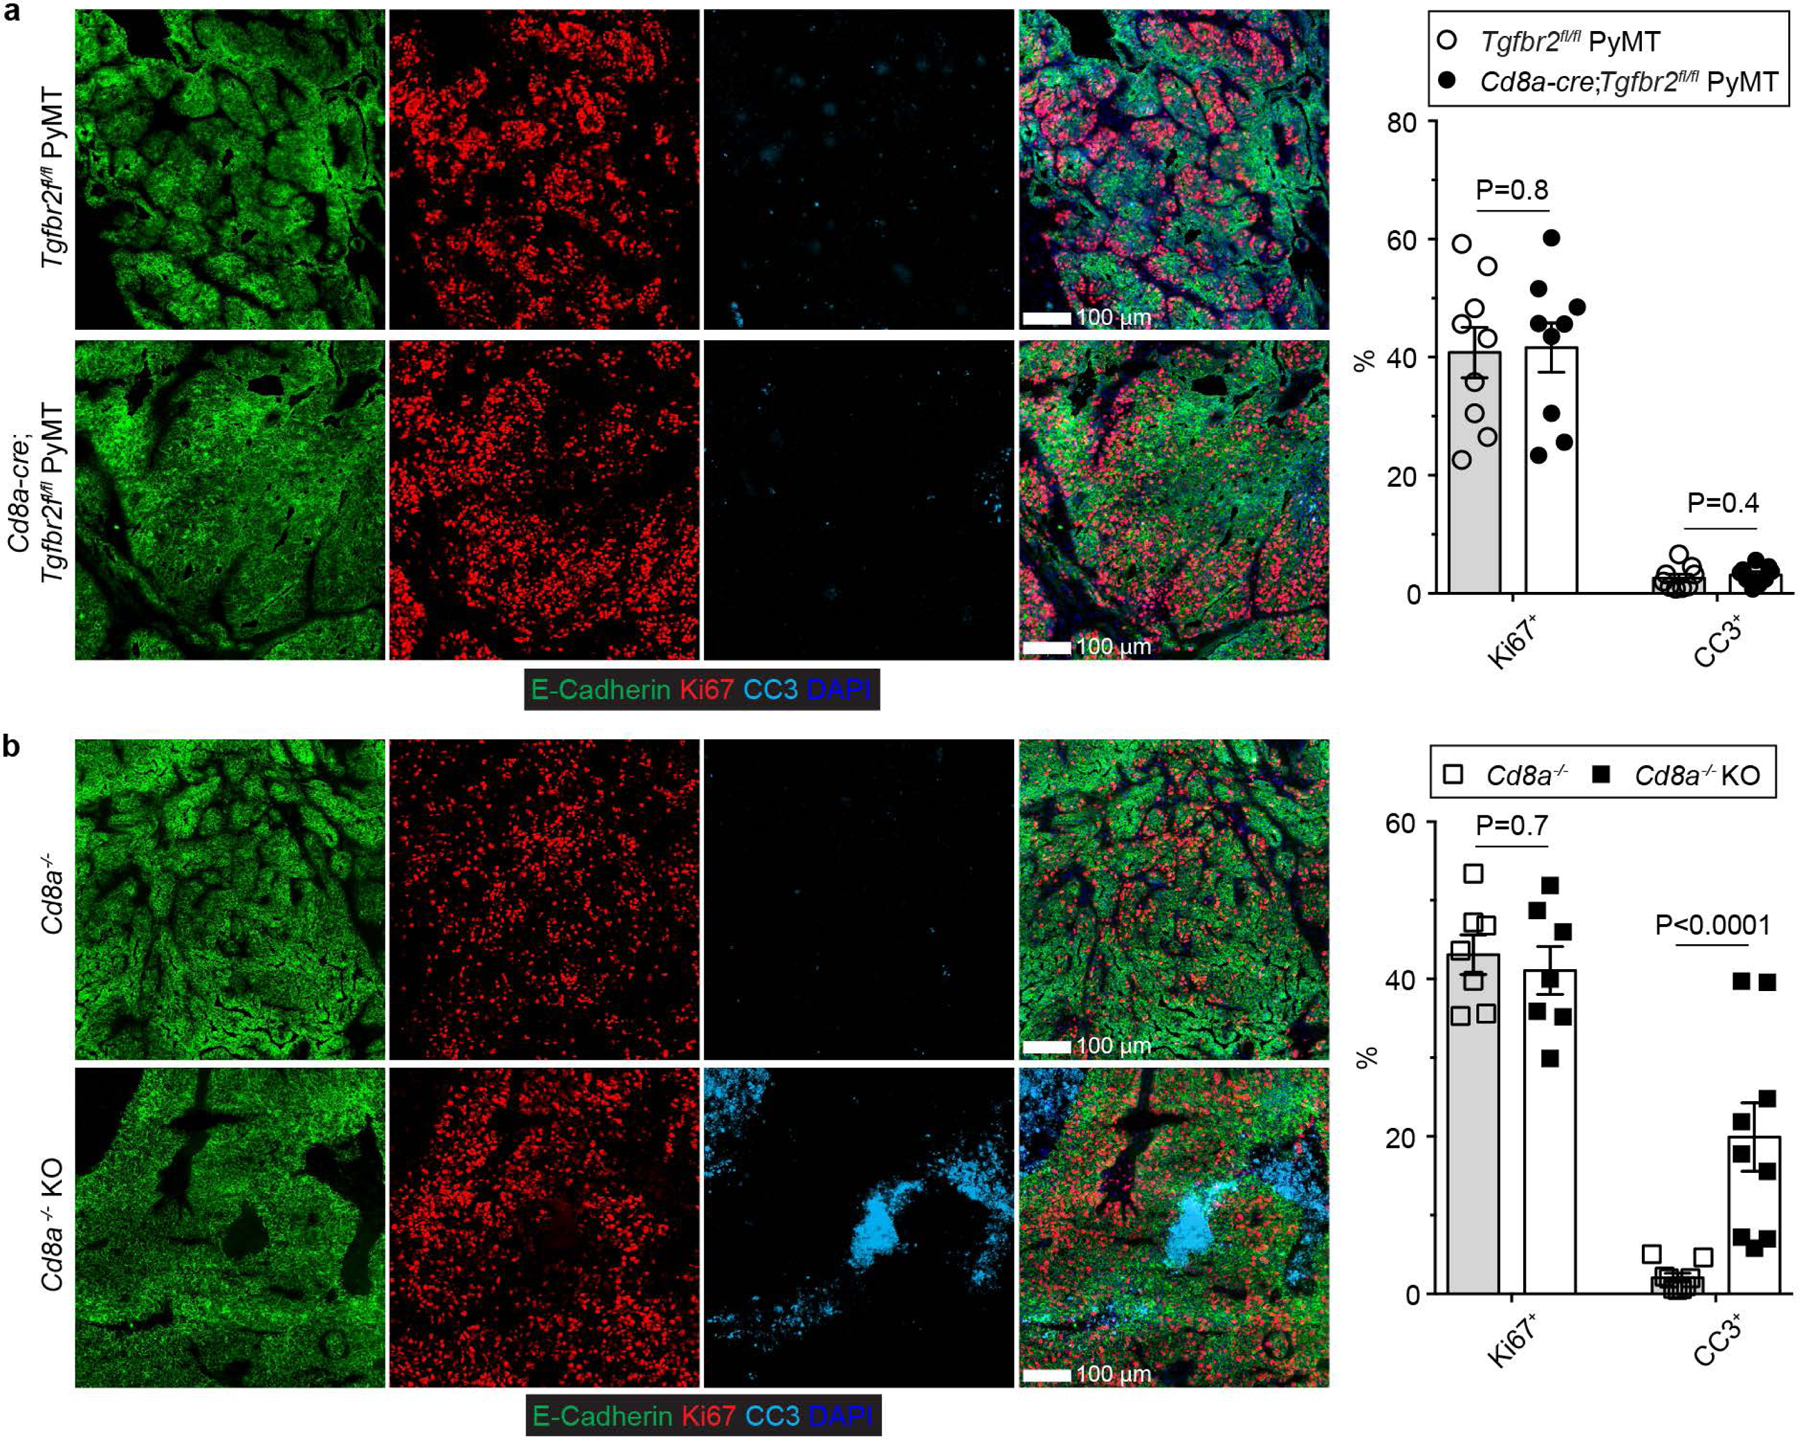
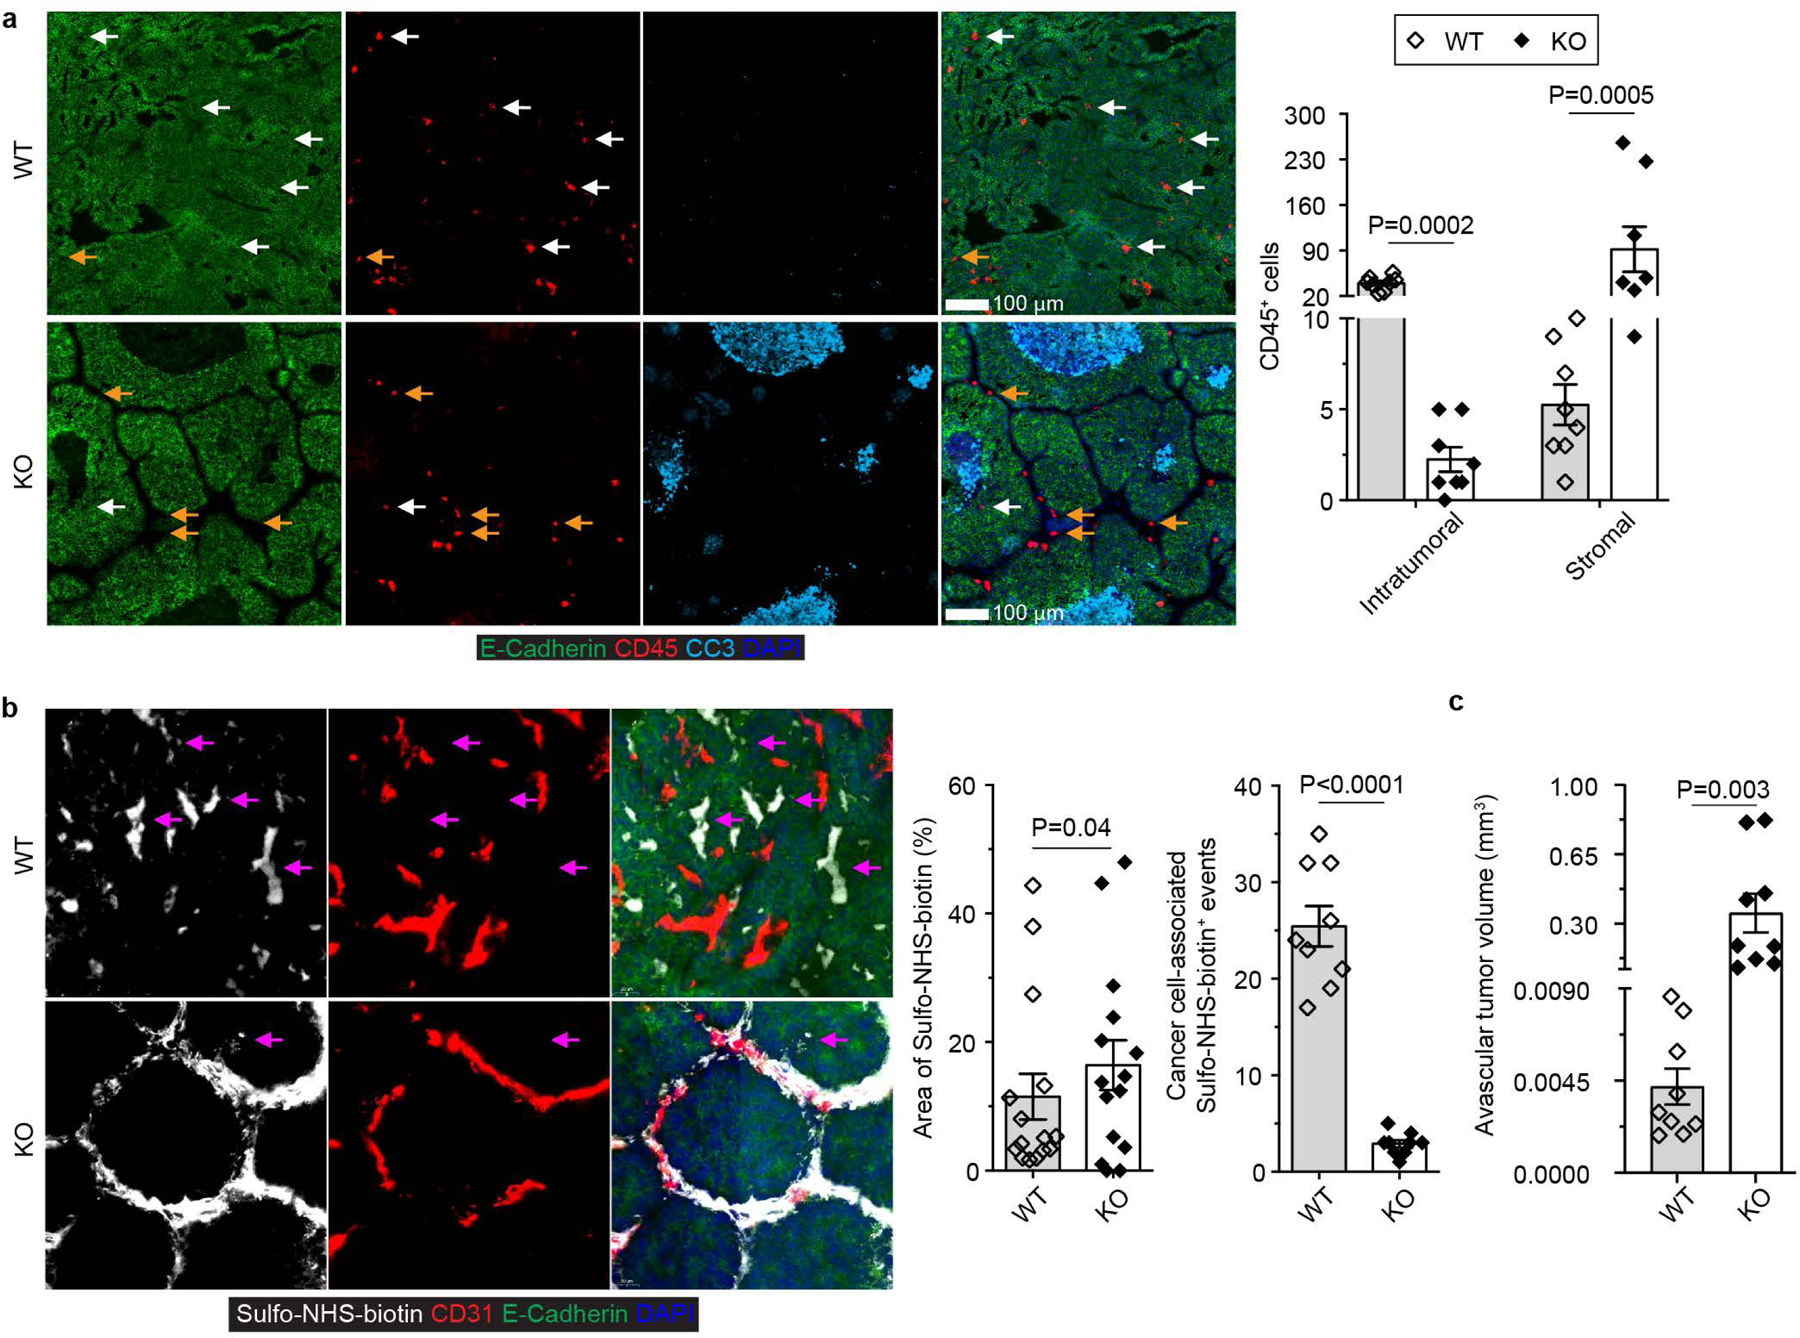
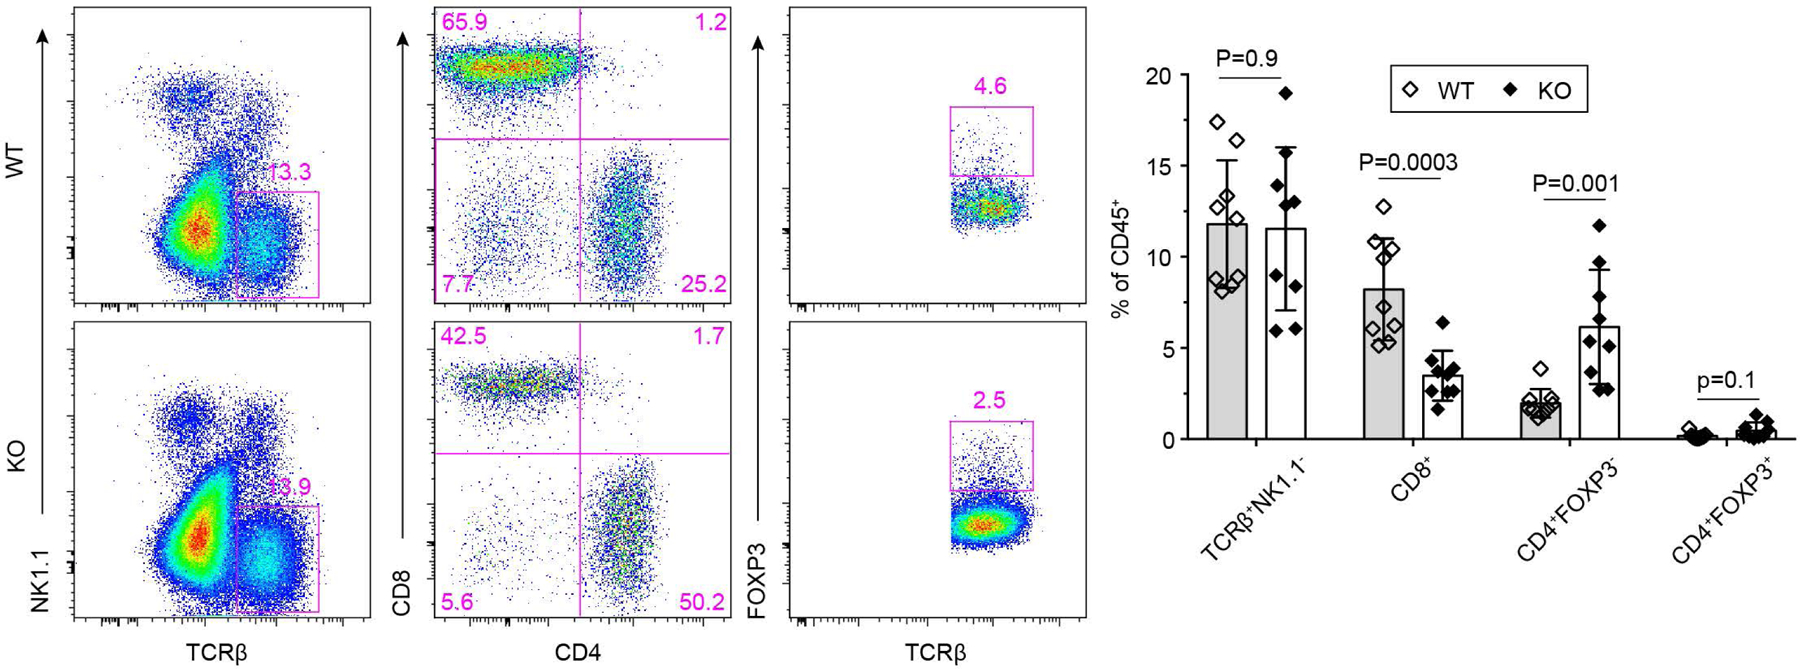
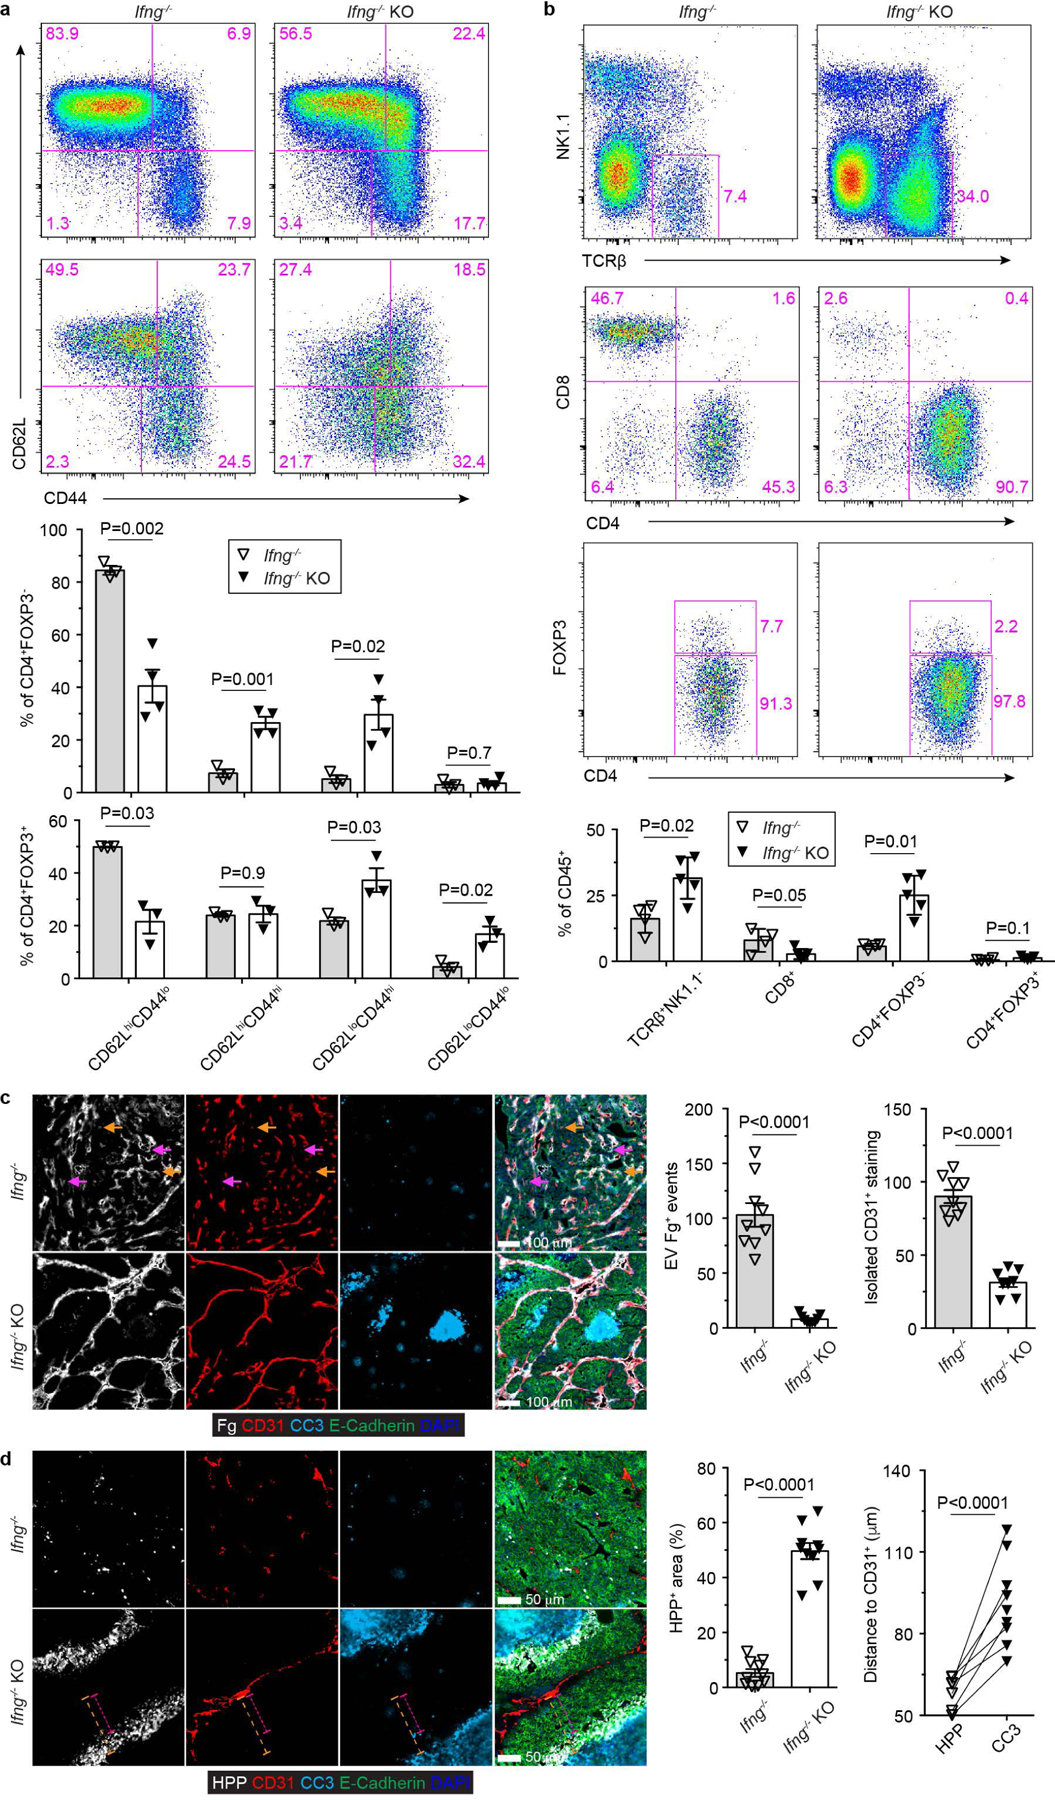
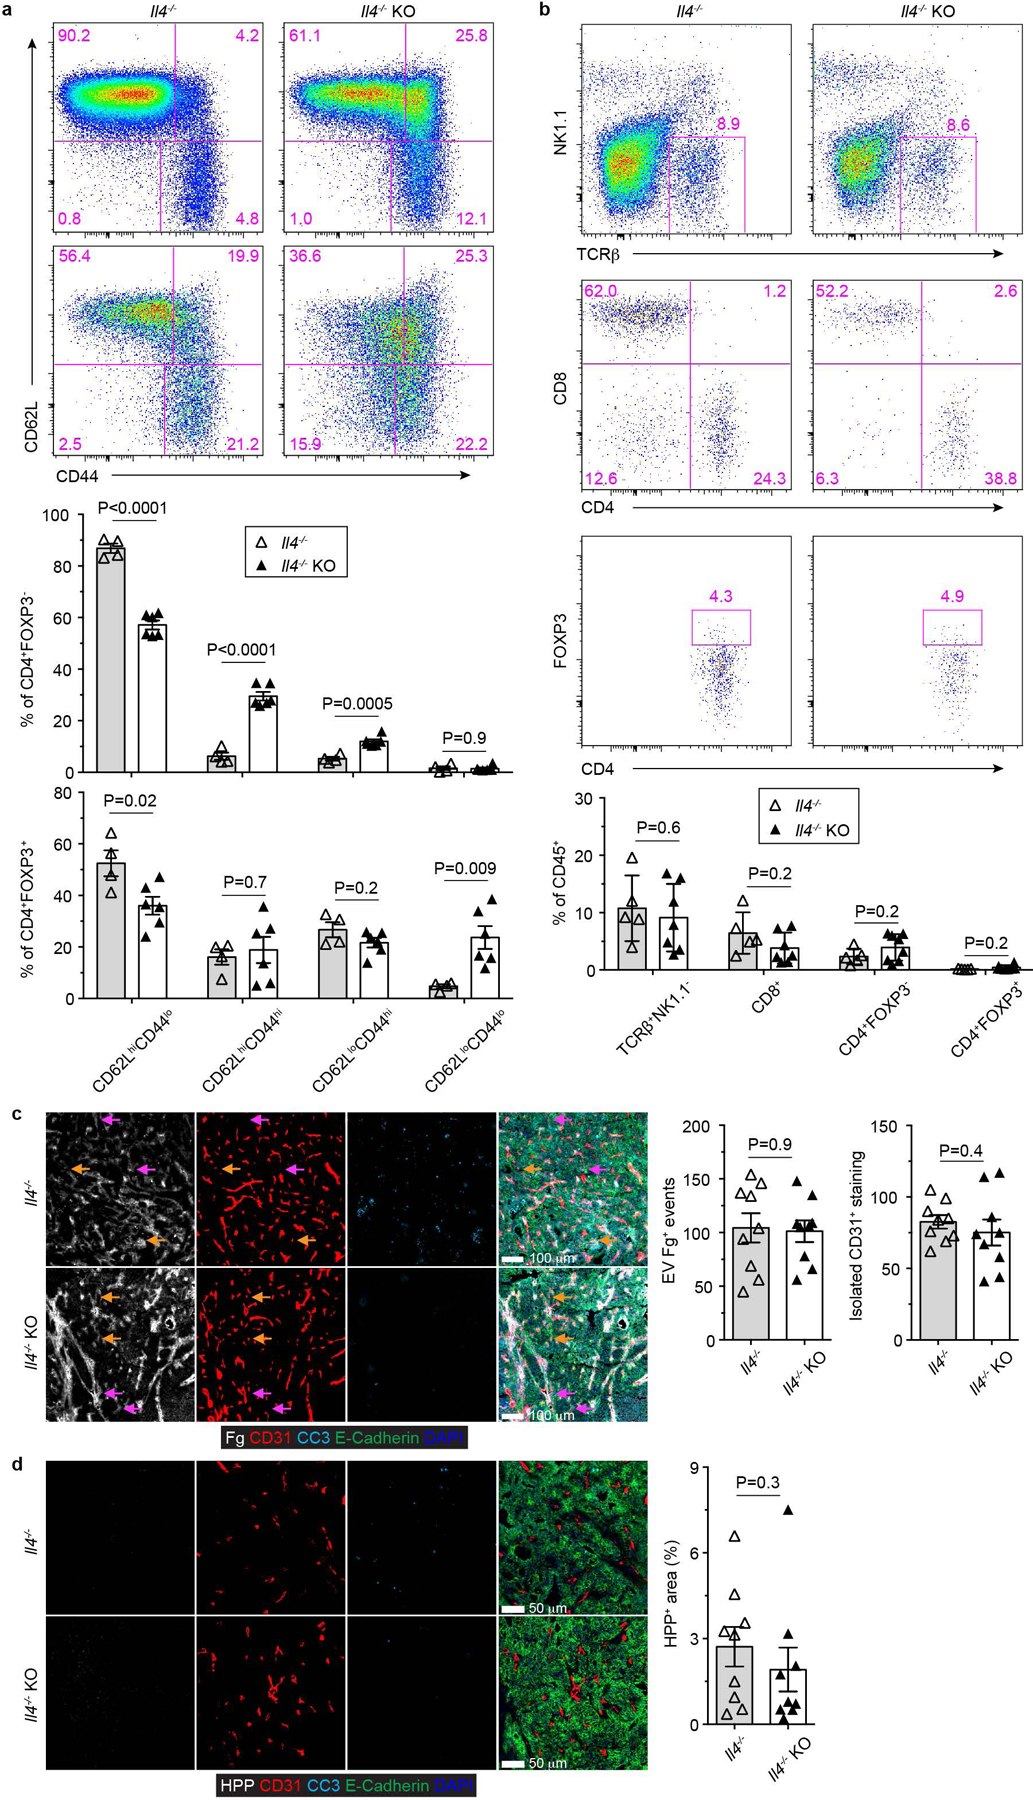
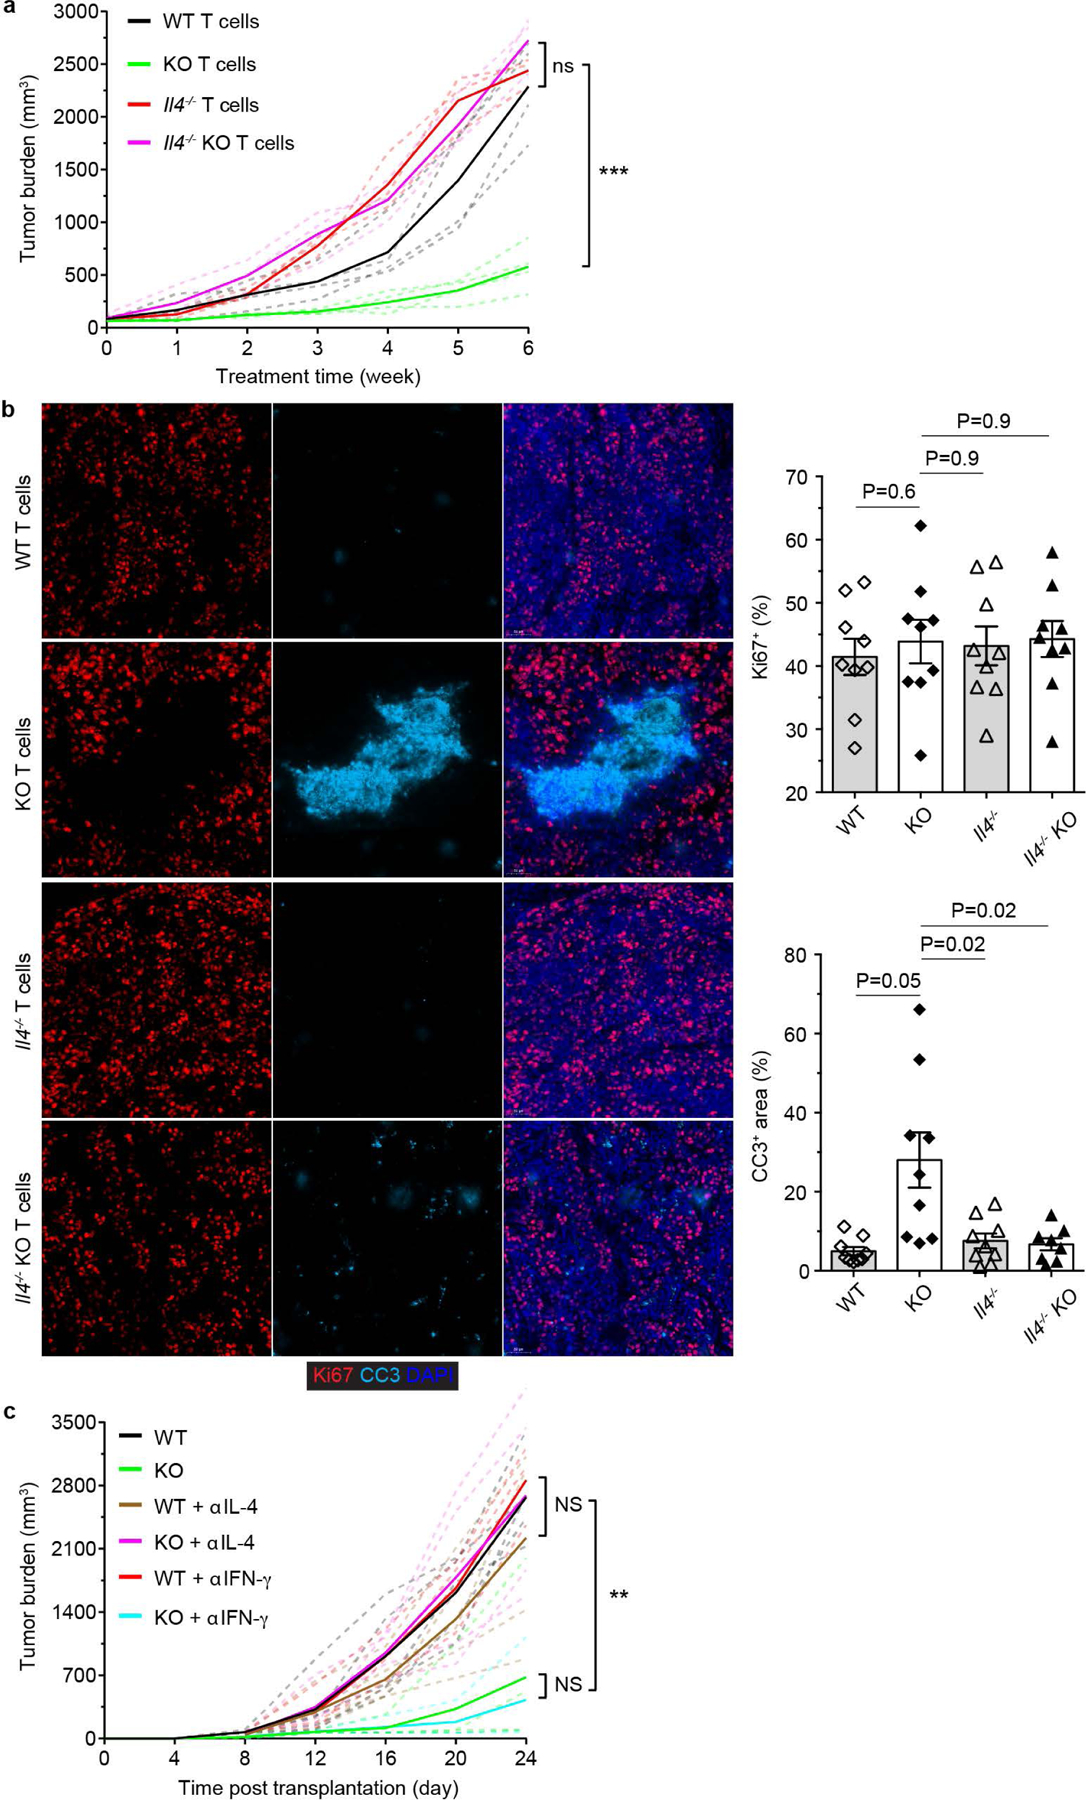
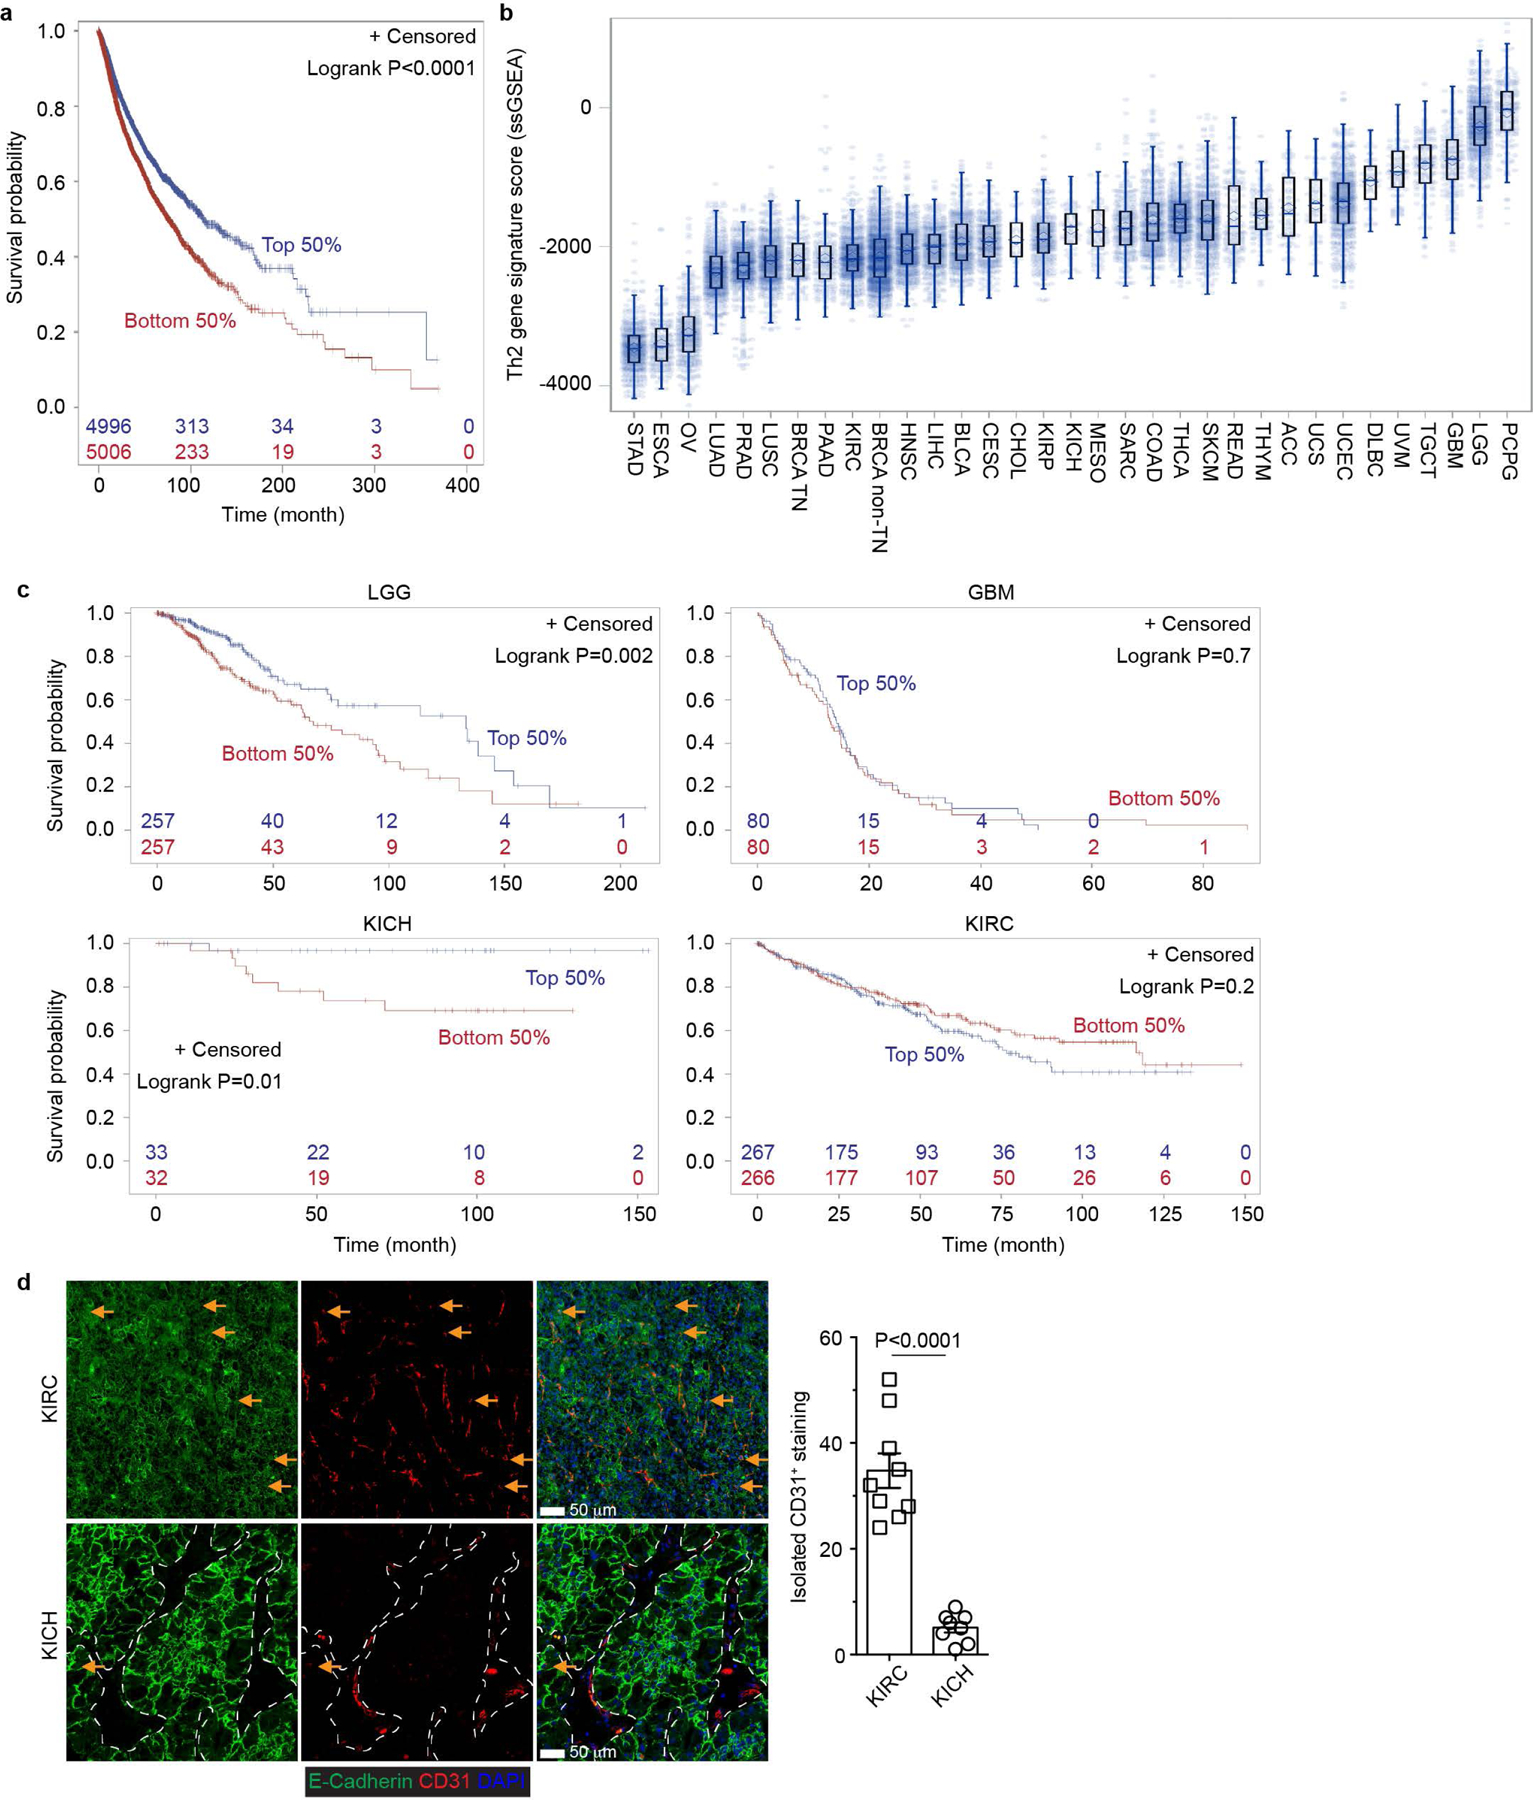
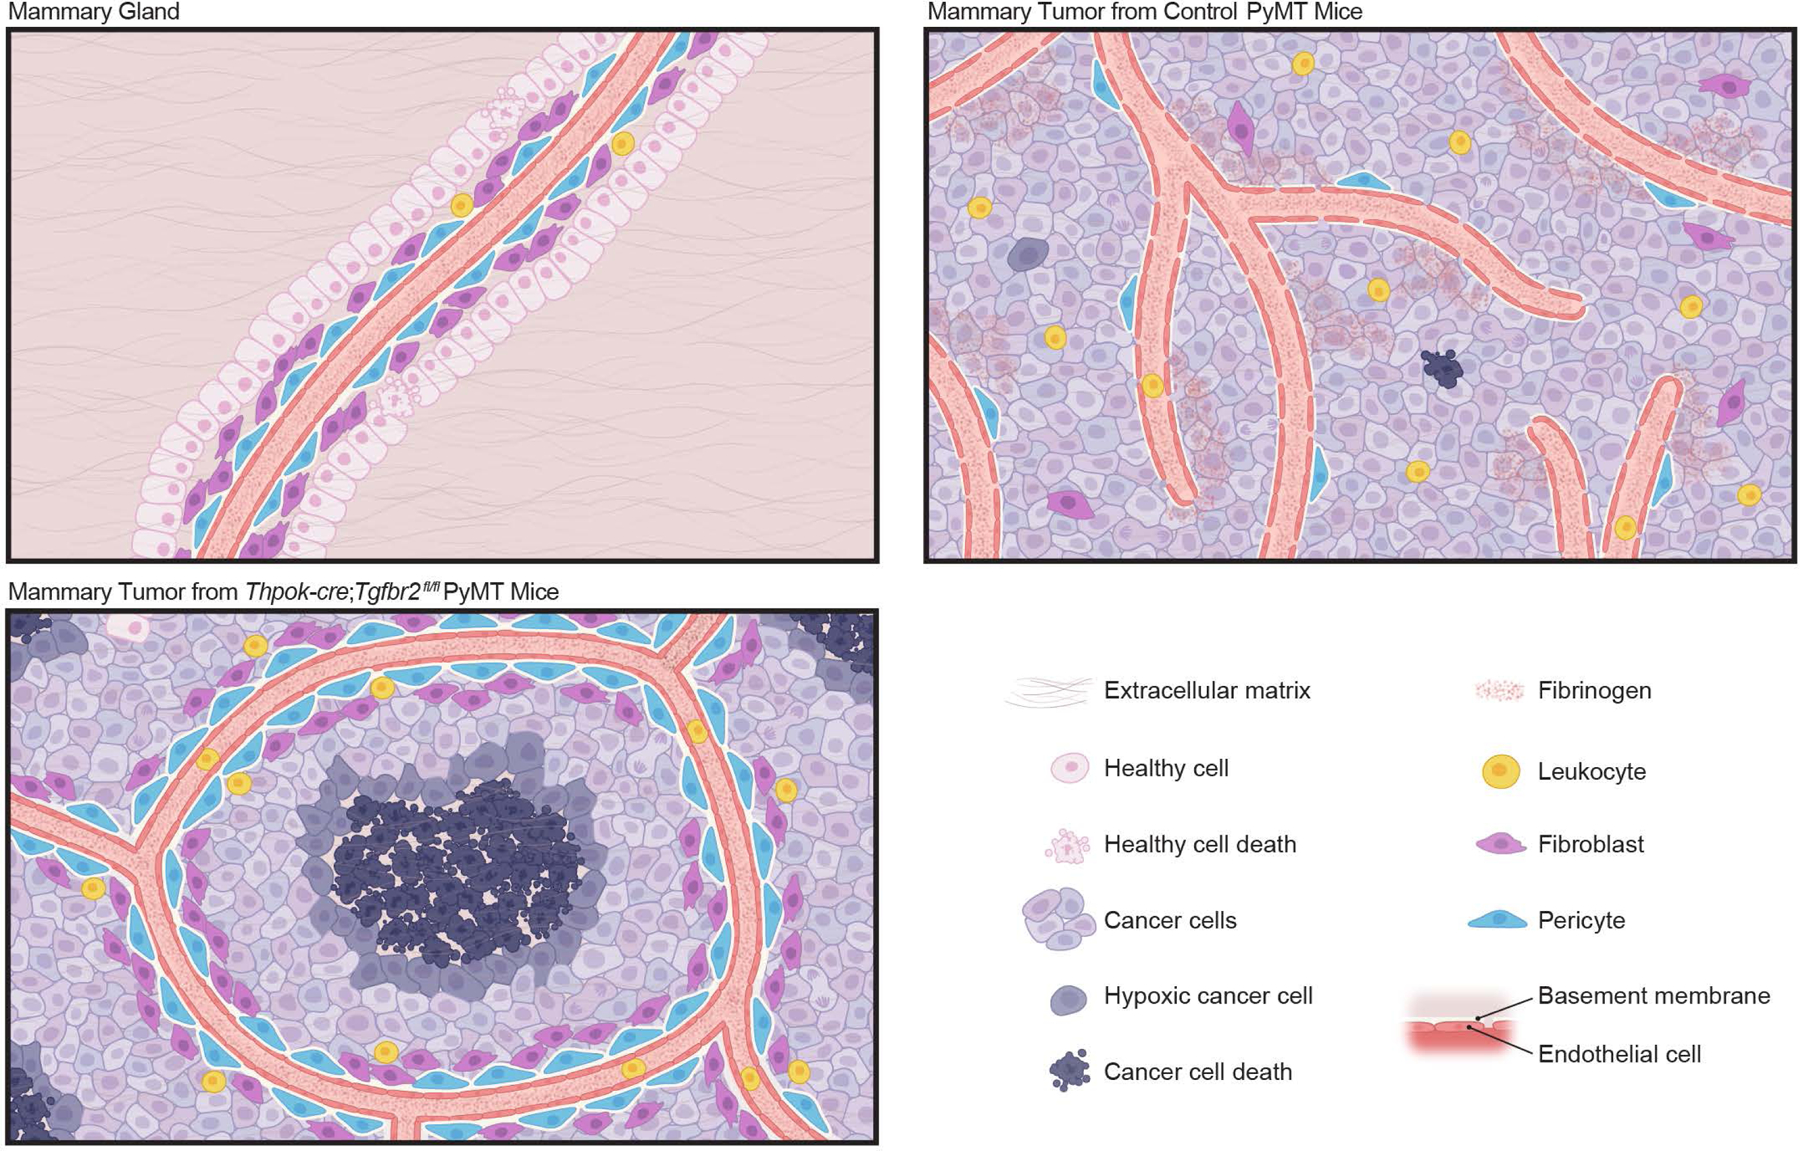
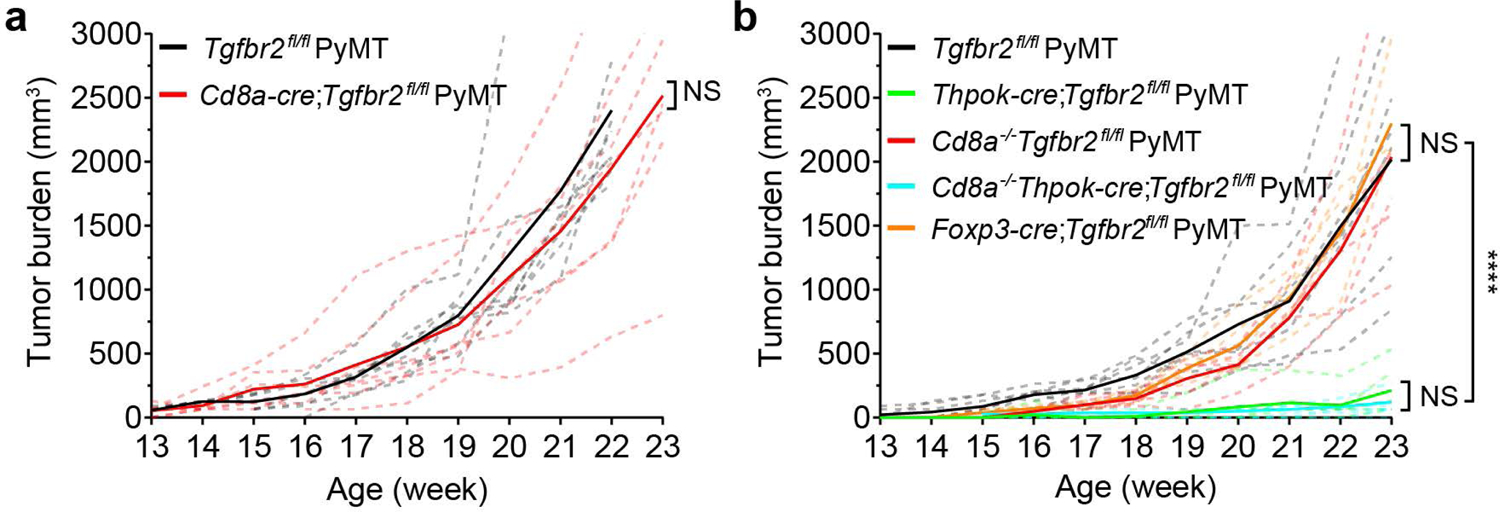
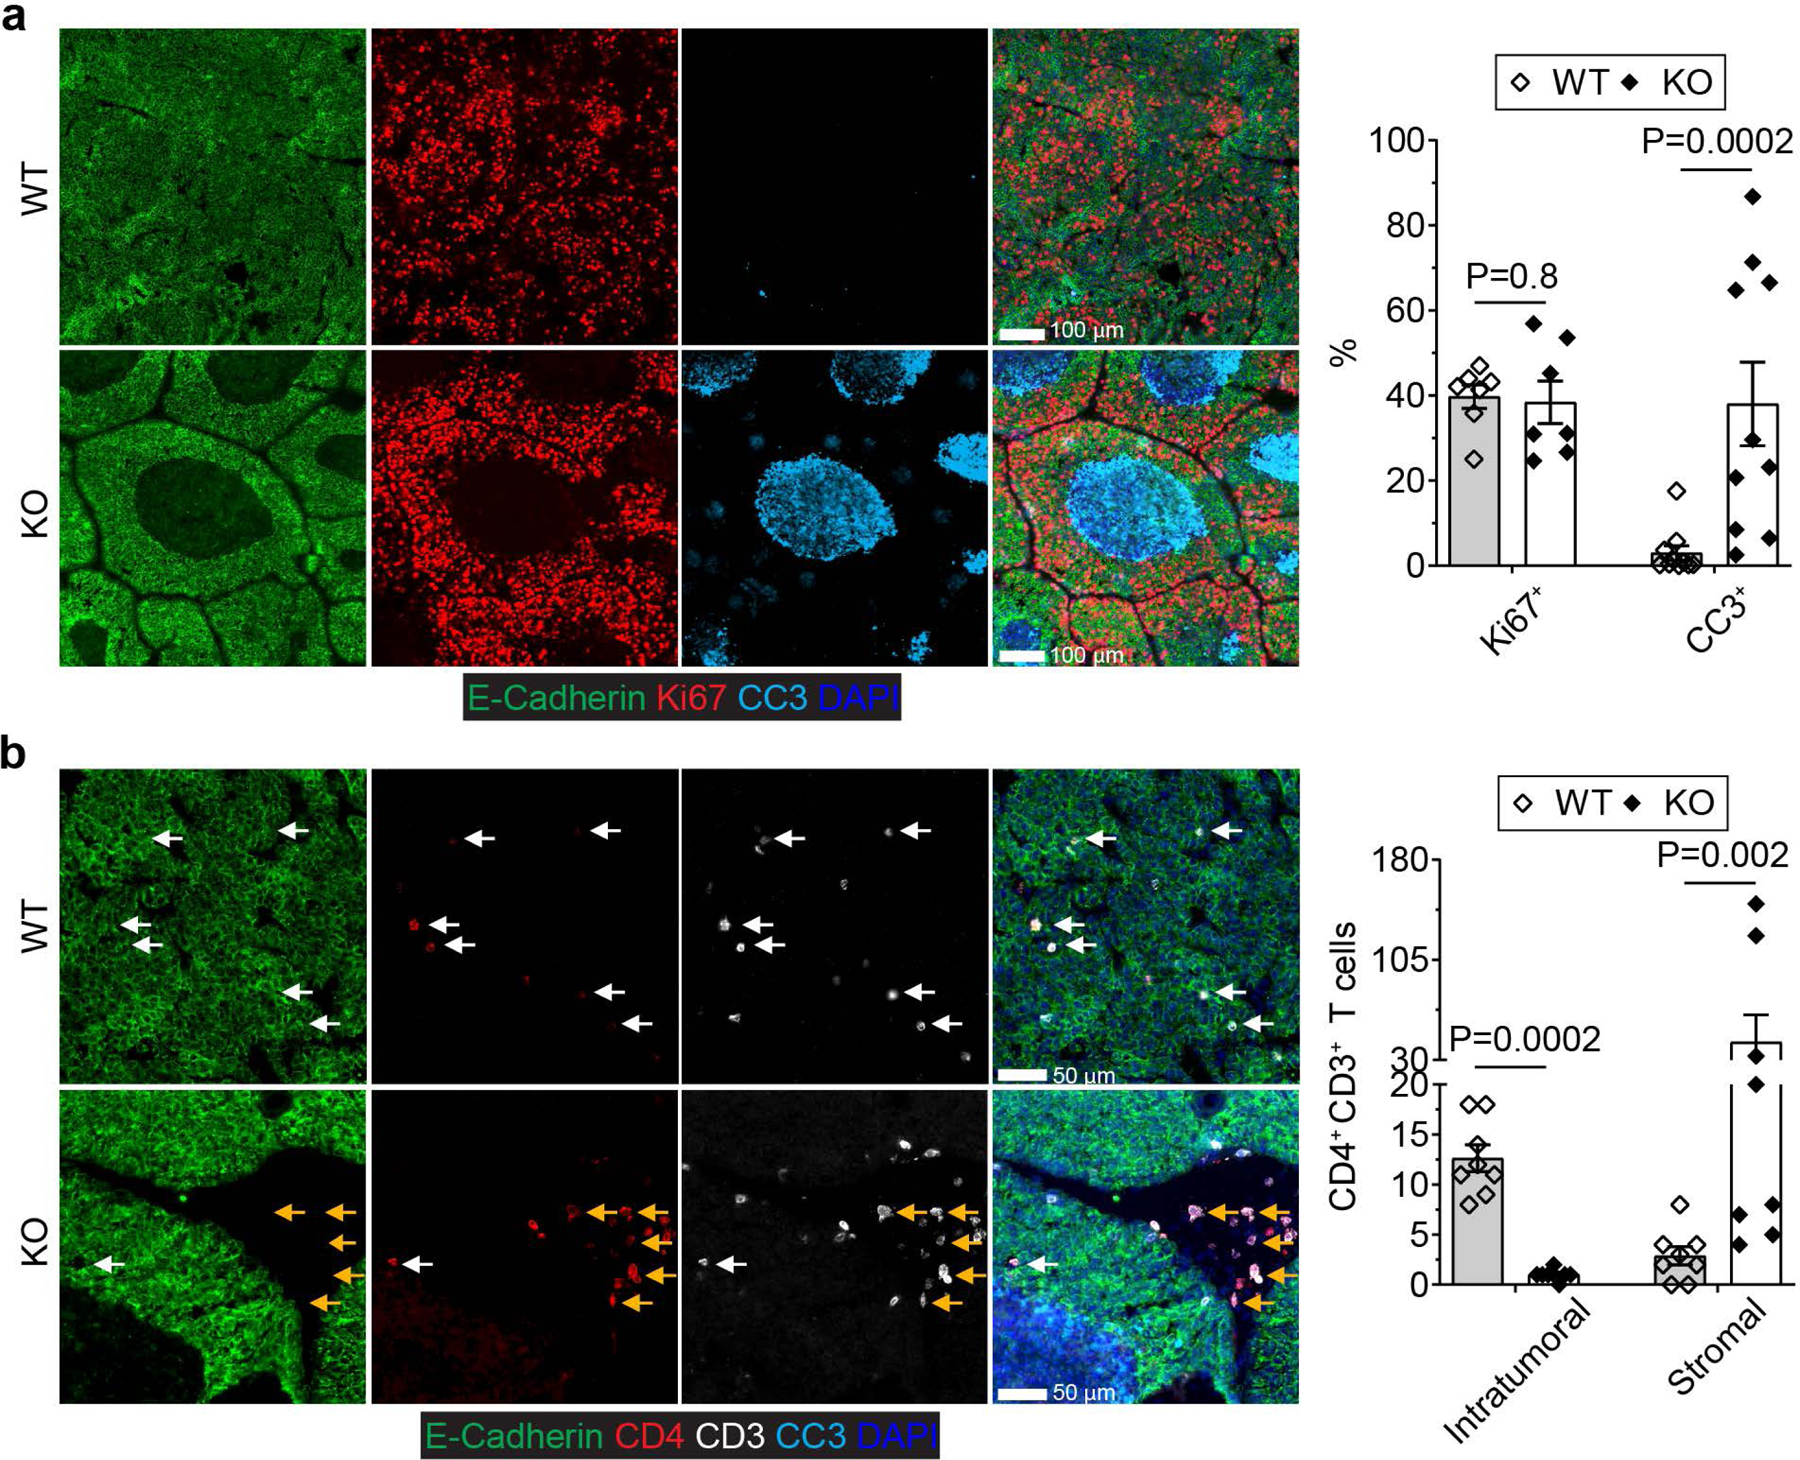
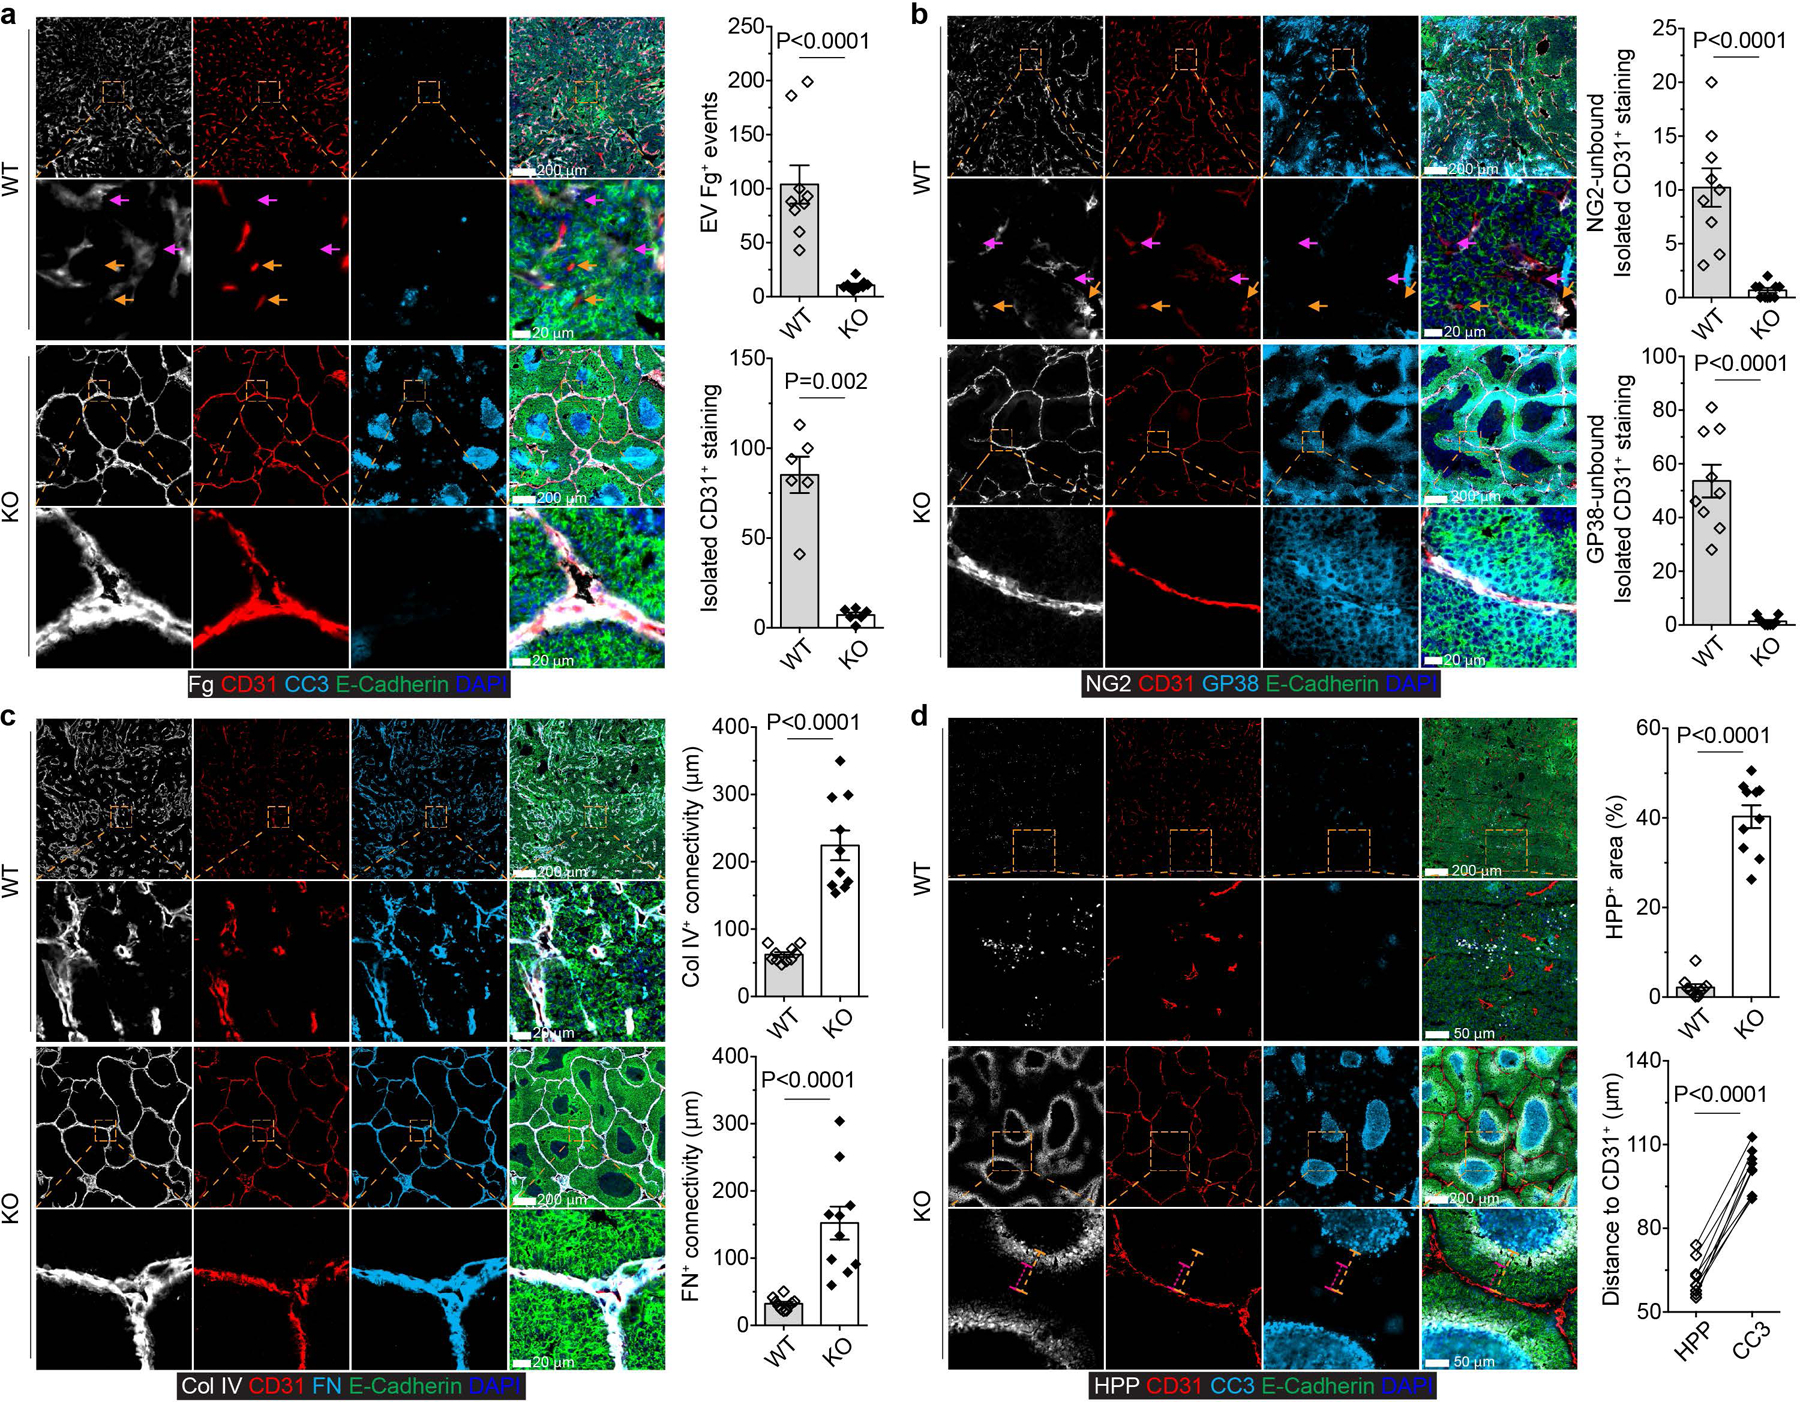
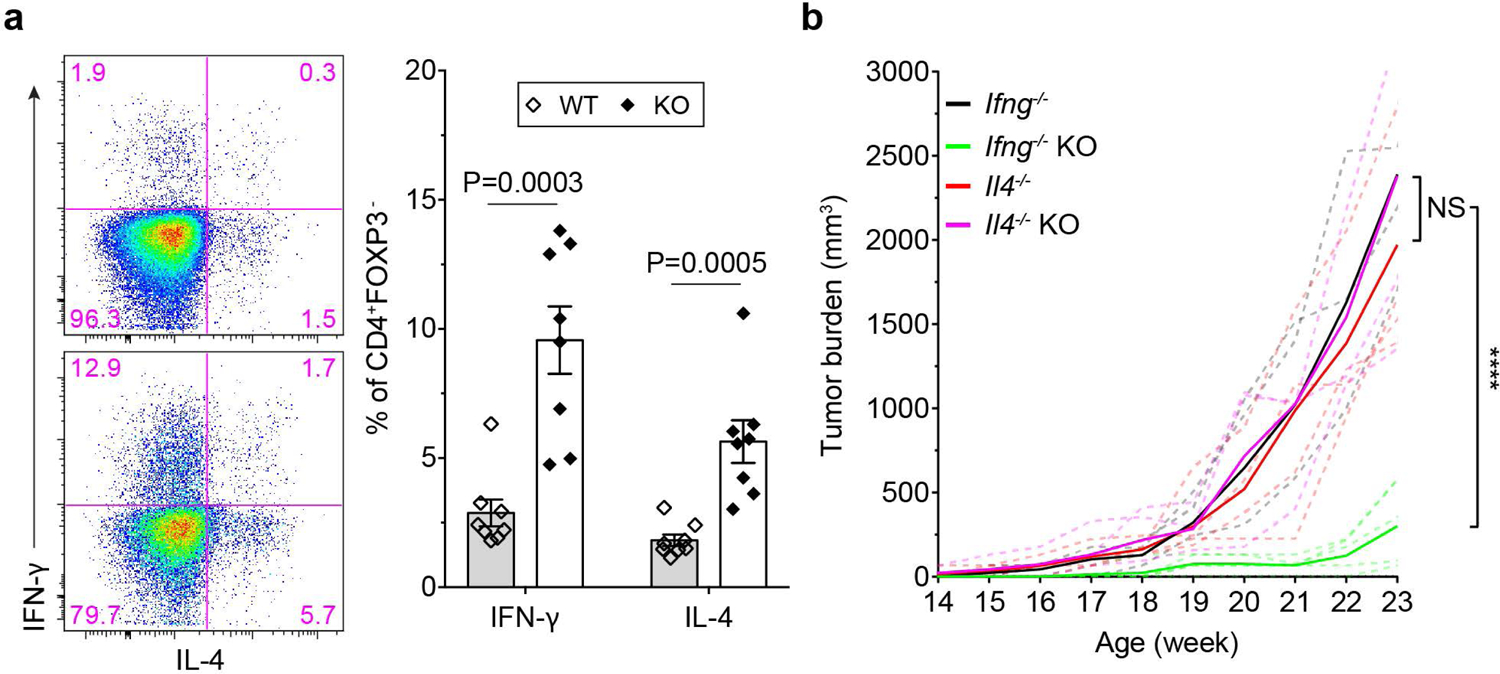
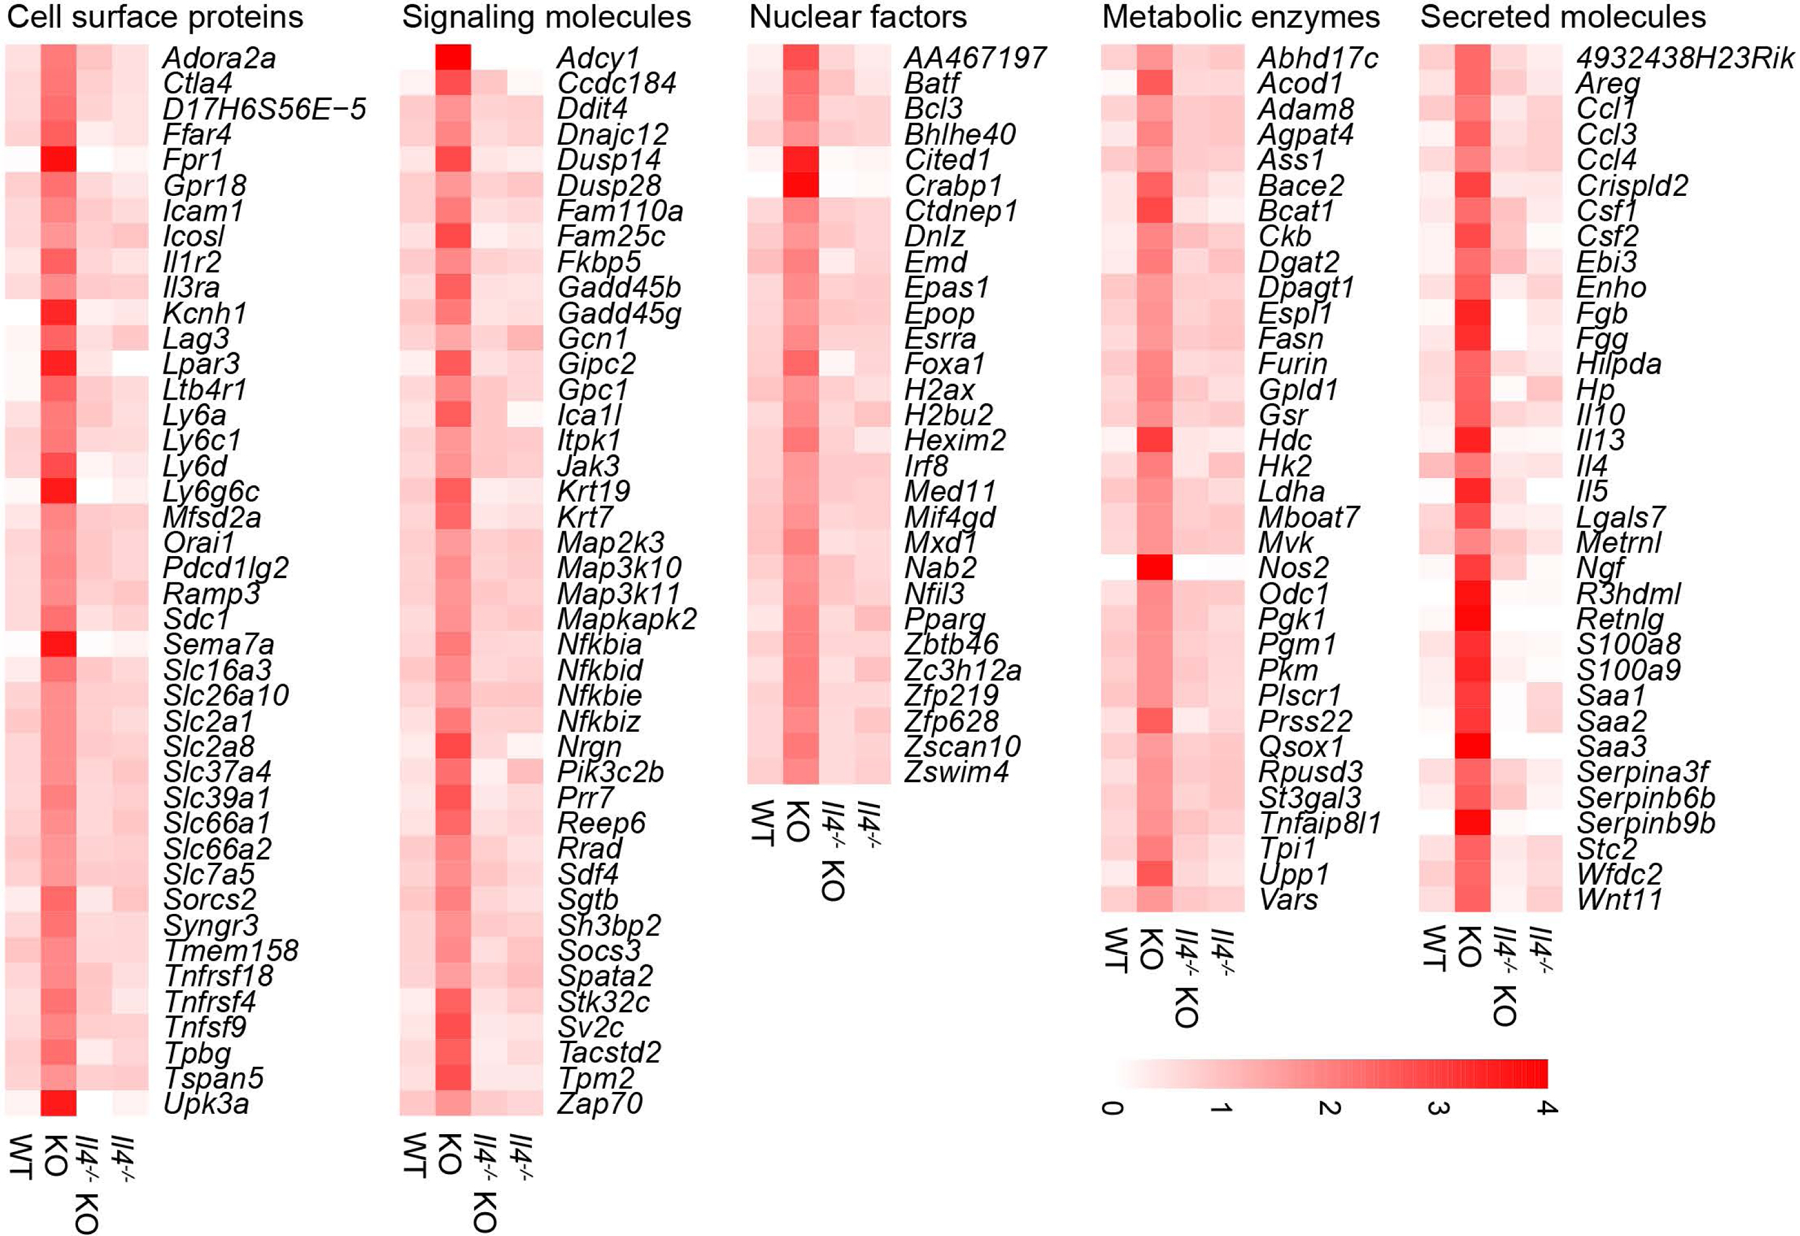
The immune system uses two distinct defence strategies against infections: microbe-directed pathogen destruction characterized by type 1 immunity1, and host-directed pathogen containment exemplified by type 2 immunity in induction of tissue repair2. Similar to infectious diseases, cancer progresses with self-propagating cancer cells inflicting host-tissue damage. The immunological mechanisms of cancer cell destruction are well defined3-5, but whether immune-mediated cancer cell containment can be induced remains poorly understood. Here we show that depletion of transforming growth factor-β receptor 2 (TGFBR2) in CD4+ T cells, but not CD8+ T cells, halts cancer progression as a result of tissue healing and remodelling of the blood vasculature, causing cancer cell hypoxia and death in distant avascular regions. Notably, the host-directed protective response is dependent on the T helper 2 cytokine interleukin-4 (IL-4), but not the T helper 1 cytokine interferon-γ (IFN-γ). Thus, type 2 immunity can be mobilized as an effective tissue-level defence mechanism against cancer.


Conflict of interest statement

Competing Interests

MSKCC has filed a patent application with the U.S. Patent and Trademark Office directed toward methods and compositions for targeting TGF-β signaling in CD4+ helper T cells for cancer immunotherapy.

Figures

Extended Data Fig. 1 |
Extended Data Fig. 1 |. Blockage of TGF-β signaling in CD8+ T cells impacts their activation and differentiation.
a, Representative flow cytometry plots showing transforming growth factor-β receptor II (TGF-βRII) expression on CD4+ T cells and CD8+ T cells from the tumor-draining lymph nodes of Tgfbr2fl/flPyMT and CD8CreTgfbr2fl/flPyMT mice. The experiments were performed independently three times with similar results. b, Representative flow cytometry plots of CD62L and CD44 expression and statistical analyses of the gated populations among CD4+Foxp3- T cells (top panel), CD4+Foxp3+ T cells (middle panel) and CD8+ T cells (bottom panel) from the tumor-draining lymph nodes of Tgfbr2fl/flPyMT (n=4) and CD8CreTgfbr2fl/flPyMT (n=4) mice. c, Representative flow cytometry plots and statistical analyses of programmed cell death protein 1 (PD-1) and granzyme B (GzmB) expression in tumor-infiltrating CD8+ T cells from Tgfbr2fl/flPyMT (n=6) and CD8CreTgfbr2fl/flPyMT (n=10) mice. Data are represented as the mean ± SEM (biologically independent mice in b, c). Two-tailed unpaired t-test (b, c).
Extended Data Fig. 2 |
Extended Data Fig. 2 |. Blockage of TGF-β signaling in CD4+ T cells impacts their activation and differentiation and represses tumor growth.
a, Representative flow cytometry plots of YFP expression in lymph node TCRb+NK1.1-CD4+, TCRb+NK1.1-CD8+, TCRb-NK1.1+ and TCRγδ+ T cells isolated from ThPOKCreYFP mice. The experiments were performed independently three times with similar results. b, Transforming growth factor-β receptor II (TGF-βRII) expression on CD4+ T cells and CD8+ T cells from the tumor-draining lymph nodes of Tgfbr2fl/flPyMT and ThPOKCreTgfbr2fl/flPyMT mice. The experiments were performed independently three times with similar results. c, Representative flow cytometry plots of CD62L and CD44 expression and statistical analyses of the gated populations among CD4+Foxp3- T cells (top panel), CD4+Foxp3+ T cells (middle panel) and CD8+ T cells (bottom panel) from the tumor-draining lymph nodes of Tgfbr2fl/flPyMT (wild-type, WT; n=9) and ThPOKCreTgfbr2fl/flPyMT (knockout, KO; n=8) mice. d, Representative flow cytometry plots and statistical analyses of programmed cell death protein 1 (PD-1) and granzyme B (GzmB) expression in tumor-infiltrating CD8+ T cells from Tgfbr2fl/flPyMT (n=8) and ThPOKCreTgfbr2fl/flPyMT (n=8) mice. e, Representative flow cytometry plots of CD4 and CD8 expression in T cells from control mice or mice treated with anti-CD4 (αCD4). The experiments were performed independently twice with similar results. f, Tumor measurements of WT (n=3) and KO (n=3) mice treated with αCD4. Dashed line denote tumor burden of individual mice and solid lines indicate mean of tumor burden in a group of mice. Data are represented as the mean ± SEM (biologically independent mice in c, d). Two-tailed unpaired t-test (c, d, f). ns: not significant.
Extended Data Fig. 3 |
Extended Data Fig. 3 |. CD8 deficiency does not affect cancer cell death triggered by blockage of TGF-β signaling in CD4+ T cells.
a, Representative immunofluorescence images of E-Cadherin (green), Ki67 (red) and cleaved Caspase 3 (CC3, cyan) in tumor tissues from 23-week-old Tgfbr2fl/flPyMT and CD8CreTgfbr2fl/flPyMT mice. The percentage of Ki67+E-Cadherin+ cells over total E-Cadherin+ epithelial cells was calculated from 0.02 mm2 regions (n=9). The percentage of CC3+ areas over total E-Cadherin+ areas was calculated from 0.02 mm2 regions (n=9). b, Representative immunofluorescence images of E-Cadherin (green), Ki67 (red) and cleaved Caspase 3 (CC3, cyan) in tumor tissues from 23-week-old CD8−/−Tgfbr2fl/flPyMTT (CD8−/−) and CD8−/−ThPOKCreTgfbr2fl/flPyMT (CD8−/− knockout, CD8−/− KO) mice. The percentage of Ki67+ECadherin+ cells over total E-Cadherin+ epithelial cells was calculated from 0.02 mm2 regions (n=9). The percentage of CC3+ areas over total E-Cadherin+ areas was calculated from 0.02 mm2 regions (n=9). Data are represented as the mean ± SEM (biologically independent mice in a, b). Two-tailed unpaired t-test (a, b).
Extended Data Fig. 4 |
Extended Data Fig. 4 |. Blockage of TGF-β signaling in CD4+ T cells causes leukocyte exclusion from the tumor parenchyma and inhibits vasculature leakage in association with vasculature remodeling.
a, Representative immunofluorescence images of E-Cadherin (green), CD45 (red) and cleaved Caspase 3 (CC3, cyan) in tumor tissues from 23-week-old Tgfbr2fl/flPyMT (wild-type, WT) and ThPOKCreTgfbr2fl/flPyMT (knockout, KO) mice. Intratumoral (white arrows) and stromal (yellow arrows) CD45+ leukocytes were counted from 0.1 mm2 regions (n=8 for WT and KO tumor tissues from biologically independent mice). b, Representative images of Sulfo-NHS-biotin (white), CD31 (red) and E-Cadherin (green) and quantification of Sulfo-NHS-biotin density and cancer cell-associated Sulfo-NHS-biotin+ events (magenta arrows) in tumor tissues from 23-week-old WT and KO mice. The percentage of Sulfo-NHS-biotin+ areas (n=15) and cancer-cell associated deposition events (n=9) were calculated from 0.8 mm2 regions. c, Quantification of the volume of avascular regions from three-dimensional confocal CD31 staining images of tumor tissues from 23-week-old WT (n=9) and KO (n=9) mice. Data are represented as the mean ± SEM (biologically independent mice in a-c). Two-tailed unpaired t-test (a-c).
Extended Data Fig. 5 |
Extended Data Fig. 5 |. Blockage of TGF-β signaling in CD4+ T cells promotes expansion of CD4+Foxp3- T cells in tumor.
Representative flow cytometry plots of TCRβ, NK1.1, CD4, CD8 and Foxp3 expression and statistical analyses of the gated populations in tumor-infiltrating leukocytes from 23-week-old Tgfbr2fl/flPyMT (wild-type, WT; n=9) and ThPOKCreTgfbr2fl/flPyMT (knockout, KO; n=9) mice. Data are represented as the mean ± SEM (biologically independent mice). Two-tailed unpaired t-test.
Extended Data Fig. 6 |
Extended Data Fig. 6 |. IFN-γ deficiency does not impair cancer immunity triggered by blockage of TGF-β signaling in CD4+ T cells.
a, Representative flow cytometry plots of CD62L and CD44 expression and statistical analyses of the gated populations among CD4+Foxp3- T cells (top panel) and CD4+Foxp3+ T cells (bottom panel) from Ifng−/−Tgfbr2fl/flPyMT (Ifng−/−; n=3) and Ifng−/−ThPOKCreTgfbr2fl/flPyMT (Ifng−/− knockout, Ifng−/− KO; n=4) mice. b, Representative flow cytometry plots of TCRb, NK1.1, CD4, CD8 and Foxp3 expression and statistical analyses of the gated populations in tumor-infiltrating leukocytes from 23-week-old Ifng−/− (n=4) and Ifng−/− KO (n=5) mice. c, Representative immunofluorescence images of fibrinogen (Fg, white), CD31 (red), cleaved Caspase 3 (CC3, cyan) and E-Cadherin (green) in comparable individual tumors with sizes around 8×8 mm in length and width from 23-week-old Ifng−/− and Ifng−/− KO mice. Extravascular (EV) Fg deposition events (magenta arrows) were calculated from 1 mm2 regions (n=9 for Ifng−/− and Ifng−/− KO tumor tissues). Isolated CD31+ staining (yellow arrows) was counted from 1 mm2 regions (n=9 for Ifng−/− and Ifng−/− KO tumor tissues). d, Representative immunofluorescence images of a hypoxia probe (HPP, white), CD31 (red), cleaved Caspase 3 (CC3, cyan) and E-Cadherin (green) in tumors from Ifng−/− and Ifng−/− KO mice. The percentage of HPP+E-Cadherin+ regions over E-Cadherin+ epithelial regions was calculated from 1 mm2 regions (n=9 for Ifng−/− and Ifng−/− KO tumor tissues). The shortest distance of HPP+ regions (magenta dashed lines) or CC3+ regions (yellow dashed lines) to CD31+ endothelial cells was measured in tumor tissues from Ifng−/− KO mice (n=9). Data are represented as the mean ± SEM (biologically independent mice in a-d). Two-tailed unpaired (a-d) or paired (d) t-test.
Extended Data Fig. 7 |
Extended Data Fig. 7 |. IL-4 deficiency impairs cancer immunity triggered by blockage of TGF-β signaling in CD4+ T cells.
a, Representative flow cytometry plots of CD62L and CD44 expression and statistical analyses of the gated populations among CD4+Foxp3- T cells (top panel) and CD4+Foxp3+ T cells (bottom panel) from Il4−/−Tgfbr2fl/flPyMT (Il4−/−; n=4) and Il4−/−ThPOKCreTgfbr2fl/flPyMT (Il4−/− knockout, Il4−/− KO; n=6) mice. b, Representative flow cytometry plots of TCRβ, NK1.1, CD4, CD8 and Foxp3 expression and statistical analyses of the gated populations in tumor-infiltrating leukocytes from 23-week-old Il4−/− (n=5) and Il4−/− KO (n=7) mice. c, Representative immunofluorescence images of fibrinogen (Fg, white), CD31 (red), cleaved Caspase 3 (CC3, cyan) and E-Cadherin (green) in comparable individual tumors with sizes around 8×8 mm in length and width from 23-week-old Il4−/− and Il4−/− KO mice. Extravascular (EV) Fg deposition events (magenta arrows) were calculated from 1 mm2 regions (n=9 for Il4−/− and Il4−/− KO tumor tissues). Isolated CD31+ staining (yellow arrows) was counted from 1 mm2 regions (n=9 for Il4−/− and Il4−/− KO tumor tissues). d, Representative immunofluorescence images of a hypoxia probe (HPP, white), CD31 (red), cleaved Caspase 3 (CC3, cyan) and E-Cadherin (green) in tumors from Il4−/− and Il4−/− KO mice. The percentage of HPP+E-Cadherin+ regions over E-Cadherin+ epithelial regions was calculated from 1 mm2 regions (n=9 for Il4−/− and Il4−/− KO tumor tissues). Data are represented as the mean ± SEM (biologically independent mice in a-d). Two-tailed unpaired t-test (a-d).
Extended Data Fig. 8 |
Extended Data Fig. 8 |. Anti-tumor immunity triggered by TGF-β receptor II-deficient CD4+ T cells is dependent on IL-4.
a, 16 to 17-week-old PyMT mice bearing 5×5 mm tumors were transferred with CD4+CD25- T cells from Tgfbr2fl/fl (wild-type, WT; n=4), ThPOKCreTgfbr2fl/fl (knockout, KO; n=4), Il4−/−Tgfbr2fl/fl (Il4−/−; n=3) and Il4−/−ThPOKCreTgfbr2fl/fl (Il4−/− KO; n=3) mice on a weekly basis for 6 weeks. Tumor burden was measured and plotted. b, Representative immunofluorescence images of Ki67 (red) and cleaved Caspase 3 (CC3, cyan) in tumors from PyMT recipients transferred with WT, KO, Il4−/− or Il4−/− KO CD4+CD25- T cells for 6 weeks. The percentage of Ki67+E-Cadherin+ cells over total E-Cadherin+ epithelial cells was calculated from 0.02 mm2 regions (n=9). The percentage of CC3+ areas over total E-Cadherin+ areas was calculated from 0.02 mm2 regions (n=9). Data are represented as the mean ± SEM (biologically independent mice). Two-tailed unpaired t-test. c, Tumor measurements of WT (n=5), KO (n=4), anti-IL-4 (αIL-4)-treated WT (n=5), αIL-4-treated KO (n=4), anti-IFN-γ (αIFN-γ)-treated WT (n=3) and αIFN-γ-treated KO mice (n=3) inoculated with MC38 cancer cells. Dashed line denote tumor burden of individual mice and solid lines indicate mean of tumor burden in a group of mice (a, c). Two-tailed unpaired t-test (a, c). ***: P<0.001; **: P<0.01; and ns: not significant.
Extended Data Fig. 9 |
Extended Data Fig. 9 |. A Th2 cell gene expression signature stratifies cancer patients for survival probability.
a, A Th2 gene expression signature was used to perform survival analysis in TCGA Pan cancer cohort data (n=10002) and survival curves were plotted for the signature high group (top 50%; n=4996) and low group (bottom 50%; n=5006). The corresponding censored patient numbers are included in major time points. Two-tailed Logrank test. b, The Th2 gene signature enrichment score was estimated and plotted for each RNASeq sample of TCGA Pan cancer patients (n=10050). The middle line in the box indicates median and the bound indicates 25% quartile (Q1) and 75% quartile (Q3). The whisker reaches to the max/min point within the 1.5x interquartile range from either Q3 or Q1, respectively. c, The Th2 gene signature was used to perform survival analysis in low grade glioma (LGG; n=514) and glioblastoma multiforme (GBM; n=160), kidney chromophobe (KICH; n=65) and kidney renal clear cell carcinoma (KIRC; n=533) patients. The survival curves were plotted for the signature high group (top 50%) and low group (bottom 50%). The corresponding censored patient numbers are included in major time points. Two-tailed Logrank test. d, Representative immunofluorescence images of E-Cadherin (green) and CD31 (red) in KICH (n=4 patients) and KIRC (n=8 patients) tumor tissues. Isolated CD31+ staining was counted from 0.2 mm2 regions (n=9). The stromal regions are marked by dotted lines in KICH samples. Data are shown as mean ± SEM. Two-tailed unpaired t-test.
Extended Data Fig. 10 |
Extended Data Fig. 10 |. Blockage of TGF-β signaling in CD4+ T cells reprograms tumor vasculature and halts cancer progression.
In untransformed mammary glands, developmentally wired blood vasculature maintains a layer of healthy epithelium. In mammary tumors from control PyMT mice, sprouting angiogenesis is induced with an immature and leaky vasculature in support of cancer cell survival and tumor growth, which co-occurs with leukocyte infiltration to the tumor parenchyma. Blockage of TGF-β signaling in CD4+ T cells remodels the tumor vasculature with the endothelium ensheathed by pericytes and fibroblasts, concomitant with leukocyte exclusion from the tumor parenchyma. In addition, the vasculature pattern is reconfigured, which creates large avascular regions leading to cancer cell hypoxia and cancer cell death. Such a host-directed tissue-level cancer defense response is dependent on the type 2 cytokine interleukin 4.
Fig. 1 |
Fig. 1 |. Blockage of TGF-β signaling in CD4+ T cells suppresses tumor development independent of CD8+ T cells.
a, Tumor measurements of Tgfbr2fl/flPyMT (n=8) and CD8CreTgfbr2fl/flPyMT (n=7) mice. Two-tailed unpaired t-test. b, Tumor measurements of Tgfbr2fl/flPyMT (n=7), ThPOKCreTgfbr2fl/flPyMT (n=6), CD8−/−Tgfbr2fl/flPyMT (n=5), CD8−/−ThPOKCreTgfbr2fl/flPyMT (n=6) and Foxp3CreTgfbr2fl/flPyMT (n=5) mice. Two-tailed unpaired t-test. Dashed lines indicate total tumor burden from individual mice and solid lines indicate mean of total tumor burden from all mice in a group. ****: P<0.0001 and ns: not significant.
Fig. 2 |
Fig. 2 |. Blockage of TGF-β signaling in CD4+ T cells triggers cancer cell death in association with T cell stromal localization.
a, Representative immunofluorescence images of E-Cadherin (green), Ki67 (red) and cleaved Caspase 3 (CC3, cyan) in tumor tissues from 23-week-old Tgfbr2fl/flPyMT (wild-type, WT) and ThPOKCreTgfbr2fl/flPyMT (knockout, KO) mice. The percentage of Ki67+E-Cadherin+ cells over total E-Cadherin+ epithelial cells was calculated from 0.02 mm2 regions (n=10 and 7 for WT and KO tumor tissues, respectively). The percentage of CC3+ areas over total E-Cadherin+ areas was calculated from 0.02 mm2 regions (n=10 for WT and KO tumor tissues). b, Representative immunofluorescence images of E-Cadherin (green), CD4 (red), CD3 (white) and CC3 (cyan) in tumor tissues from 23-week-old WT and KO mice. Intratumoral (white arrows) and stromal (yellow arrows) CD4+ T cells were counted from 0.1 mm2 regions (n=8 for WT and KO tumor tissues). Data are represented as the mean ± SEM (biologically independent mice in a, b). Two-tailed unpaired t-test (a, b).
Fig. 3 |
Fig. 3 |. Blockage of TGF-β signaling in CD4+ T cells induces tumor tissue healing, vessel reorganization and hypoxia-associated cancer cell death.
a, Representative immunofluorescence images of fibrinogen (Fg, white), CD31 (red), cleaved Caspase 3 (CC3, cyan) and E-Cadherin (green) in comparable individual tumors with sizes around 8×8 mm in length and width from 23-week-old Tgfbr2fl/flPyMT (wild-type, WT) and ThPOKCreTgfbr2fl/flPyMT (knockout, KO) mice. Extravascular (EV) Fg deposition events (magenta arrows) were calculated from 1 mm2 regions (n=9 for WT and KO tumor tissues). Isolated CD31+ staining (yellow arrows) was counted from 1 mm2 regions (n=6 for WT and KO tumor tissues). b, Representative immunofluorescence images of NG2 (white), CD31 (red), GP38 (cyan) and E-Cadherin (green) in tumors from WT and KO mice. NG2-unbound (magenta arrows) or GP38-unbound (yellow arrows) isolated CD31+ staining was counted from 1 mm2 regions (n=9 for WT and KO tumor tissues). c, Representative immunofluorescence images of collagen IV (Col IV, white), CD31 (red), fibronectin (FN, cyan) and E-Cadherin (green) in tumors from WT and KO mice. The average continuous lengths of Col IV and FN were measured in 1 mm2 regions (n=9 for WT and KO tumor tissues). d, Representative immunofluorescence images of a hypoxia probe (HPP, white), CD31 (red), CC3 (cyan) and E-Cadherin (green) in tumors from WT and KO mice. The percentage of HPP+E-Cadherin+ regions over E-Cadherin+ epithelial regions was calculated from 1 mm2 regions (n=9 for WT and KO tumor tissues). The shortest distance of HPP+ regions (magenta dashed lines) or CC3+ regions (yellow dashed lines) to CD31+ endothelial cells was measured in tumor tissues from KO mice (n=9). Data are represented as the mean ± SEM (biologically independent mice in a-d). Two-tailed unpaired (a-d) or paired (d) t-test. The dashed boxes coupled with dashed lines show high magnification of selected tissue regions.
Fig. 4 |
Fig. 4 |. Cancer immunity triggered by blockage of TGF-β signaling in CD4+ T cells is dependent on IL-4, but not IFN-γ.
a, Representative flow cytometry plots and statistical analyses of IL-4 and IFN-γ expression in CD4+Foxp3- T cells from the tumor-draining lymph nodes of 23-week-old Tgfbr2fl/flPyMT (wild-type, WT; n=8) and ThPOKCreTgfbr2fl/flPyMT (knockout, KO; n=8) mice. Data are represented as the mean ± SEM (biologically independent mice). Two-tailed unpaired t-test. b, Tumor measurements of Ifng−/−Tgfbr2fl/flPyMT (Ifng−/−, n=5), Ifng−/−ThPOKCreTgfbr2fl/flPyMT (Ifng−/−KO, n=7), Il4−/−Tgfbr2fl/flPyMT (Il4−/−, n=5) and Il4−/−ThPOKCreTgfbr2fl/flPyMT (Il4−/−KO, n=6) mice. Dashed lines indicate tumor burden from individual mice and solid lines indicate mean of tumor burden from all mice in a group. ****: P<0.0001; and ns: not significant.
Fig. 5 |
Fig. 5 |. IL-4 promotes a Th2 cell gene expression program in TGF-βRII-deficient CD4+ T cells.
The transcriptome of tumor-infiltrating CD4+CD25- T cells from 23-week-old Tgfbr2fl/flPyMT (wild-type, WT), ThPOKCreTgfbr2fl/flPyMT (knockout, KO), Il4−/−Tgfbr2fl/flPyMT (Il4−/−) and Il4−/−ThPOKCreTgfbr2fl/flPyMT (Il4−/−KO) mice were assessed by RNA sequencing. The mean expression FPKM value of differentially expressed genes (DEGs) that were upregulated in KO compared to WT or Il4−/−KO samples were calculated and plotted. The ratio between mean FPKM value of one group and average of mean FPKM values of all 4 groups were further calculated. Representative DEGs were grouped based on the localization and function of their encoded proteins.

Comment in

References

    1. Iwasaki A & Medzhitov R Control of adaptive immunity by the innate immune system. Nat Immunol 16, 343–353, 10.1038/ni.3123 (2015). - DOI - PMC - PubMed
    1. Gause WC, Wynn TA & Allen JE Type 2 immunity and wound healing: evolutionary refinement of adaptive immunity by helminths. Nat Rev Immunol 13, 607–614, 10.1038/nri3476 (2013). - DOI - PMC - PubMed
    1. Matsushita H et al. Cancer exome analysis reveals a T-cell-dependent mechanism of cancer immunoediting. Nature 482, 400–404, 10.1038/nature10755 (2012). - DOI - PMC - PubMed
    1. DuPage M, Mazumdar C, Schmidt LM, Cheung AF & Jacks T Expression of tumour-specific antigens underlies cancer immunoediting. Nature 482, 405–409, 10.1038/nature10803 (2012). - DOI - PMC - PubMed
    1. Dadi S et al. Cancer Immunosurveillance by Tissue-Resident Innate Lymphoid Cells and Innate-like T Cells. Cell 164, 365–377, 10.1016/j.cell.2016.01.002 (2016). - DOI - PMC - PubMed

Methods References

    1. Mucida D et al. Transcriptional reprogramming of mature CD4(+) helper T cells generates distinct MHC class II-restricted cytotoxic T lymphocytes. Nat Immunol 14, 281–289, 10.1038/ni.2523 (2013). - DOI - PMC - PubMed
    1. Donkor MK, Sarkar A & Li MO Tgf-beta1 produced by activated CD4(+) T Cells Antagonizes T Cell Surveillance of Tumor Development. Oncoimmunology 1, 162–171, 10.4161/onci.1.2.18481 (2012). - DOI - PMC - PubMed
    1. Ouyang W, Beckett O, Ma Q & Li MO Transforming growth factor-beta signaling curbs thymic negative selection promoting regulatory T cell development. Immunity 32, 642–653, 10.1016/j.immuni.2010.04.012 (2010). - DOI - PMC - PubMed
    1. Sarkar A, Donkor MK & Li MO T cell- but not tumor cell-produced TGF-beta1 promotes the development of spontaneous mammary cancer. Oncotarget 2, 1339–1351 (2011). - PMC - PubMed
    1. Zamarin D et al. PD-L1 in tumor microenvironment mediates resistance to oncolytic immunotherapy. The Journal of clinical investigation 128, 5184, 10.1172/JCI125039 (2018). - DOI - PMC - PubMed

Publication types

MeSH terms

Substances