. 2020 Nov;587(7833):291-296.
doi: 10.1038/s41586-020-2843-2. Epub 2020 Oct 21.

DNA mismatches reveal conformational penalties in protein-DNA recognition

Affiliations

DNA mismatches reveal conformational penalties in protein-DNA recognition

Ariel Afek et al. Nature. 2020 Nov.

Abstract

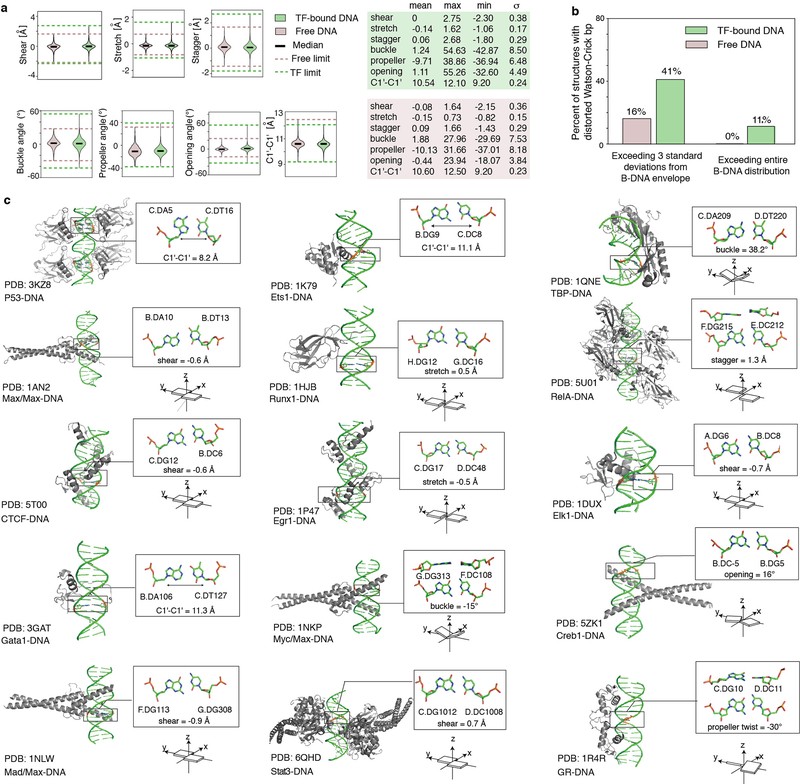
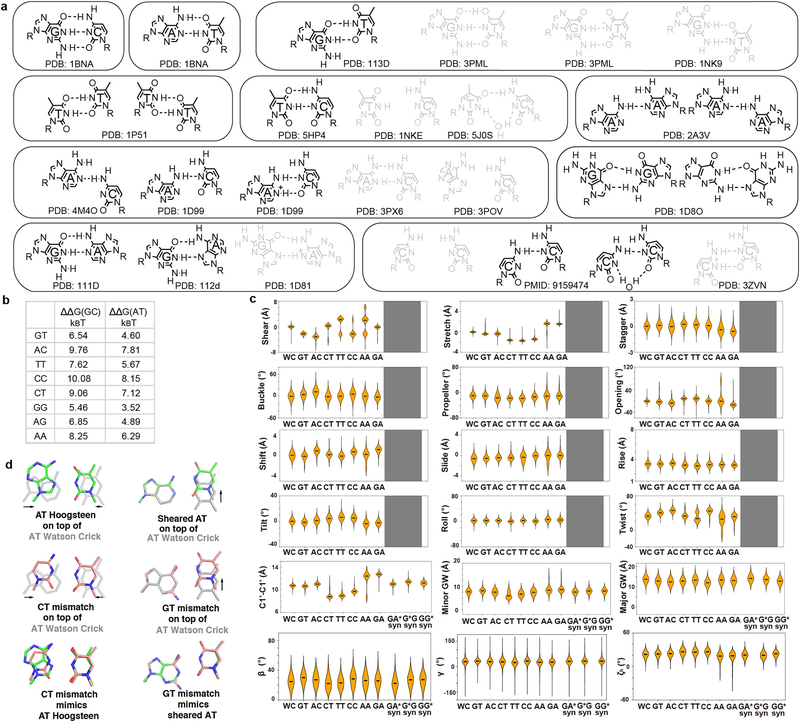
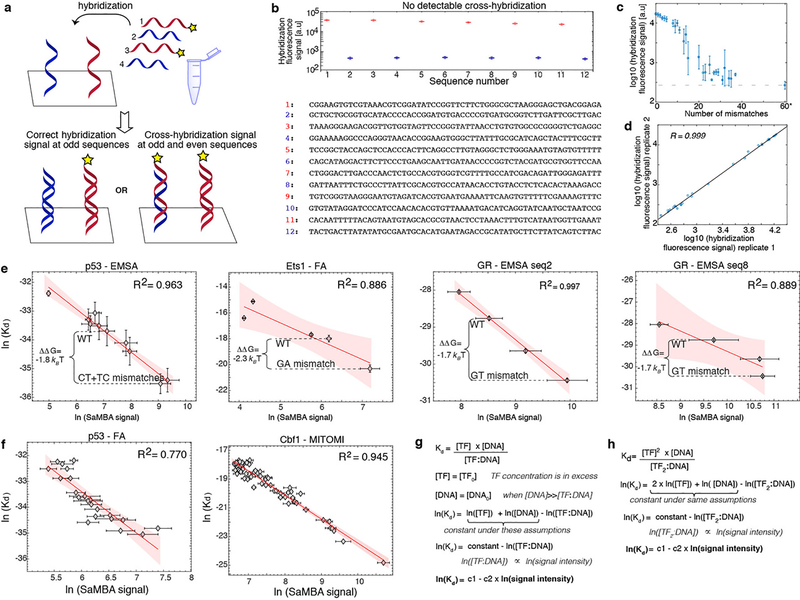
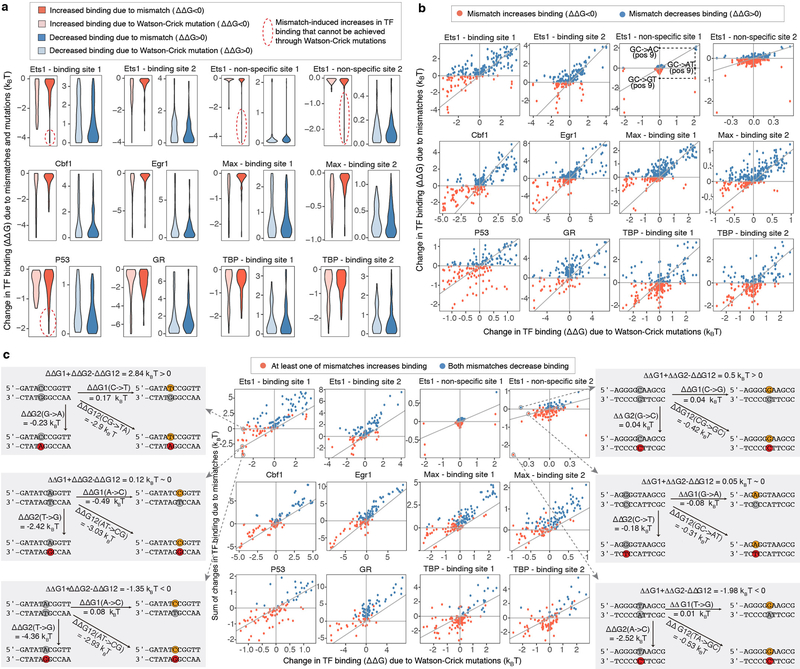
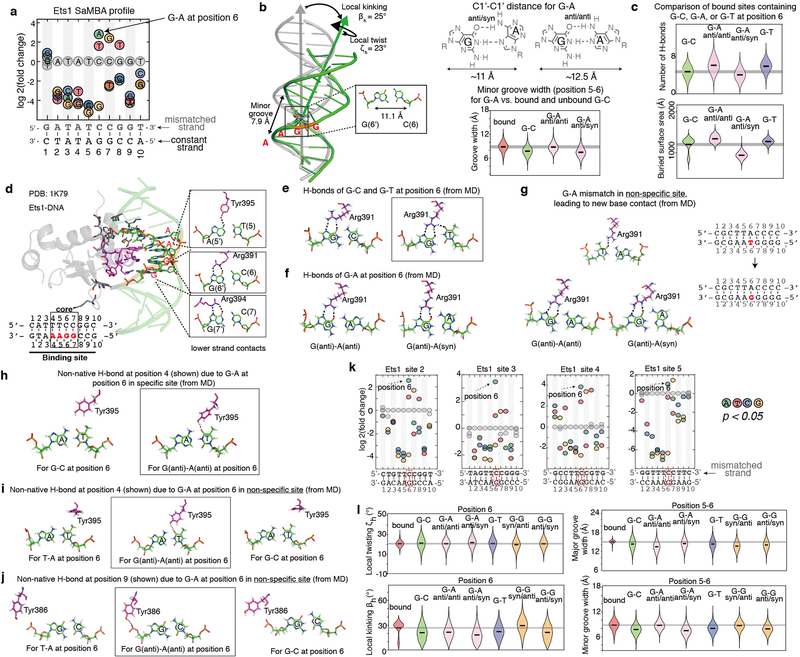
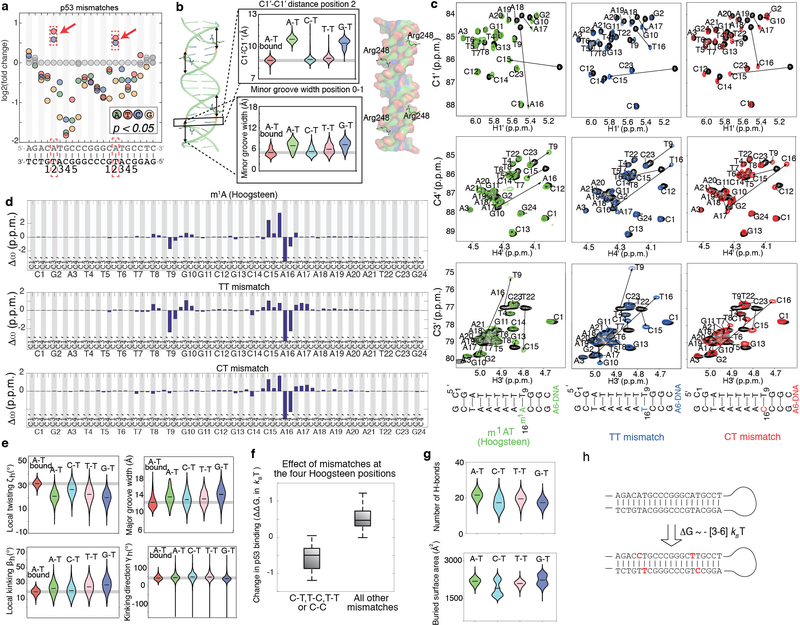
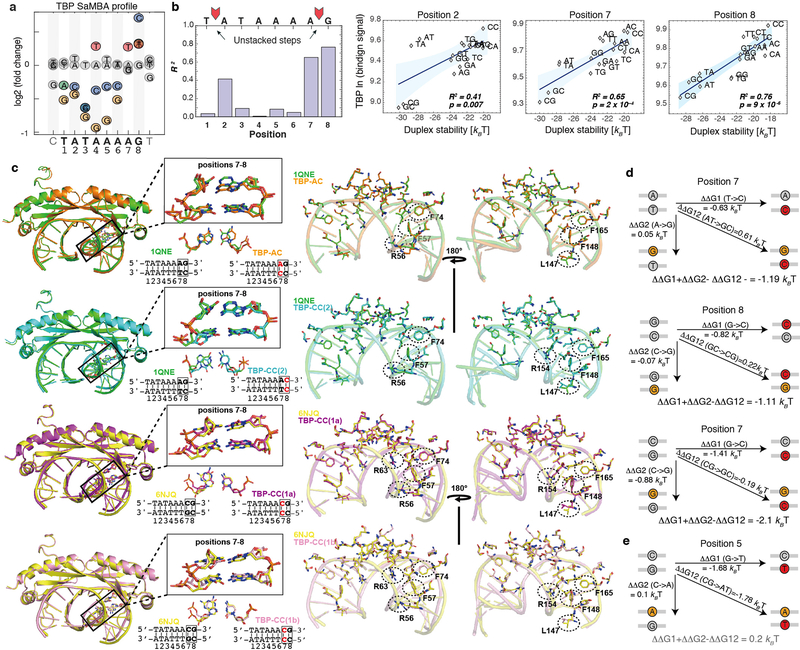
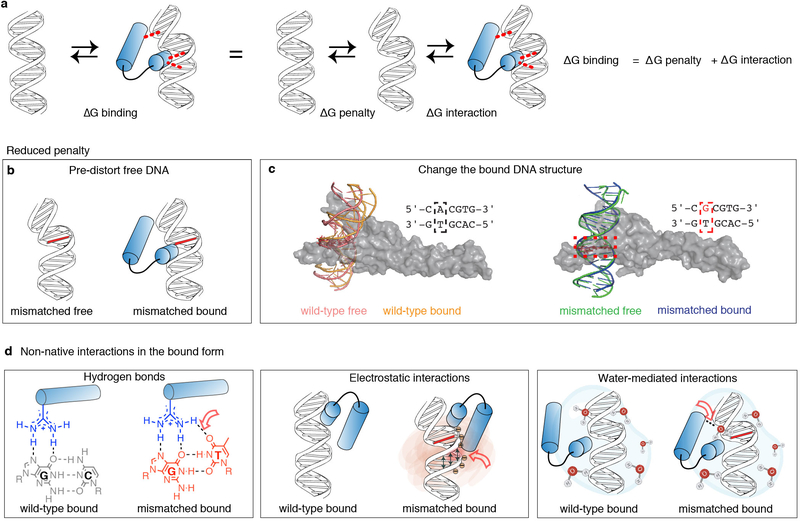
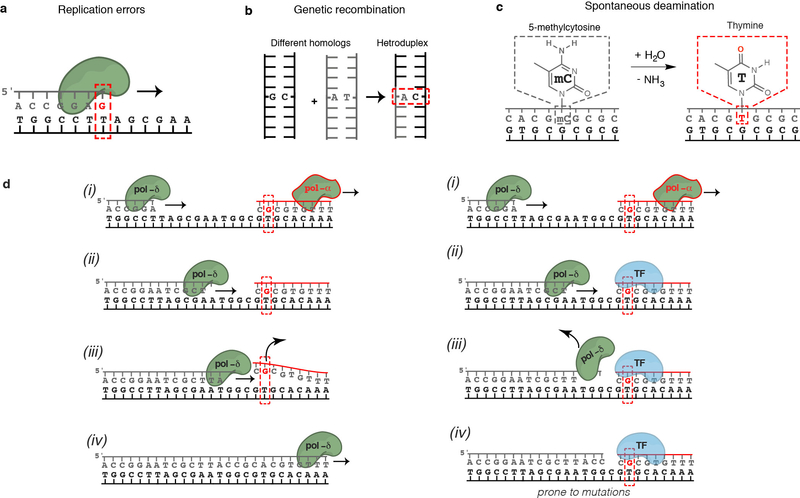
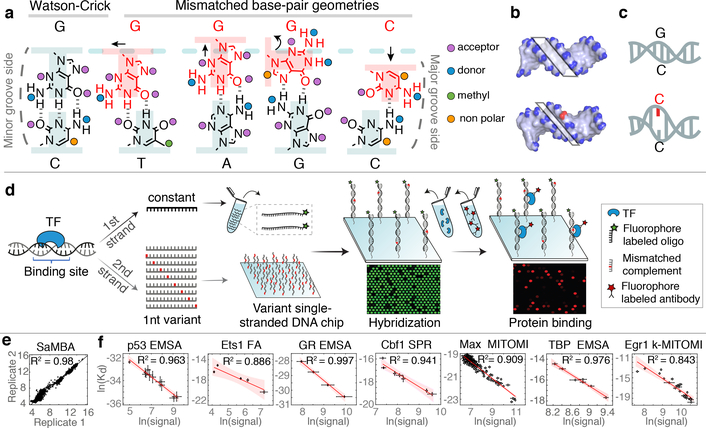
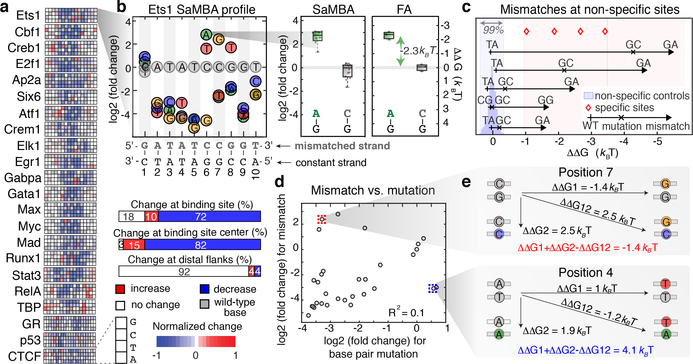
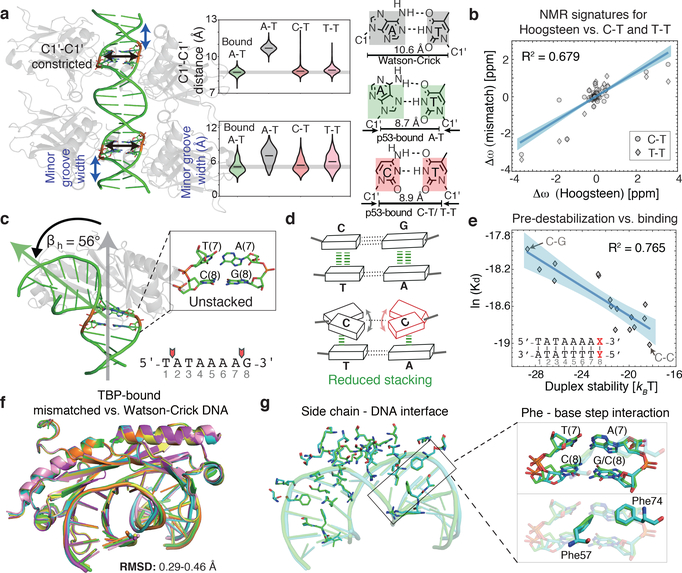
Transcription factors recognize specific genomic sequences to regulate complex gene-expression programs. Although it is well-established that transcription factors bind to specific DNA sequences using a combination of base readout and shape recognition, some fundamental aspects of protein-DNA binding remain poorly understood1,2. Many DNA-binding proteins induce changes in the structure of the DNA outside the intrinsic B-DNA envelope. However, how the energetic cost that is associated with distorting the DNA contributes to recognition has proven difficult to study, because the distorted DNA exists in low abundance in the unbound ensemble3-9. Here we use a high-throughput assay that we term SaMBA (saturation mismatch-binding assay) to investigate the role of DNA conformational penalties in transcription factor-DNA recognition. In SaMBA, mismatched base pairs are introduced to pre-induce structural distortions in the DNA that are much larger than those induced by changes in the Watson-Crick sequence. Notably, approximately 10% of mismatches increased transcription factor binding, and for each of the 22 transcription factors that were examined, at least one mismatch was found that increased the binding affinity. Mismatches also converted non-specific sites into high-affinity sites, and high-affinity sites into 'super sites' that exhibit stronger affinity than any known canonical binding site. Determination of high-resolution X-ray structures, combined with nuclear magnetic resonance measurements and structural analyses, showed that many of the DNA mismatches that increase binding induce distortions that are similar to those induced by protein binding-thus prepaying some of the energetic cost incurred from deforming the DNA. Our work indicates that conformational penalties are a major determinant of protein-DNA recognition, and reveals mechanisms by which mismatches can recruit transcription factors and thus modulate replication and repair activities in the cell10,11.


Conflict of interest statement

Ethics declaration

The authors declare no competing interests.

Figures

Extended Data Figure 1.
(a) Distributions of base pair parameters in free and TF-bound DNA, from PDB survey. Solid lines denote the median value of each parameter. Dashed lines denote the upper and lower bounds of the distribution for free (pink) and bound (green) DNA. 613 TF-bound structures and 409 free B-DNA structures, all with resolution < 3 Å, were used in the analysis (Methods). (b) Percentage of structures with base pairs outside the B-DNA envelope. Among the 613 TF-bound structures, 41.1% (i.e. 252) contain severe distortions of at least one base pair outside the free B-DNA envelope, with the envelope defined as at most 3 standard deviations above or below the mean. Only 16% (i.e. 65) of the free B-DNA structures satisfy this criterion. (Using a less stringent definition of the B-DNA envelope, by considering 2 standard deviations above or below the mean, we found that 80.8% of the TF-bound structures contain at least one base pair outside the free B-DNA envelope, approximately twice the frequency observed in free DNA, which was 41.8%.) Considering the full range of base pair parameter values as defining the free B-DNA envelope, we found that 11.3% (i.e. 69) of the TF-bound structures contain at least one base pair with an extreme deformation that was never observed in any free DNA structure. (c) Local deformations of base pairs observed in diverse TF-DNA complex structures. Left: 3D structures with the distorted base pairs highlighted in black boxes. Upper right: enlarged view of the base pair structures with their base pair parameters labeled. Lower right: schematic diagram of the corresponding base pair parameters.
Extended Data Figure 2.
(a) Base pairing geometry of Watson-Crick base pairs and mismatches, obtained from a survey of crystal structures in the PDB. Mismatches with modified bases and those that were metal-mediated were excluded from analysis (Methods). Predominant base pairing geometries under neutral pH conditions are shown in black. Minor geometries are shown in grey. (b) Melting energies for DNA mismatches relative to G-C and A-T Watson-Crick base pairs. See Methods for details. (c) Distributions of structural parameters in Watson-Crick and mismatched DNA, from MD simulations. Solid lines denote the median value of each parameter. Observations from the MD simulation results: (1) G-T retains wobble geometry during the MD simulation, with sheared conformation (|shear| around 2 Å) accompanied by a slight stretch. (2) T-T shows wobble geometry with sheared conformation (|shear| around 2 Å). Different from G-T, the T-T mismatch shows rapid dynamic equilibrium of both wobble geometries with either one of the Ts shifted to the minor groove direction. Despite this rapid dynamic equilibrium, the T-T base pair is still constricted with C1′-C1′ distance 8–9.5 Å. (3) Similar to T-T, the C-T mismatch is also constricted with two H-bonds stably formed for most of the time. However, C-T mismatch can transiently adopt a high-energy conformation with only one H-bond and is not constricted anymore (C1′-C1′ distance ~10 Å), potentially due to the close contact between T-O2 and C-O2. The entire C-T MD trajectory is comprised of approximately 5% of these high-energy species. (4) C-C is partially constricted with C1′-C1′ distance around 9.8 Å due to unstable H-bonding. (5) All pyrimidine-pyrimidine mismatches are stacked in the helix without swing out of the helix in the MD trajectories. (6) G-G does not experience anti-syn equilibrium during the simulation. The C1′-C1′ distance of G-G (G(syn)-G(anti) or G(anti)-G(syn)) is around 11.2–11.5 Å, which is larger than the canonical G-C base pair. (7) G(anti)-A(syn) is not constricted (C1′-C1′ distance around 11Å) and G(anti)-A(anti) reveals large C1′-C1′ distance around 12.8 Å. Base pair and base step parameters of bases with syn conformation (marked with *) were not computed, and are thus greyed out, due to an ill-defined coordinate frame (Methods). The C1’-C1’ distance is shown, since it is not affected by the change of coordinate frame. (d) Mismatches can mimic distorted base-pair geometries observed in protein-bound DNA. Figure shows overlays of distorted (colored) and idealized WC (grey) base pairs from 3DNA (top); mismatches (colored) and idealized WC (gray) base pairs (middle); and mismatched and distorted WC base pairs (right). The mismatched conformations are of free DNA and were obtained from MD simulations (Methods). The C-T mismatch can mimic an A-T Hoogsteen base pair by constricting the C1′-C1′ distance (taken from PDB: 3KZ8). The G-T mismatch can mimic a sheared A-T base pair by shifting the T to the major groove direction (taken from PDB: 4MZR).
Extended Data Figure 3.
Extended Data Figure 3.. Validation and calibration of SaMBA measurements.
(a) Schematic representation of our experimental workflow to detect cross-hybridization. To check whether certain oligonucleotides hybridize with non-target complementary oligonucleotides, we designed an experiment in which only certain oligonucleotides (red) were labeled. If significant cross-hybridization occurred, we would have detected fluorescent signal on the chip even for sequences without fluorescent complements in the hybridization solution (i.e. for the sequences shown in blue). (b) No significant cross-hybridization was detected. Bottom: list of 12 sequences used in the hybridization solution of one SaMBA experiment (red: fluorescently-labeled oligonucleotides; blue: unlabeled). Top: fluorescent signal from the hybridization of these 12 sequences on the chip. For the sequences on the chip for which their complement is not labeled, the fluorescent signal is practically undetectable (blue), and it is several orders of magnitude lower than the sequences with a labeled complementary strand (red). Boxplots show median signals over replicate DNA spots, with the bottom and top edges of each box indicating the 25th and 75th percentiles, respectively. The whiskers extend to the most extreme data points not considered outliers. (c) The effect of mismatches on hybridization. To estimate the efficiency of our hybridization protocol, we measured the hybridization signal of one specific sequence (sequence #3 for library v1; see Methods, Supplementary Table 10), to different sequences containing multiple mismatches (0 to ~40), and a completely different sequence (‘60*’). As expected, the hybridization was less efficient for sequences with large numbers of mismatches. However, for small numbers of mismatches the hybridization was highly efficient. Longer incubation time, higher oligonucleotide concentration, and normalization of the signal could enable the use of SaMBA for larger numbers of mismatches. Plot shows medians and standard deviations over all sequences containing the same number of mismatches, with 6 replicate spots per sequence. Mismatches were introduced randomly by generating N random base changes (N=1–5,10,15,25,35,45) to sequence #3, and repeating the procedure ten times for each N. This led to duplexes with 1 to 37 mismatches compared to the original sequence. (d) Hybridization signal is highly reproducible. The correlation of hybridization signals between two replicate experiments was very high (R2=0.99). Plot shows median values, computed over 6 replicate spots, based on data shown in panel (c). (e) Validation of mismatch effects by orthogonal methods. For p53, Ets1, and GR proteins, the log-transformed SaMBA binding intensities correlate with independent affinity measurements performed on mismatched and non-mismatched DNA sites (Methods). Similarly to PBM experiments, median values over all replicates were used for SaMBA (n=10 replicate spots); error bars show the median absolute deviation. Average values over replicates were used for the orthogonal methods (n=6 independent measurements for p53, and 3 independent measurements for Ets1 and GR), with error bars showing the standard deviation. Red shaded region: 95% confidence interval for Pearson’s correlation. Binding free energy differences (ΔΔG) are shown between native Watson-Crick binding sites and the highest increase in binding due to a mismatch. Two SaMBA sites were tested for GR (see Methods). (f) Correlation between binding data obtained by SaMBA versus independent methods. For SaMBA data the plots show the median values over replicate spots (n=10 replicate spots), with error bars showing the median absolute deviation. For independent data (Methods) the plots show the binding affinities as reported in the respective papers. Red shaded region: 95% confidence interval for Pearson’s correlation. (g) Standard equilibrium thermodynamics equations demonstrate that the logarithm of the dissociation constant (KD) of the TF:DNA complex is linearly proportional to the logarithm of the TF:DNA complex florescence signal, under certain conditions in which the TF concentration and the free DNA concentration are in excess compared to the concentration of the bound complex (and those remain constant during the reaction). (h) Similar to (g), for cases in which the DNA-bound species is a dimer.
Extended Data Figure 4.
Extended Data Figure 4.. Comparing the effects of mutations versus mismatches on TF binding.
(a) The magnitude of the energetic effects of mutations (light colors) and mismatches (dark colors) is similar. The effects were computed for all 7 proteins with available calibration data in our study, and for a total of 12 DNA sites (Methods). The effects of mismatches were calculated relative to the two closest Watson-Crick sequences (e.g. for a G-T mismatch the closest Watson-Crick base pairs are G-C and A-T; the mismatch plots include both ΔΔG(G-C -> G-T) and ΔΔG(A-T -> G-T)). (b) Mismatches and their corresponding mutations have different, even opposite effects on TF binding. Each mutation is compared to the two closest mismatches (e.g. G-C -> A-T is compared to both G-C -> A-C and G-C -> G-T). Upper left quadrant: mutations increase binding, mismatches decrease binding. Upper right quadrant: both mutations and mismatches decrease binding. Lower left quadrant: both mutations and mismatches increase binding. Lower right quadrant: mutations decrease binding, mismatches increase binding. X-axis and Y-axis show calibrated binding measurements computed from the median SaMBA signal intensities (over n=10 replicate spots). (c) Comparing the effect of mutations versus the cumulative effects of the two closest mismatches. Points close to the diagonal correspond to cases where the effect of the mutation is approximately equal (within experimental noise) to the sum of the effects of the two mismatches. Points above the diagonal correspond to cases where Watson-Crick mutations have either a more beneficial or a less detrimental effect on TF binding compared to the cumulative effect of the two mismatches. Points below the diagonal correspond to cases where Watson-Crick mutations have either a less beneficial or a more detrimental effect on TF binding compared to the cumulative effect of the two mismatches. X-axis and Y-axis show calibrated binding measurements computed from the median SaMBA signal intensities (over n=10 replicate spots). Please see Supplementary Table 4 for the raw binding data used to compute the measurements shown in this figure.
Extended Data Figure 5.
Extended Data Figure 5.. The effects of mismatches on Ets1-DNA binding.
(a) SaMBA profile for an Ets1 binding site, highlighting the G-A mismatch at position 6, which shows the largest increase in binding affinity. (b) Distortions. In the bound Ets1-DNA complex (PDB ID: 1K79), the positions where the recognition helix is inserted into the DNA major groove are significantly distorted, with bending (βh=23°) towards the major groove, local unwinding (ζh=23°), and minor groove widening. Position 6, the middle position of the GGA core binding region, is highlighted to show the expanded C1’-C1’ distance. The G-A mismatch at this position mimics the C1’-C1’ distance of the bound DNA. Violin plots of the MD simulation data show that the G-A mismatch in anti-anti configuration also mimic the minor groove width of the bound G-C. (c) Base readout. According to MD simulation results, G-A (anti/anti) and G-T mismatches increase the overall number of H-bonds and the buried surface area at the Ets1-DNA interface, compared to the Watson-Crick G-C pair (Methods). (d) Ets1-DNA interface in the GGAA core binding region. Contacting residues in the recognition helix are shown in magenta. Direct H-bond contacts with the bases are highlighted; such contacts occur only at the GGA bases, on the “lower” strand of the shown Watson-Crick DNA site. (e,f) Representative snapshots of different H-bond interactions between Arg391 and the base pair at position 6, from molecular dynamics (MD) simulations. The G-T mismatch shows an additional H-bond compared to G-C and G-A. (g) In a non-specific site where G-A increases the affinity to reach the specific range, MD simulations show that the G-A mismatch forms H-bonds similar to those formed in specific sites (shown in panel f). (h) Non-native H-bond at position 4, due to the G-A mismatch at position 6 in the specific Ets1 binding site. (i,j) Non-native H-bond interactions created in a non-specific site (panel g) at positions neighboring the positions of the mismatch, either with the base (i) or the backbone (j). (k) SaMBA profiles for additional Ets1 binding sites. We measured the effect of mismatches in four Ets1 binding sites in addition to the one shown in panel a. Although the profiles for different sites are quantitatively different and dependent on the flanks, the trends for increased binding due to mismatches are similar. For all cases, the A-G mismatch at position 6 significantly increases Ets1 binding. (l) Structural features at the mismatch position. Violin plots show the local twisting and kinking at position 6, and the minor and major groove width at position 5–6 of Ets1-bound DNA, as well as the naked DNA for different base-pairs, according to MD.
Extended Data Figure 6.
Extended Data Figure 6.. The effects of mismatches on p53-DNA binding.
(a) Mismatch profile for p53 reveals that increased TF binding occurs only due to C-T and T-T mismatches (red rectangle) at the same positions where the Hoogsteen conformation is observed in p53-DNA complexes (PDB ID: 3KZ8). (b) MD simulation-based violin plots of C1’- C1’ distance at position 2, as well as the minor grove width (at position 0–1), for p53-bound DNA and naked DNA (wild-type and mismatched) reveals that the minor groove for C-T and T-T mismatches is more similar to the bound form compared to the free A-T base pair. Plot also shows that the G-T mismatch, which reduces p53 binding, does not mimic these distortions seen in the bound DNA. Notably, a narrower minor grove at position 0–1 was previously suggested to be important for the interaction of the DNA with the Arg248 residue in p53. (c,d) NMR validation showing that T-T and C-T mimic the reduced C1’-C1’ distance observed in p53-bound DNA,. (c) Chemical shift overlays of the 2D HSQC NMR spectra of the C1’-H1’, C4’-H4’ and C3’-H3’ regions for A6-DNA m1A in which the m1AT base pair is in the Hoogsteen conformation (left, green), A6-DNA TT (middle, blue) and A6-DNA CT (right, red) with unmodified A6-DNA (black) at pH 6.9, 25 °C. (d) Bar plots of the individual chemical shift differences (relative to unmodified A6-DNA) of the C1’/C3’/C4’ carbons of A6-DNA m1A (top), A6-DNA TT (middle) and A6-DNA CT (bottom). Similarity between the Hoogsteen induced chemical shift differences and mismatch shifts (relative to the Watson-Crick wild-type) are observed for both T-T and C-T. (e) Additional comparisons of global features (twisting angle, local kinking, and kinking direction at position 2 and major groove width at position 0–1) reveal additional mimicry between C-T mismatch and the Hoogsteen conformation local twisting angle. (f) Pyrimidine-pyrimidine mismatches (C-T, T-C, T-T and C-C) in all 4 positions in which Hoogsteen conformation is observed (n=16 mismatches total), increased p53 binding. However, all other mismatches at these positions (n=32 mismatches total) decreased p53 binding, or had non-significant effects. ΔΔG represent the differences between the p53-DNA binding energy of each mismatch versus the WT sequence, and were estimated using the calibration with EMSA measurements (Methods). Boxplots show median signals over all mismatches, with the bottom and top edges of each box indicating the 25th and 75th percentiles, respectively. The whiskers extend to the most extreme data points not considered outliers. (g) Number of p53-DNA H-bonds and buried surface area at p53-DNA interface, obtained from MD simulations, failed to explain the observed increase in p53 binding, consistent with the pre-paying mechanism being an important determinant for binding in this case. (h) DNA hairpin with 4 mismatches (in the 4 positions for which the Hoogsteen conformation was previously observed), strongly binds p53: 3–6 kBT stronger (depending on the data used for validation, Supplementary Tables 3, 4) compared to the highest-affinity p53 binding sites previously reported. Notably, we expect the difference in binding affinity to other genomic p53 sites (ΔΔG) to be even larger since most p53 binding sites in the genome are of lower binding affinities.
Extended Data Figure 7.
Extended Data Figure 7.. The effects of mismatches on TBP-DNA binding.
(a) Mismatch profile for TBP. (b) Correlations between TBP binding levels and DNA duplex stability were computed over all 16 base-pair variants at positions 1 to 8 in the TBP site. Bar-plots (left) represent the squared Pearson correlation coefficient (R2) at each position. For the only three positions with significant correlations (positions 2, 7, and 8) the scatter plot correlation is presented (right), with binding signals representing medians over 9 replicate spots. Blue shaded regions: 95% confidence interval for Pearson’s correlation. The sequences of the Watson-Crick and mismatched base pairs are shown in each scatter plot (e.g. for position 8, GC stands for the wild-type G-C base-pair underlined in the TBP site TATAAAAG, CC stands for C-C at this position, etc.). Remarkably, these high correlations are observed only in the unstacked base step positions. (c) Left: structural overlays between TBP-DNA complexes with DNA mismatches (TBP-AC, orange; TBP-CC(2), cyan; TBP-CC(1a), purple; TBP-CC(1b), pink) and their corresponding Watson-Crick counterparts with single base substitutions (1QNE, green; 6NJQ, yellow). The base steps at position 7–8 are zoomed in and highlighted in black boxes. The structural overlay of the mismatch and the Watson-Crick base pairs are shown below each box, with their DNA sequences. Right: overlays of protein-DNA interfaces of TBP-DNA complexes, comparing mismatched and Watson-Crick sites. Four Phenylalanines, as well as other amino acids that are discussed in Supplementary Discussion are highlighted with dashed circles. (d) Comparisons of the effects of Watson-Crick mutations versus the cumulative effects of the two closest mismatches, shown for the mismatches with new crystal structures. In all three cases the mismatches have significantly larger effects than the Watson-Crick mutations (see also Methods and Supplementary Table 4). ΔΔG values for TBP_site_1 in Supplementary Table 4 were used in these comparisons. (e) Example of a Watson-Crick mutation whose effect is similar (within experimental error, Supplementary Table 4) to the sum of the two closest mismatches. ΔΔG values for TBP_site_1 in Supplementary Tables 4 were used in these comparisons.
Extended Data Figure 8.
Extended Data Figure 8.. Potential mechanisms for mismatch-enhanced TF binding.
(a) TF-DNA complex formation involves creation of intermolecular interactions, as well as DNA conformational changes. Thermodynamically, these processes can be separated into two independent events, and thus an increase in binding affinity could stem from additional interactions (decrease of ΔGinteraction), and/or reduction in the penalty to change the DNA conformation (decrease of ΔGpenalty). (b) A reduction in the energetic penalty to distort the DNA (ΔGpenalty) could originate from DNA conformational changes due to the mismatch, i.e. prior to binding (for example p53 and TBP, as described in the main text). (c) A reduction in the energetic penalty for DNA distortion (ΔGpenalty) could also originate from changes in the bound DNA. For example, molecular dynamics simulations of the DNA conformations in free form and in the Myc-DNA complex (for the wild-type A-T and the mismatch G-T) suggest that the reduced penalty in this case is primarily due to changes in the mismatched bound form. The extent of overlap of the kinking direction (γh) obtained from the MD simulations was: Ω=0.34 (WT) versus Ω=0.15 for the G-T mismatch, and was analyzed using a revised Jensen-Shannon divergence score (Ω). Representative structures of the DNA sites are shown for WT free (pink), WT bound (orange), G-T free (green), G-T bound (blue). The Myc/Max heterodimer is shown as a gray surface. (d) Mismatches could lead to the formation of non-native interactions such as hydrogen bonds (left), electrostatic potential and shape sensing (center), and water-mediated interactions (right). Red empty arrows point to the locations of the change. These changes could occur directly at the position of the mismatched base (for example the G-T mismatch for Ets1), as well as at the positions of other bases and/or the backbone, due to non-native structures (for example the G-A mismatch for Ets1). Notably, mismatches not only alter the potential interacting chemical groups of the replaced base, but can also alter the relative orientation of the interacting bases (as observed for the T in the Wobble geometry on the left).
Extended Data Figure 9.
Extended Data Figure 9.. DNA mismatches in the cell.
(a) Mismatches can result from misincorporation of bases during DNA replication by DNA polymerases. The average rate at which replication errors are generated and escape proofreading is low in healthy cells (~10−9), but high in certain cancers and cells with Pol-ε/Pol-δ mutations. Even in healthy cells, the rates of generation of individual mismatches vary by more than a million-fold depending on the sequence context and the type of mismatch. (b) Mismatches result from genetic recombination. A characteristic feature of homologous recombination is the exchange of DNA strands, which results in the formation of heteroduplex DNA. Mismatches can result from genetic recombination when the parental chromosomes contain non-identical sequences. In addition, mismatches can arise during DNA synthesis associated with recombination repair. The repair of these mismatches might be less efficient since it was previously shown that there is a strong temporal coupling between DNA replication and mismatch repair but a lack of temporal coupling for heteroduplex rejection. (c) Spontaneous deamination is common and estimated to occur 100–500 times per cell per day in humans. G-T mismatches generated by deamination of 5-Methylcytosine (5-meC) are not repaired by the MMR pathway and have considerably lower repair efficiency. The high rate of 5-meC deamination combined with their relatively slow repair in mammalian cells, contribute to making 5-meC a preferential target for point mutations (about 40-fold) compared to other nucleotides in the genome, and one of the major sources of the frequent C to T mutations observed in human cells. (d) Transcription factors bound to mismatched DNA could interfere with Pol-δ strand displacement activity. Left: DNA synthesized by non-proofreading mismatch-prone Pol-α is normally displaced by the proofreading non-error-prone Pol-δ. Right: Reijns et al. recently demonstrated that increased mutation signals arise from regions synthesized by Pol-α that contain TF binding sites. They suggested mismatched DNA synthesized by non-proofreading Pol-α is rapidly bound by TFs that act as barriers to Pol-δ displacement of Pol-α-synthesized DNA, resulting in locally increased mutation rates in subsequent rounds of replication.
Figure 1.
Figure 1.. SaMBA measures the effects of mismatches on protein-DNA binding in high throughput.
(a-c) Mismatches change the local DNA geometry (a), affect global features such as the minor groove width (b), and destabilize the DNA (c). (d) SaMBA is a chip-based assay for testing TF binding to thousands of DNA mismatches and Watson-Crick sequences (Methods). DNA hybridization and protein-DNA binding are quantified using fluorophore-labeled oligos and antibodies, respectively. (e) Reproducibility of SaMBA data, for technical replicates of Ets1 at 125nM. Axes show the base 2 logarithm of the median fluorescent intensity signal corresponding to the bound Ets1 protein (n=12 replicate spots for Watson-Crick sequence, and 8 for mismatched sequences). (f) Protein binding levels measured by SaMBA correlate linearly with independent Kd measurements from a variety of experimental methods, allowing calibration of SaMBA data. Similarly to related array-based techniques, median values over replicate DNA spots are shown for SaMBA (error bars: median absolute deviation). Average values over replicates are shown for the orthogonal methods (error bars: standard deviation, when available). See Methods for the number of replicates (n>=3) for each experiment. Red shaded region: 95% confidence interval for Pearson’s correlation.
Figure 2.
Figure 2.. The effects of DNA mismatches on TF binding.
(a) SaMBA profiles for the 22 tested TFs. Heatmaps show the effects of mismatches on TF binding, normalized so −1 corresponds to the largest decrease (Methods). (b) SaMBA profile for Ets1, with a representative mismatch-induced binding increase that was independently validated by fluorescence anisotropy (FA). Y-axis: log2 fold-change in median signal intensity, relative to the Watson-Crick site. Colored circles: significant changes (p-value < 0.05, one-sided Mann-Whitney U-test with Benjamini-Hochberg correction). Boxplots show median signals over replicate DNA spots for SaMBA (n=8 or 12 for the mismatch and Watson-Crick site, respectively) and replicate experiments for EMSA (n=3). Boxes extend to the 25th and 75th percentiles. Whiskers extend to the most extreme data points. (c) Five validated examples of mismatches in non-specific sequences that increase Ets1 binding to levels similar to specific sites (Methods). Each arrow corresponds to one mismatch in a particular non-specific sequence (Supplementary Table 2c). In some cases, Watson-Crick mutations also increase binding affinity, albeit to a smaller extent, indicating that the identity of the newly introduced base is important for enhanced binding affinity (Supplementary Table 2, Extended Data Fig. 5). (d) Comparison of mismatch versus mutations effects for the Ets1 site in (b), for mismatches on the upper strand. Values represent medians over replicate spots (n=8). (e) The energetic effects of base pair mutations (diagonal) are different from the sum of the energetic effects of the two corresponding mismatches, demonstrating deviations from an additive model.
Figure 3.
Figure 3.. DNA mismatches that exhibit geometries similar to distorted base pairs in TF-bound DNA lead to increased binding affinity.
(a) p53-DNA crystal structure shows a constricted Hoogsteen conformation at the positions marked in red. C-T and T-T mismatches, which increase p53-DNA binding affinity, mimic Hoogsteen base pairing by constricting the C1′-C1′ distance and minor groove width. Violin plots show the distributions of the C1′-C1′ distance and minor groove width according to MD simulation data (Methods). (b) NMR results confirm that T-T and C-T mismatches mimic Hoogsteen A-T geometry. Plot shows the chemical shift differences in the sugar C1’/C3’/C4’ carbons for T-T and C-T mismatches versus a locked Hoogsteen conformation (using N1-methyladenosine), relative to the Watson-Crick base-paired duplex (Methods). Blue shaded region: 95% confidence interval for Pearson’s correlation. (c) TBP-DNA crystal structure shows destabilization at an ApG base pair step (positions 7–8) critical for TBP binding,,. βh = bending magnitude (Methods). (d) C-C mismatch destabilizes the DNA and has the lowest stacking propensity. (e) High correlation between TBP binding levels (medians over 9 replicate spots) and DNA duplex stability (Methods), computed over all base-pair variants at position 8 in the TBP site suggests that pre-paying the energetic cost for melting this base-pair modulates TBP binding affinity. Blue shaded region: 95% confidence interval for Pearson’s correlation. (f) Structural overlay of six TBP-DNA complex structures demonstrates nearly identical structures for all complexes. Green: 1QNE, Watson-Crick site 5’-TATAAAAG-3’. Cyan: TBP-CC(2), 5’-TATAAAAG-3’ with CC at position 8. Orange: TBP-AC, 5’-TATAAAAG-3’ with AC at position 7. Yellow: 6NJQ, Watson-Crick site 5’-TATAAACG-3’. Purple: TBP-CC(1a) and pink: TBP-CC(1b), 5’-TATAAACG-3’ with CC at position 7. (g) Overlay of the TBP-DNA interfaces (for 1QNE and TBP-CC(2)) demonstrates that interactions are highly similar between Watson-Crick and mismatched sites, including Phe interactions at the position of the mismatch (black rectangle).

Comment in

Similar articles

Cited by

References

    1. Rohs R et al. Origins of specificity in protein-DNA recognition. Annu. Rev. Biochem 79, 233–269, (2010). - PMC - PubMed
    1. Siggers T & Gordan R Protein–DNA binding: complexities and multi-protein codes. Nucleic Acids Res. 42, 2099–2111, (2013). - PMC - PubMed
    1. Guéron M, Kochoyan M & Leroy J-L A single mode of DNA base-pair opening drives imino proton exchange. Nature 328, 89, (1987). - PubMed
    1. Nikolova EN et al. Transient Hoogsteen base pairs in canonical duplex DNA. Nature 470, 498, (2011). - PMC - PubMed
    1. Fischer M, Coleman RG, Fraser JS & Shoichet BK Incorporation of protein flexibility and conformational energy penalties in docking screens to improve ligand discovery. Nat. Chem 6, 575, (2014). - PMC - PubMed

METHODS REFERENCES

    1. Berman HM et al. The protein data bank. Nucleic Acids Res. 28, 235–242, (2000). - PMC - PubMed
    1. Zhou H et al. New insights into Hoogsteen base pairs in DNA duplexes from a structure-based survey. Nucleic Acids Res. 43, 3420–3433, (2015). - PMC - PubMed
    1. Lu X-J, Bussemaker HJ & Olson WK DSSR: an integrated software tool for dissecting the spatial structure of RNA. Nucleic Acids Res. 43, e142–e142, (2015). - PMC - PubMed
    1. Sathyamoorthy B et al. Insights into Watson–Crick/Hoogsteen breathing dynamics and damage repair from the solution structure and dynamic ensemble of DNA duplexes containing m1A. Nucleic Acids Res. 45, 5586–5601, (2017). - PMC - PubMed
    1. El Hassan M & Calladine C Two distinct modes of protein-induced bending in DNA. J. Mol. Biol 282, 331–343, (1998). - PubMed

Publication types