. 2020 Nov;587(7832):152-156.
doi: 10.1038/s41586-020-2829-0. Epub 2020 Oct 21.

Single-particle cryo-EM at atomic resolution

Affiliations

Single-particle cryo-EM at atomic resolution

Takanori Nakane et al. Nature. 2020 Nov.

Abstract

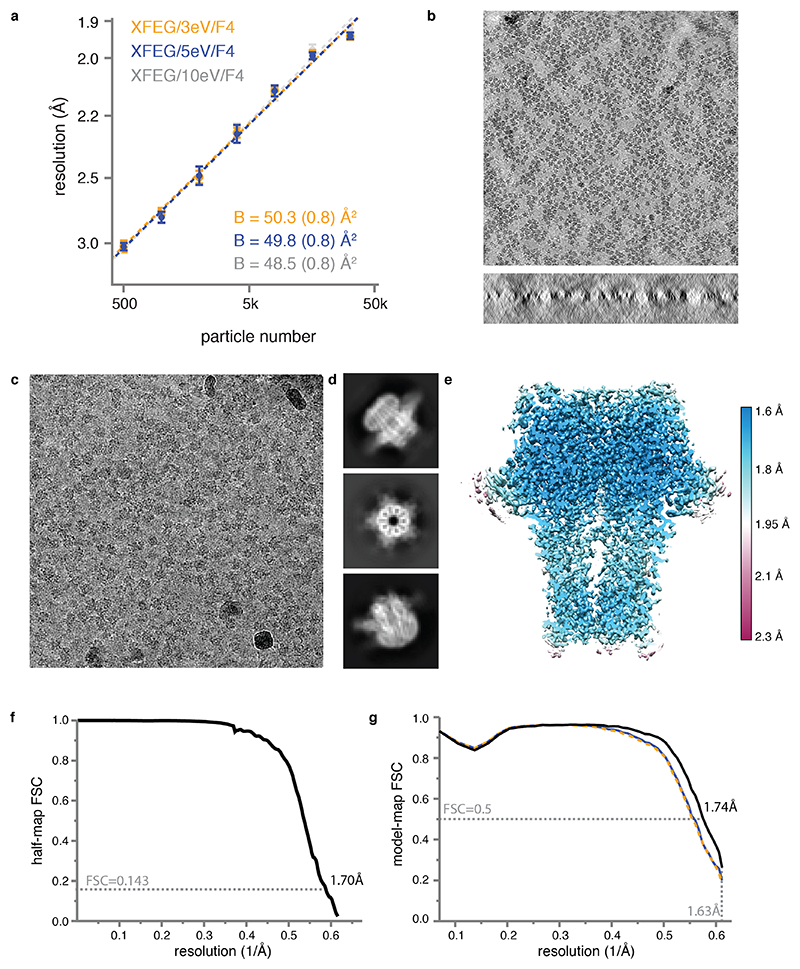
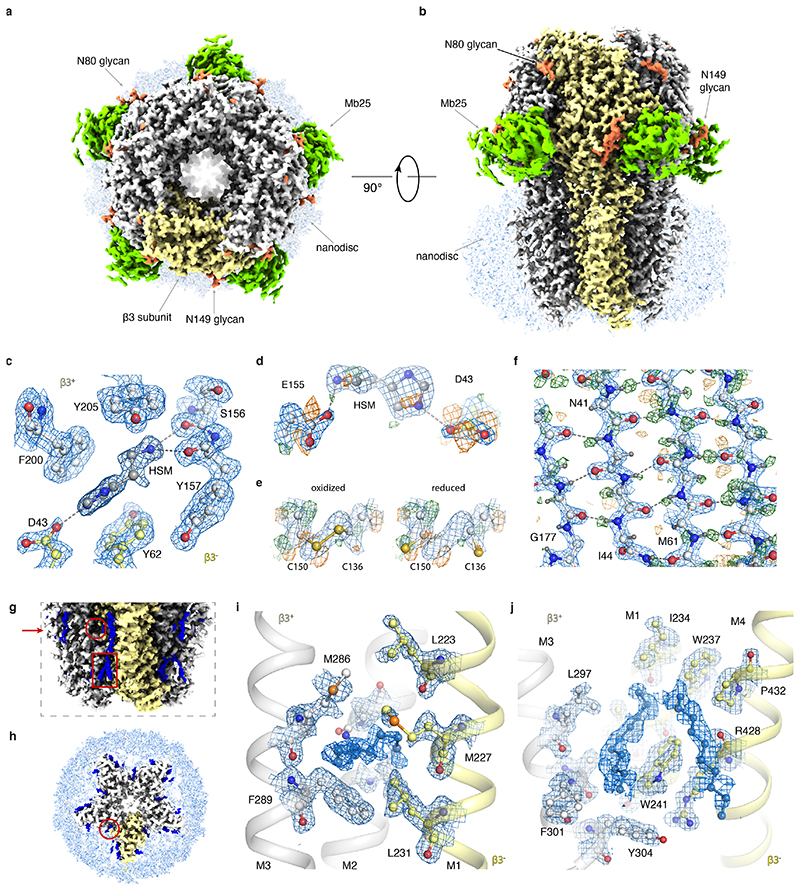
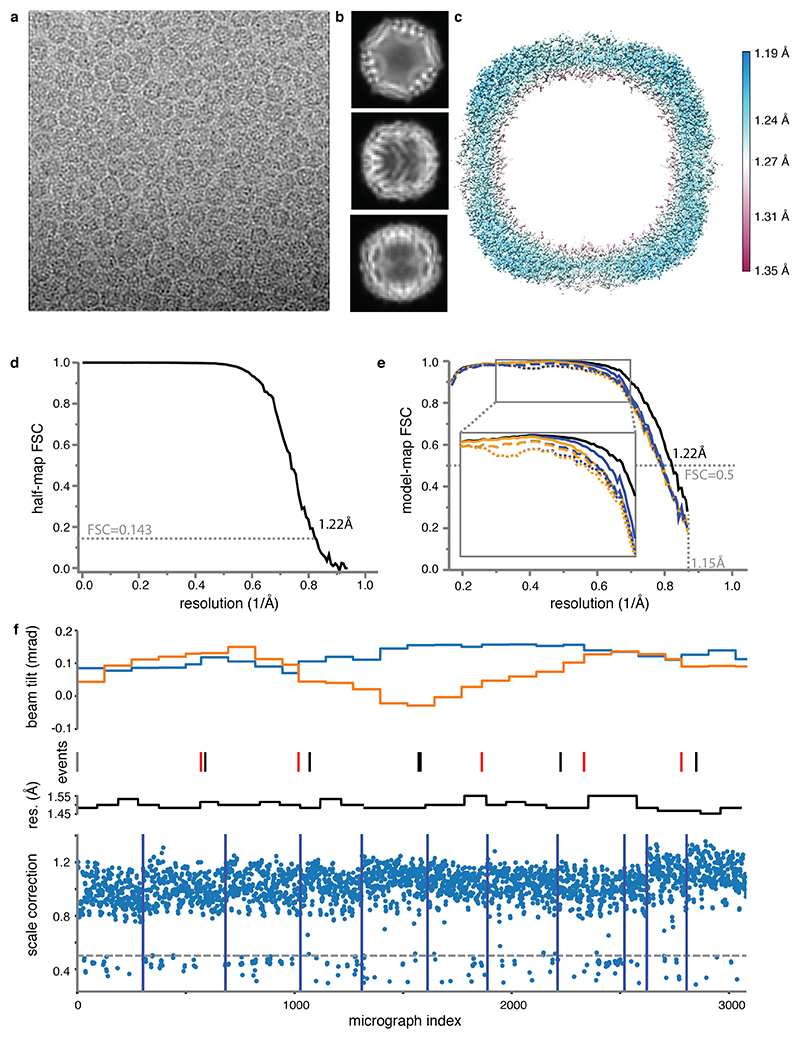
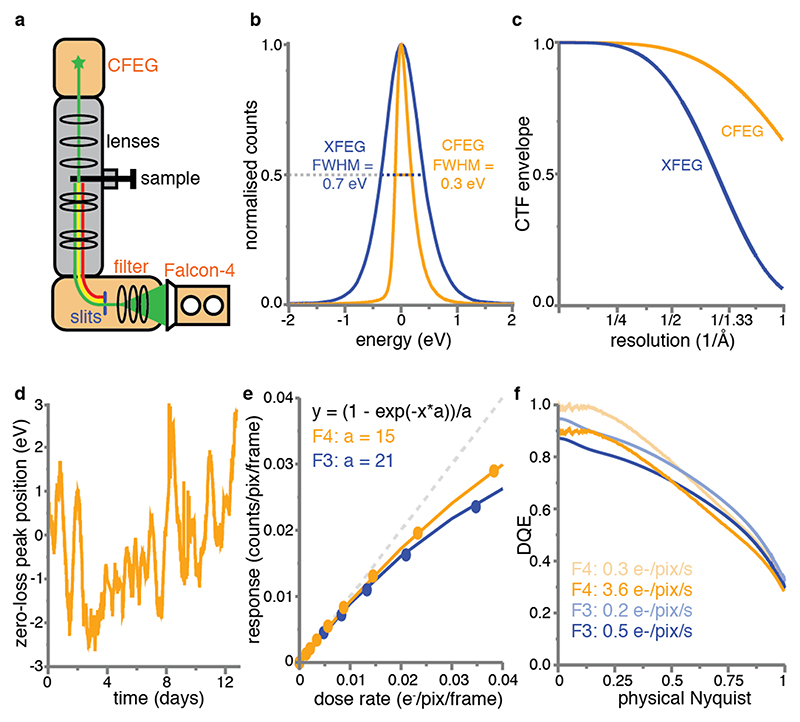
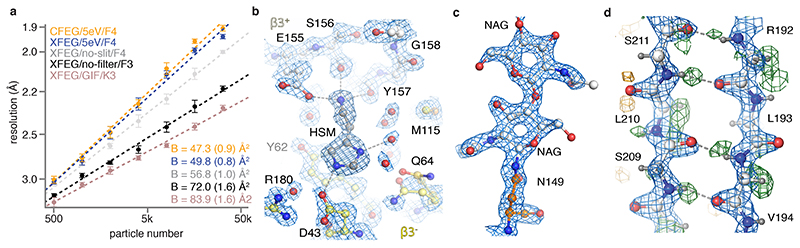
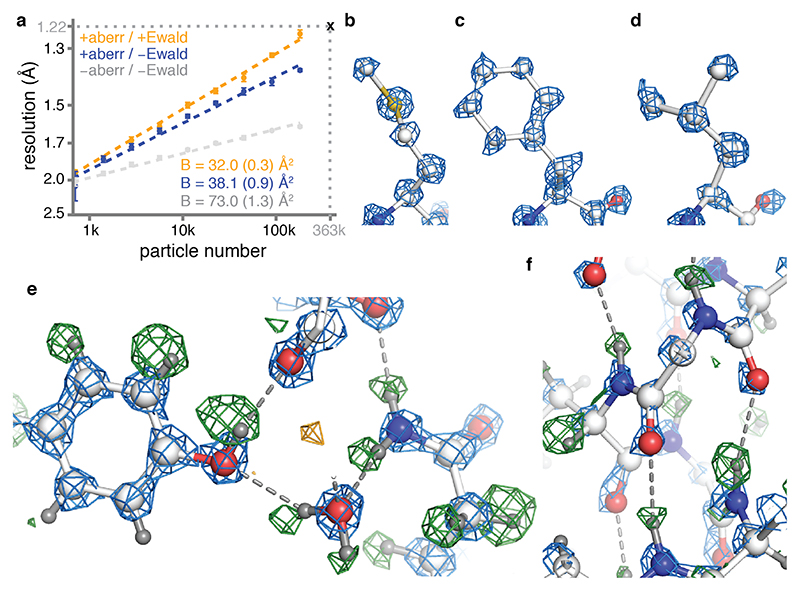
The three-dimensional positions of atoms in protein molecules define their structure and their roles in biological processes. The more precisely atomic coordinates are determined, the more chemical information can be derived and the more mechanistic insights into protein function may be inferred. Electron cryo-microscopy (cryo-EM) single-particle analysis has yielded protein structures with increasing levels of detail in recent years1,2. However, it has proved difficult to obtain cryo-EM reconstructions with sufficient resolution to visualize individual atoms in proteins. Here we use a new electron source, energy filter and camera to obtain a 1.7 Å resolution cryo-EM reconstruction for a human membrane protein, the β3 GABAA receptor homopentamer3. Such maps allow a detailed understanding of small-molecule coordination, visualization of solvent molecules and alternative conformations for multiple amino acids, and unambiguous building of ordered acidic side chains and glycans. Applied to mouse apoferritin, our strategy led to a 1.22 Å resolution reconstruction that offers a genuine atomic-resolution view of a protein molecule using single-particle cryo-EM. Moreover, the scattering potential from many hydrogen atoms can be visualized in difference maps, allowing a direct analysis of hydrogen-bonding networks. Our technological advances, combined with further approaches to accelerate data acquisition and improve sample quality, provide a route towards routine application of cryo-EM in high-throughput screening of small molecule modulators and structure-based drug discovery.


Conflict of interest statement

Competing interest statement

A.K., S.M., L.Y., D.K., E.V.P., E.d.J., J.K., M.B., J.M., and P.T are employees of Thermo Fisher Scientific.

Figures

Extended Data Figure 1
Extended Data Figure 1. Characteristics of the new cryo-EM technology.
(a) Four consecutive measurements of the CFEG beam current over a period of nine hours. The FEG tip was flashed just before the start of each measurement. (b) The dose at the sample as measured for the same four experiments in (a).
Extended Data Figure 2
Extended Data Figure 2. Cryo-EM for GABAAR.
(a) B-factor plots for three data sets using an X-FEG, the new energy filter with a slit width of 3eV (orange), 5eV (blue) and 10 eV (grey) and a Falcon 4 camera. (b) Two orthogonal views of an electron tomogram for ice thickness measurement. Scale bar is 50 nm. (c) Representative electron micrograph from the CFEG dataset. Scale bar is 30 nm. (d) A selection of 2D class average images. (e) Local resolution map. (f) Fourier Shell Correlation (FSC) between the two independently refined half-maps. (g) FSC between the model and the map calculated for the model refined against the full reconstruction (black); the model refined in the first half-map against that half-map (FSCwork; blue); and the model refined in the first half-map against the second half-map (FSCtest; dashed orange). Atomic models were refined including spatial frequencies up to 1.63 Å.
Extended Data Figure 3
Extended Data Figure 3. GABAAR reconstruction details.
(a) The GABAAR cryo-EM map viewed from the extracellular space (top view). The density of one subunit of the homopentamer is highlighted in yellow; glycans are orange; the nanobody domain of Mb25 green; and the lipid nanodisc light blue. (b) As in b), but viewed parallel to the plasma membrane space (side view). (c) Stacking of histamine with aromatic residues in the ligand-binding pocket. Water molecules removed for clarity. (d) Radiation damage in the ligand-binding pocket illustrated by difference maps of Asp43 and Glu155 carboxyl groups. (e) Radiation damage causes partial reduction of the disulfide bond between Cys136 and Cys150. Left panel: oxidized state, right panel: reduced state. Only Cα, Cβ and sulphur atoms depicted for clarity. (f) Difference map revealing the hydrogen bonding network between β-strands. (g) A close-up view of the lipids (blue) surrounding the transmembrane region of the receptor. Compared to (a-b), the contour level is decreased. Red arrow indicates section level as depicted in panel (h). The general anaesthetics pocket and the neurosteroid modulation site are indicated by the red circle and rectangle, respectively. (h) Top-view of a transverse section through the GABAAR transmembrane region shows semi-ordered lipids surrounding individual subunits. (i) Close-up view of the general anaesthetics pocket. (j) Close-up view of the neurosteroid modulation site. Lipids in (i) and (j) could not be identified unambiguously and therefore are modelled as aliphatic chains.
Extended Data Figure 4
Extended Data Figure 4. Cryo-EM for apoferritin.
(a) Representative electron micrograph. Scale bar is 20 nm. (b) 2D class average images. (c) Local resolution map. (d) Fourier Shell Correlation (FSC) between the two independently refined half-maps. (e) FSC between the model and the map as calculated for the model refined against the full reconstruction against that map (black); the model refined in the first half-map against that half-map (FSCwork; blue); and the model refined in the first half-map against the second half-map (FSCtest; dashed orange). FSCwork and FSCtest curves are shown for three different models: with hydrogens and anisotropic B-factors (solid lines); with hydrogens and isotropic B-factors (dashed lines); and without hydrogens and with isotropic B-factors (dotted lines). Including hydrogens and using anisotropic B-factors gives a better fit to the data at medium resolution, but lead to a small amount of overfitting at high resolution. Atomic models were refined including spatial frequencies up to 1.15 Å. (f) The beam tilt in X (blue) and Y (orange); the resolution (res.) for subsets of 5,000 consecutive particles (black); and RELION’s rlnGroupScaleCorrection values for individual micrographs (blue dots) during the data acquisition experiment. Events like CFEG flashing (red), liquid nitrogen filling (black) and moving the grid to another grid square (dark blue) are indicated with vertical lines. The cutoff in scale correction values used to discard part of the micrographs is indicated with a dashed grey line.
Extended Data Figure 5
Extended Data Figure 5. Electrostatic potential of hydrogen atoms.
(a) Calculated profile (see Methods) of the electrostatic scattering potential along the bond between a carbon and a hydrogen atom, for a B-value of 10 Å2 and resolutions (d) of 1.0 Å (orange), 1.2 Å (blue), 1.5 Å (grey) and 1.8 Å (black). The two vertical lines indicate the electron-carbon distance of 0.98 Å and the proton-carbon distance of 1.09 Å. (b) As in (a), but for a resolution of 1.2 Å and B-values of 5 Å2, 10 Å2, 15 Å2 and 20 Å2. (c) Distances from the carbon atom (in Å) at which the calculated profile of the electrostatic scattering potential along the bond between a carbon and a hydrogen atom is at its maximum, for different resolutions (d) and B-values.
Figure 1
Figure 1. New imaging technologies for cryo-EM.
(a) Schematic overview of an electron cryo-microscope. The new cold field-emission gun (CFEG), energy filter and Falcon-4 camera are highlighted in orange. (b) Energy spread of the XFEG (blue) and the CFEG (orange), with the full width of the curves at half their maximum value (FWHM). (c) Theoretical CTF envelope functions for the XFEG (blue) and the CFEG (orange). (d) The relative position of the zero-loss peak with respect to the centre of the slits in the energy filter over multiple days of operation. (e) Dose response measurements for the Falcon-3 (blue dots) and Falcon-4 (orange dots). The orange and blue lines are the corresponding fits to the data, with the fit parameters indicated in the same colours; the dashed grey line represents the perfect response. Note that the X-axis units are per camera frame, while the Falcon-4 and Falcon-3 read out at operate at 248 and 40 frames per second, respectively. (f) DQE curves for the Falcon-3 at a dose rate of 0.2 (light blue) and 0.5 e-/pixel/s (blue) and the Falcon-4 at a dose rate of 0.3 (light orange) and 3.6 e-/pixel/s (orange).
Figure 2
Figure 2. GABAAR reconstructions.
(a) B-factor plots for four data sets using: the new CFEG, the new energy filter with a slit width of 5 eV and a Falcon-4 camera (orange); an XFEG, the new energy filter with a slit width of 5 eV and a Falcon-4 (blue); an XFEG, the new energy filter with the slits retracted and a Falcon-4 (grey); an XFEG, no energy filter and a (bottom-mounted) Falcon-3 detector (black); and an XFEG, a Gatan Imaging Filter (GIF) and a K3 detector (brown). B-factors estimated from the slope of fitted straight lines are shown in the same colours. The numbers in parentheses and the error bars represent the estimated and the sample standard deviations from seven-fold random resampling, respectively. (b) Overview of map quality at the agonist binding pocket, illustrating HSM coordination and multiple water molecules (red spheres). (c) The N-acetyl glucosamine moieties attached to Asn149. (d) Difference map (green positive; orange negative) visualises hydrogen atoms in the hydrogen bonding network between β-strands.
Figure 3
Figure 3. Apo-ferritin reconstruction.
(a) B-factor plots for reconstructions using: high-order aberration and Ewald sphere correction (orange); high-order aberration correction only (blue); and no correction (grey). B-factors estimated from the slope of fitted straight lines are shown in the same colours. The numbers in parentheses and the error bars represent the estimated and the sample standard deviations from seven-fold random resampling, respectively. (b) Density for M100 in the 1.22 Å map is shown in blue. (c) Density for F51. (d) Density for L175. (e) Hydrogen bonding network around Y32 and water-302 is visible in the difference map (green positive; orange negative) (f) the α-helix hydrogen bonding network involving residues 21NRQIN25, illustrated as in (e).

Comment in

Similar articles

Cited by

References

    1. Cheng Y. Single-particle cryo-EM at crystallographic resolution. Cell. 2015;161:450–457. - PMC - PubMed
    1. Lyumkis D. Challenges and opportunities in cryo-EM single-particle analysis. J Biol Chem. 2019;294:5181–5197. - PMC - PubMed
    1. Miller PS, Aricescu AR. Crystal structure of a human GABAA receptor. Nature. 2014;512:270–275. - PMC - PubMed
    1. Glaeser RM. Specimen Behavior in the Electron Beam. Methods Enzymol. 2016;579:19–50. - PubMed
    1. Suloway C, et al. Automated molecular microscopy: the new Leginon system. J Struct Biol. 2005;151:41–60. - PubMed

Publication types