. 2020 Oct;586(7831):779-784.
doi: 10.1038/s41586-020-2851-2. Epub 2020 Oct 21.

Immune receptor inhibition through enforced phosphatase recruitment

Affiliations

Immune receptor inhibition through enforced phosphatase recruitment

Ricardo A Fernandes et al. Nature. 2020 Oct.

Abstract

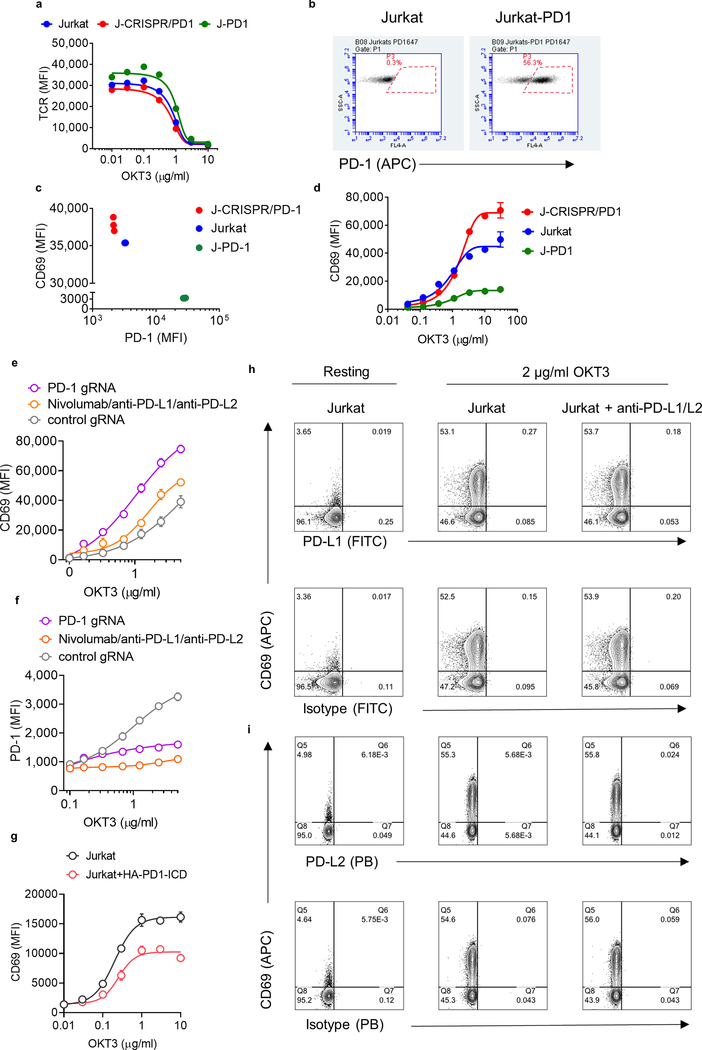
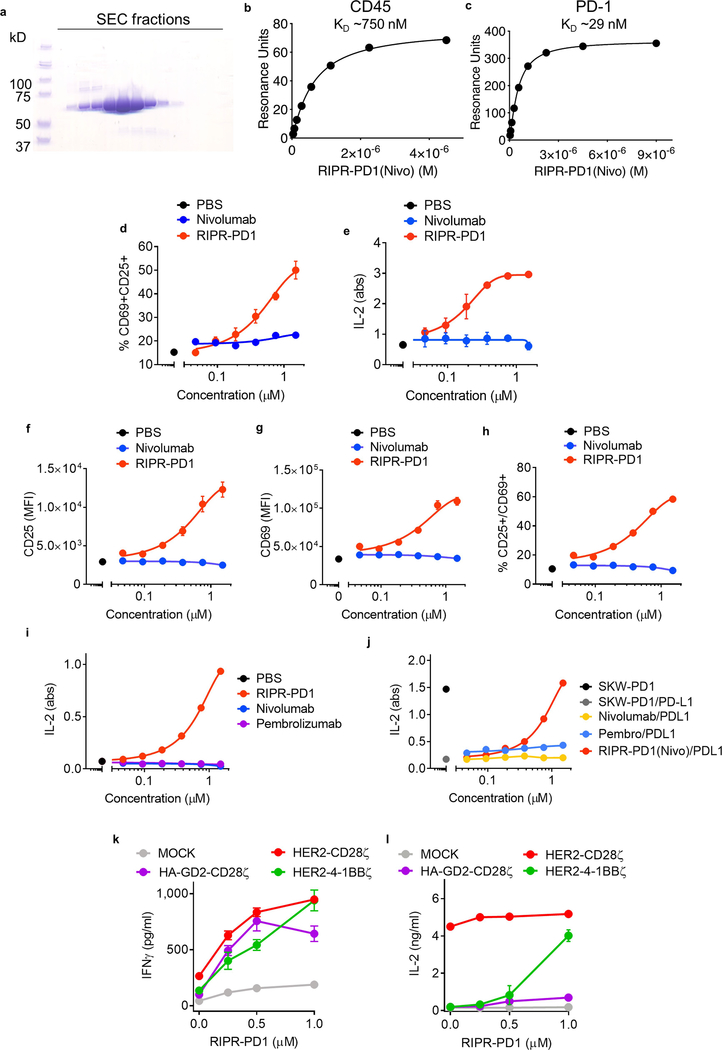
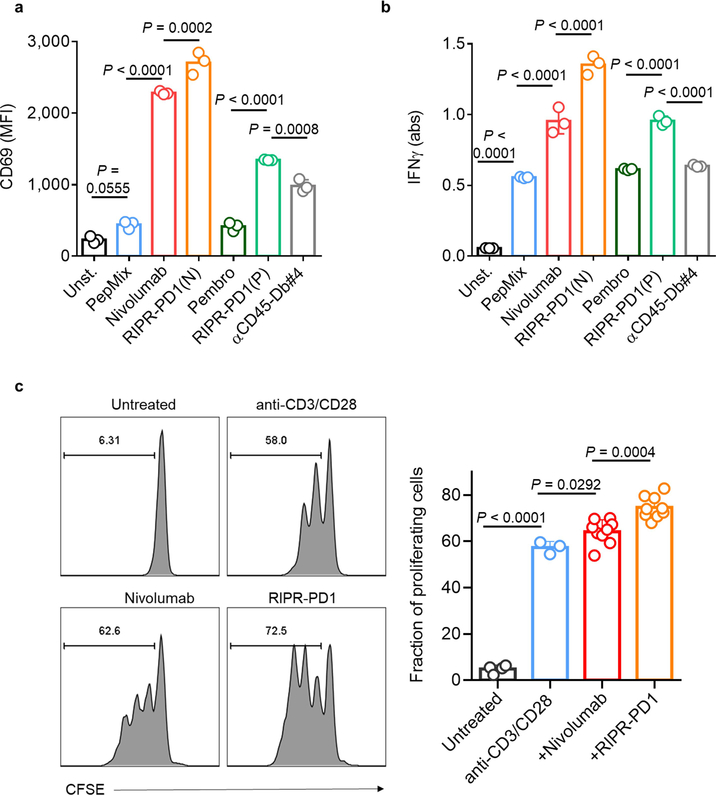
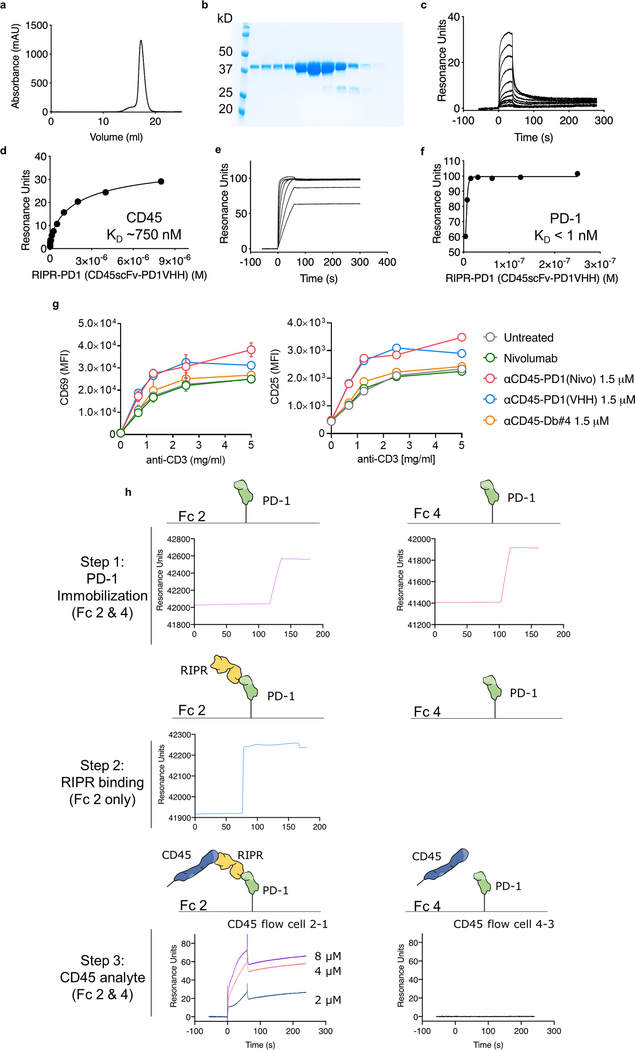
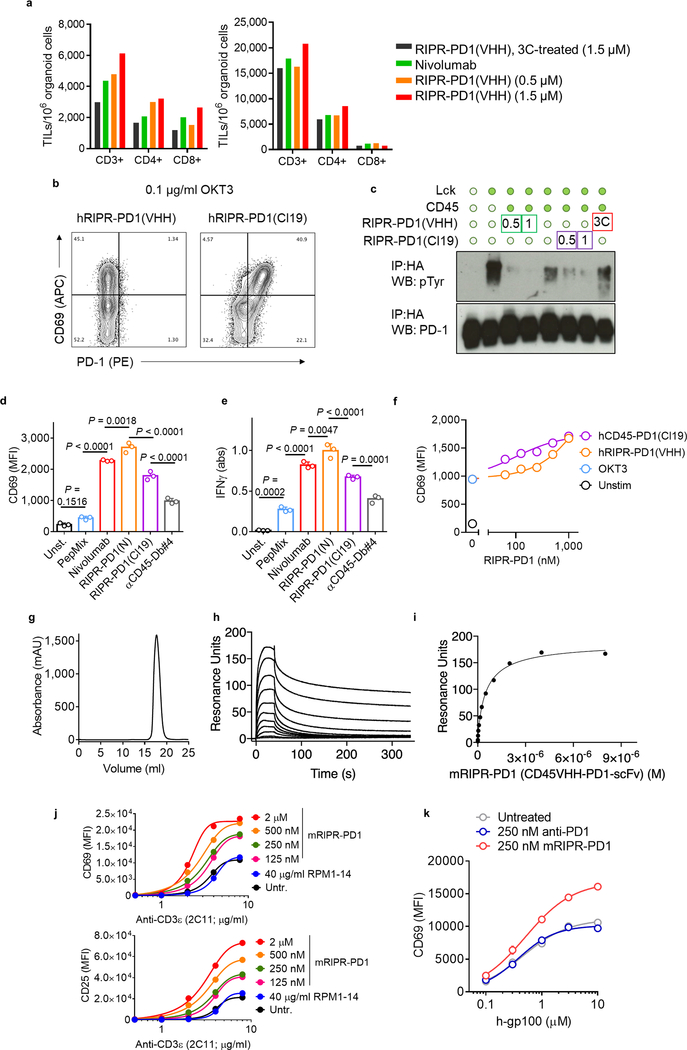
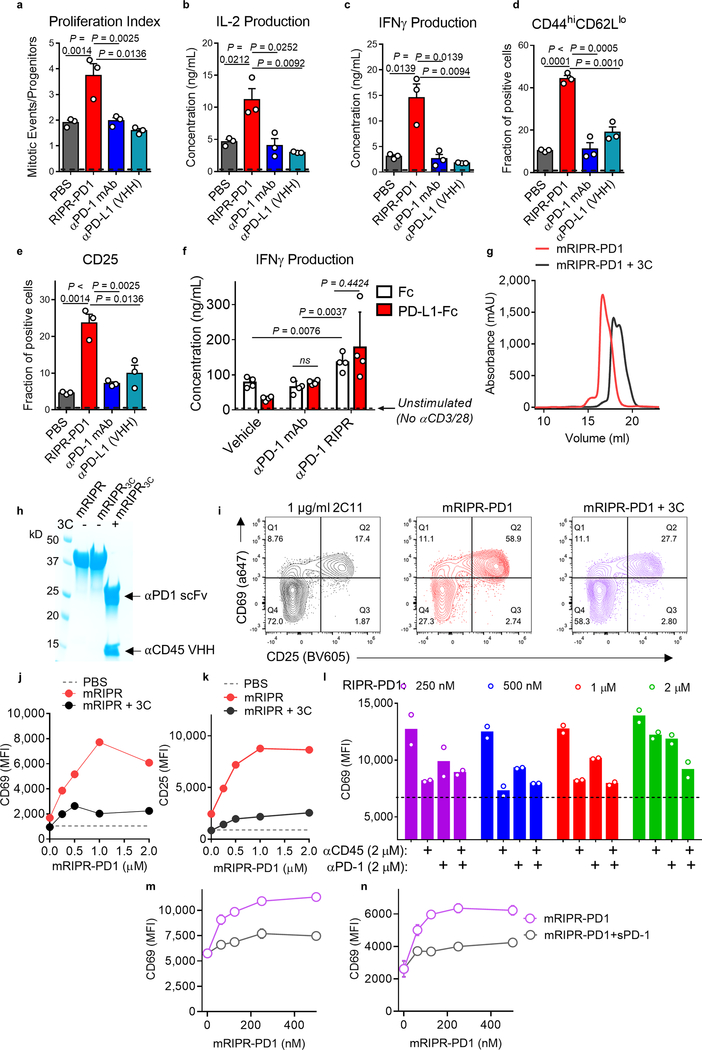
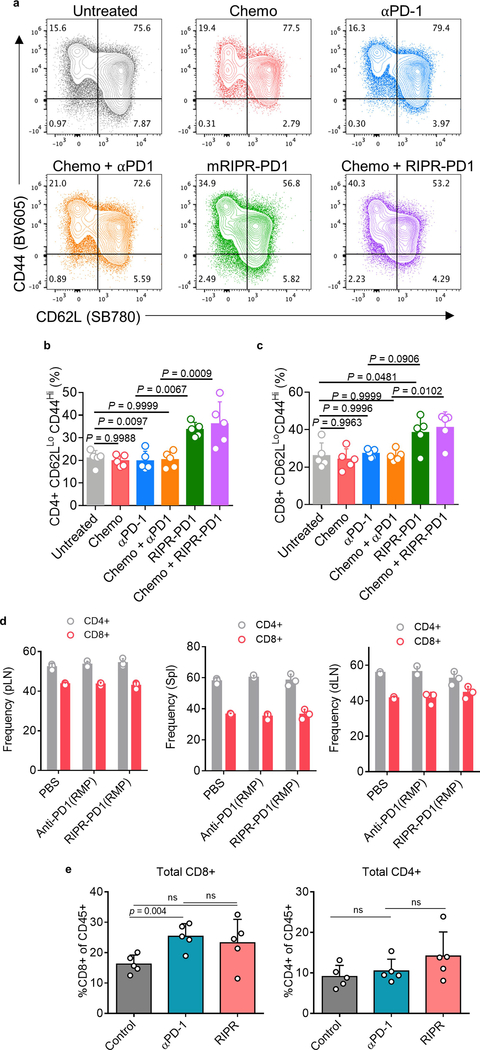
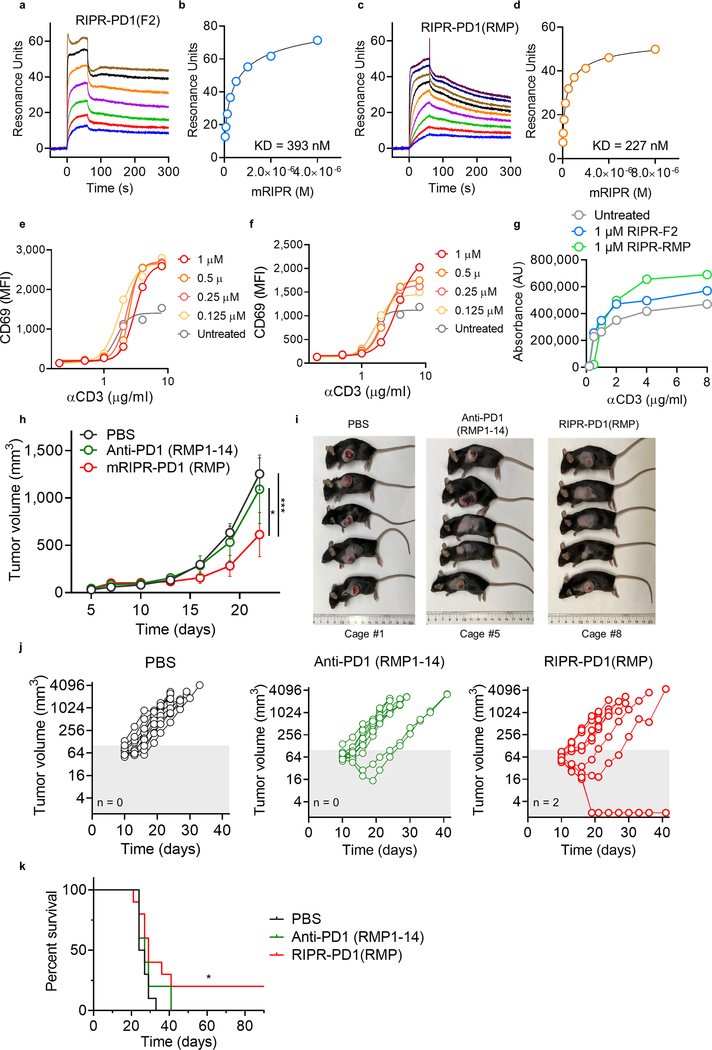
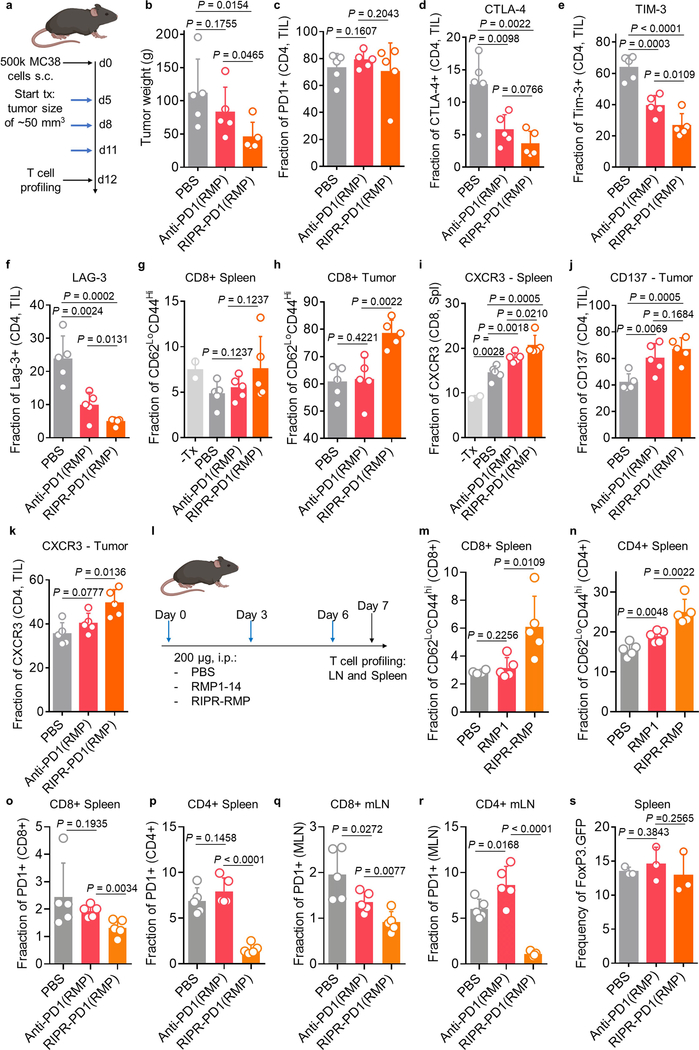
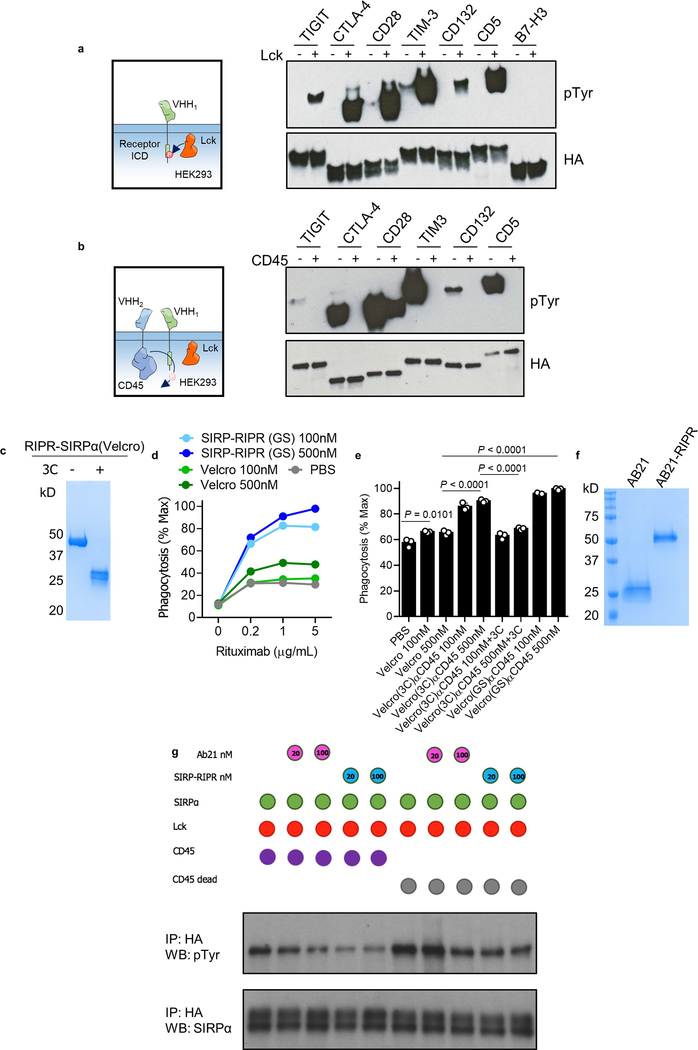
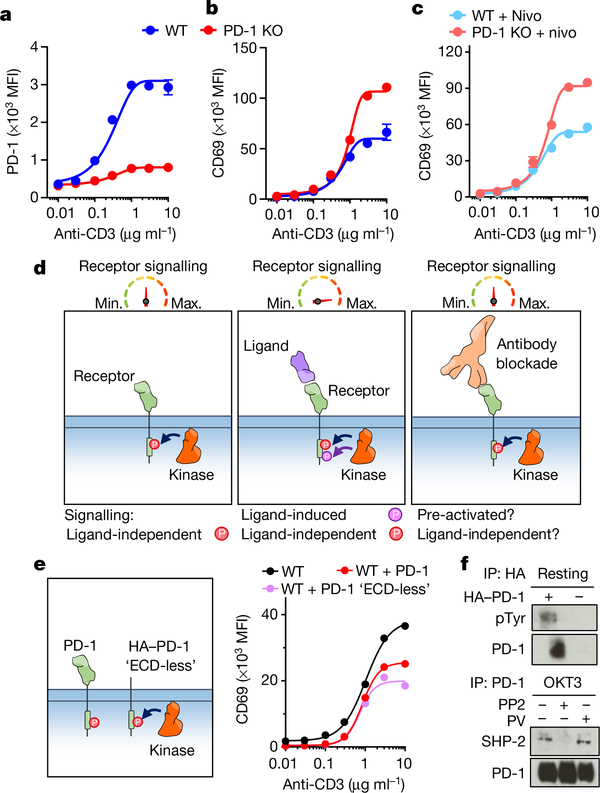
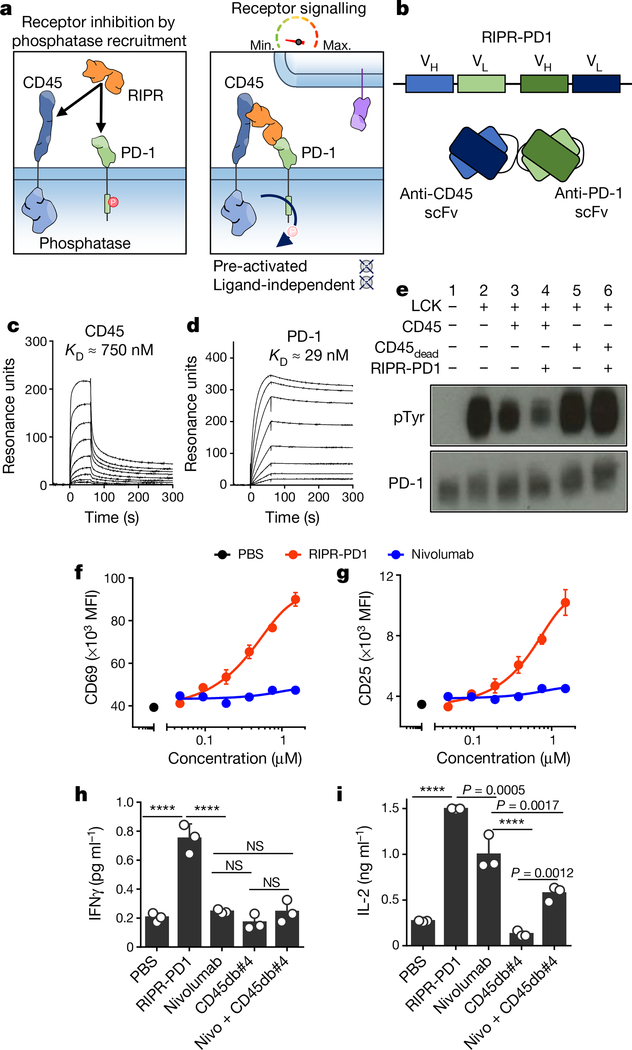
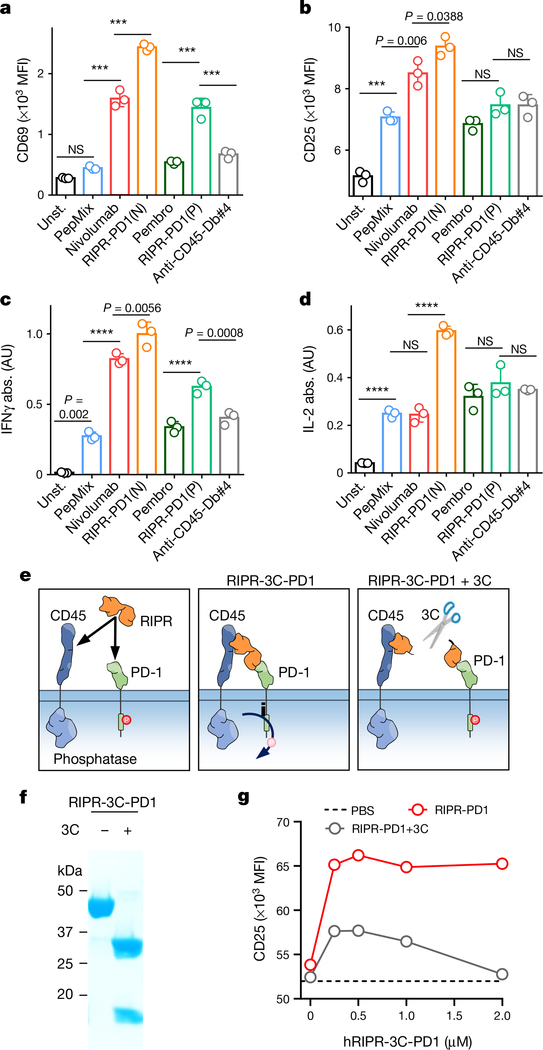
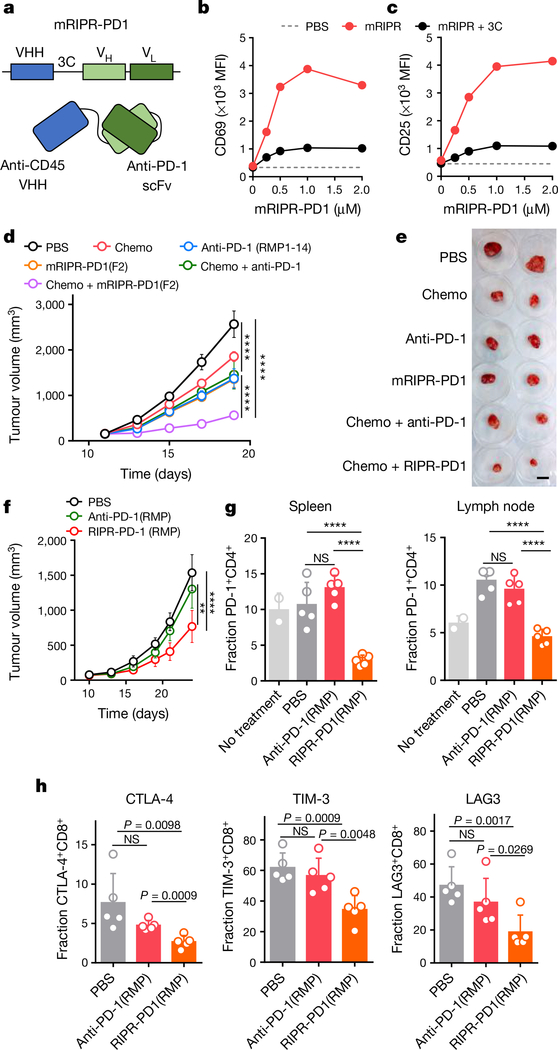
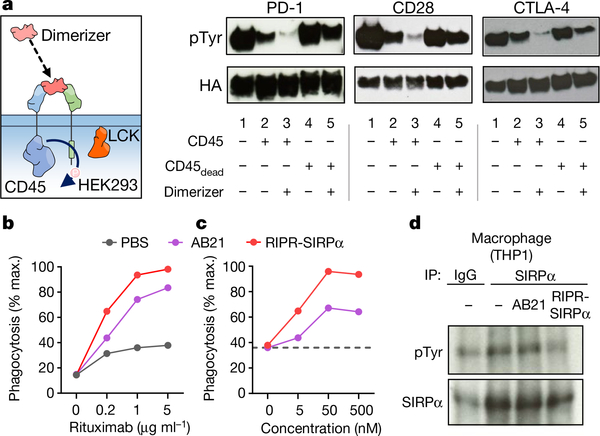
Antibodies that antagonize extracellular receptor-ligand interactions are used as therapeutic agents for many diseases to inhibit signalling by cell-surface receptors1. However, this approach does not directly prevent intracellular signalling, such as through tonic or sustained signalling after ligand engagement. Here we present an alternative approach for attenuating cell-surface receptor signalling, termed receptor inhibition by phosphatase recruitment (RIPR). This approach compels cis-ligation of cell-surface receptors containing ITAM, ITIM or ITSM tyrosine phosphorylation motifs to the promiscuous cell-surface phosphatase CD452,3, which results in the direct intracellular dephosphorylation of tyrosine residues on the receptor target. As an example, we found that tonic signalling by the programmed cell death-1 receptor (PD-1) results in residual suppression of T cell activation, but is not inhibited by ligand-antagonist antibodies. We engineered a PD-1 molecule, which we denote RIPR-PD1, that induces cross-linking of PD-1 to CD45 and inhibits both tonic and ligand-activated signalling. RIPR-PD1 demonstrated enhanced inhibition of checkpoint blockade compared with ligand blocking by anti-PD1 antibodies, and increased therapeutic efficacy over anti-PD1 in mouse tumour models. We also show that the RIPR strategy extends to other immune-receptor targets that contain activating or inhibitory ITIM, ITSM or ITAM motifs; for example, inhibition of the macrophage SIRPα 'don't eat me' signal with a SIRPα-CD45 RIPR molecule potentiates antibody-dependent cellular phagocytosis beyond that of SIRPα blockade alone. RIPR represents a general strategy for direct attenuation of signalling by kinase-activated cell-surface receptors.


Conflict of interest statement

Competing interests RIPR is the subject of a pending patent application (63/056,156), with K.C.G. and R.A.F. listed as inventors. K.C.G. is the founder of Synthekine Therapeutics Inc.

Figures

Extended Data Fig. 1 |
Extended Data Fig. 1 |. Tonic PD-1 signalling dampens T cell activation.
a, TCR downregulation in wild-type or transduced Jurkat T cells with CRISPR/Cas9 and gRNA targeting PD-1 (J-CRISPR-PD-1) upon OKT3 stimulation overnight. b, Jurkat T cells transduced with wild-type human PD-1 (Jurkat-PD1). c, PD-1 versus CD69 expression for Jurkat T cells stimulated overnight with OKT3. Data are shown as individual biological replicates, n = 3. d, CD69 upregulation after OKT3 and anti-CD28 stimulation overnight of wild-type Jurkat cells or Jurkat-PD1 cells (shown in b) or PD-1 KO cells (J-CRISPR-PD-1). In a, d, data are shown as mean ± s.d., n = 3 biological replicates from 1 representative of 3 independent experiments. e, f, Jurkat cells were transduced with control gRNA/CRISPR plasmid or gRNA targeting the endogenous PD-1 gene and activated at increasing concentrations of plate-bound OKT3 overnight. In a separate control group, Jurkat cells were treated with anti-PD1 (Nivolumab), anti-PD-L1 and anti-PD-L2 antibodies (50 μg ml−1 for each antibody). CD69 (e) and PD-1 (f) expression was quantified by flow cytometry. Data are mean ± s.d. from n = 2 biological replicates from 1 representative of 2 independent experiments. g, Expression of HA–PD1-ICD (ECD-less) reduced the upregulation of CD69 12 h after activation with plate-bound OKT3 at the indicated concentrations. Data are mean ± s.d. from n = 3 biological replicates from 1 representative of 2 independent experiments. h, i, Quantification of PD-L1 and PD-L2 in resting and activated Jurkat cells. Resting or activated Jurkat T cells, were incubated with anti-PD-PL1 (h), anti-PD-L2 (i) or with appropriate isotype controls and analysed by flow cytometry. Expression of PD-L1 and PD-L2 was not detected in either resting or activated Jurkat T cells. Non-fluorescent anti-PD-L1 or L2 antibody (right) was added before labelling as a ‘blocking’ control. In h, i, data are representative of 3 independent experiments.
Extended Data Fig. 2 |
Extended Data Fig. 2 |. Development and in vitro testing of RIPR-PD1.
a, Coomassie-stained SDS–PAGE of SEC-purified RIPR-PD1(nivo). b, c, Curve fitting of recorded resonance units at steady state for RIPR-PD1 binding to immobilized CD45 (b) and PD-1 (c). Data shown for RIPR-PD1 concentrations ranging from 4 μM to 35 nM (b), and from 8 μM to 17.5 nM (c). Data are representative of 2 independent experiments. d, e, Fraction of CD25+CD69+ (d) and IL-2 (e) expression for wild-type Jurkat T cells stimulated with 2 μg ml−1 of plate-bound OKT3 and treated with nivolumab or RIPR-PD1 at the concentrations indicated for 24 h. fi, Quantification of CD25 (f) or CD69 (g) expression and fraction of CD25+CD69+ (h) for Jurkat T cells transduced with wild-type PD-1 (shown in Extended Data Fig. 1b) and IL-2 secretion (i) for SKW-3 T cells stimulated with 2 μg ml−1 of plate-bound OKT3 and treated with nivolumab or RIPR-PD1 at the indicated concentrations for 24 h. j, Quantification of IL-2 secretion by TCR transduced SKW-T cells after stimulation for 24 h with cognate peptide in the presence or absence of PD-L1 and nivolumab or RIPR-PD1 at the indicated concentrations. k, l, IFNγ (k) and IL-2 (l) secretion by indicated CAR T cells (or mock untransduced T cells) after incubation with tumour target cells in the presence of increasing concentrations of RIPR-PD1. In dl, data are mean ± s.d. from n = 3 biological replicates representative of 3 independent experiments.
Extended Data Fig. 3 |
Extended Data Fig. 3 |. Antigen stimulation of PBMCs is potentiated by RIPR molecules.
a, b, Peptide-pulsed PBMCs (PepMix, JPT) were treated with 1 μM of nivolumab, pembrolizumab, RIPR-PD1 with nivo (N) or pembro (P) scFv and anti-CD45 diabody (anti-CD45-Db#4). CD69 was analysed by flow cytometry and IFNγ was quantified by ELISA. Data are mean ± s.d. from n = 3 biological replicates from 1 representative of 2 independent experiments. c, CFSE-labelled CD8+ human T cells were stimulated with anti-CD3 and anti-CD28 in the presence or absence of nivolumab or RIPR-PD1 at 1 μM. T cell proliferation was analysed by FACS on day 3. Data are mean ± s.d. from n = 4 (untreated and anti-CD3/CD28) or n = 9 (nivolumab and RIPR-PD1) biological replicates from 1 representative of 2 independent experiments.
Extended Data Fig. 4 |
Extended Data Fig. 4 |. RIPR-PD1 binds to CD45 and PD-1 ectodomains.
a, b, Size-exclusion chromatography profile (a) and Coomassie-stained SDS–PAGE (b) of RIPR-PD1(VHH). cf, SPR binding curves for RIPR-PD1(VHH) binding to CD45 (c) and PD-1 (e), and curve-fitting to resonance units measured at steady state for multiple RIPR-PD1 concentrations during binding to immobilized CD45 (d) and PD-1 (f). In c, d, data shown is for RIPR-PD1 concentrations ranging from 9 μM to 35 nM. In e, f, data shown is for RIPR-PD1 concentrations ranging from 250 nM to 3.5 nM. Kd values were found to be around 700 nM for binding to CD45 and around 3 nM for binding to PD-1. Data shown are representative of 2 independent experiments. g, Jurkat T cells were stimulated with OKT3 at the indicated concentrations and treated with 1 μM of nivolumab, RIPR-PD1(nivo), RIPR-PD1(VHH) or anti-CD45 diabody (anti-CD45-Db#4). CD69 (left) and CD25 (right) were quantified by FACS 24 h after stimulation. Data are mean from n = 2 biological replicates representative of 3 independent experiments. h, SPR analysis of RIPR-PD1 simultaneously binding to CD45 and PD-1. Biotinylated human PD-1 was immobilized in two independent flow cells using a streptavidin coated surface (top). RIPR-PD1(VHH) was used as an analyte at 1 μM in channel 2 (Fc2; middle). CD45 was then used as an analyte in both channels at the indicated concentrations (bottom). Binding of CD45 was detected only in the channel in which both PD-1 and RIPR were present, Fc2, indicating that RIPR-PD1(VHH) bound to PD-1 was able to bind CD45. Fc, Flow cell. Data are representative of 2 independent experiments.
Extended Data Fig. 5 |
Extended Data Fig. 5 |. RIPR-PD1 potentiates T cell expansion in tumour organoids, and RIPR activity is not strictly dependent on PD-1 blockade.
a, Quantification of TILs treated with intact RIPR (hRIPR-PD1(VHH)), 3C-digested control RIPR-PD1(VHH) (black) or nivolumab (nivo) in melanoma (left) or ovarian (right) patient-derived tumour organoids, at the indicated concentrations. b, Activated Jurkat T cells upregulate PD-1 (x axis) and CD69 (y axis). Anti-PD-1 staining is blocked by RIPR-PD1(VHH) (left) but is not affected by non-blocking RIPR-PD1(Cl19) (right). c, HEK293 cells were transfected with HA–PD-1 (N-term HA-tag fused to full-length PD-1) and LCK and CD45, as indicated. 48 h after transfection cells were treated with RIPR-PD1(VHH) or RIPR-PD1(Cl19) for 30 min at 37 °C at 0.5 or 1 μM, or 3C-cleaved RIPR-PD1(VHH) (1 μM) as indicated. Anti-HA magnetic beads were used for immunoprecipitation and samples were probed for anti-phosphotyrosine or anti-PD1 by western blot. Data are representative of two independent replicates. For raw source image, see Supplementary Fig. 1. d, e, Quantification of CD69 expression (d) and IFNγ secretion (e) after PBMC stimulation (as described in Fig. 3) for cells treated with 1 μM of nivolumab, RIPR-PD1(nivo) or non-blocking RIPR-PD1(Cl19). Data are mean ± s.d. from n = 3 biological replicates from 1 representative of 2 independent experiments. For representative gating strategy, see Supplementary Fig. 2. f, Jurkat T cells were activated overnight with plate-bound OKT3 at 0.1 μg ml−1 and incubated with 1 μM of RIPR-PD1(VHH) (blocking) or RIPR-PD1(Cl19) (non-blocking). Data are mean from n = 2 biological replicates from 1 representative of 2 independent experiments. g, Size exclusion chromatography of mouse RIPR-PD1. h, SPR binding curves for mRIPR-PD1 (clone F2) binding to immobilized mouse PD-1. i, Resonance units measured at steady state for multiple mRIPR-PD1 concentrations tested for binding to mouse PD-1. RIPR-PD1 concentration shown ranges from 8 μM to 35 nM. Kd values were found to be around 750 nM for binding to mPD-1. In h, i, data are representative from 2 independent experiments. j, Mouse CD8+ T cells were isolated from spleen and lymph nodes of C57/B6 mice and stimulated with plate-bound anti-CD3 (2C11) antibody at the indicated concentrations plus soluble CD28 (2 mg ml−1). During activation with 2C11 and anti-CD28, cells were either left untreated or were incubated with anti-PD-1 antibody (clone RMP1–14) or mouse RIPR-PD1(RMP1–14) for 24 h. CD69 (top) and CD25 (bottom) expression was quantified by FACS. k, Pmel-1 mouse CD8 T cells were stimulated with peptide pulsed APCs and 250 nM of anti-PD1 (RMP1–14) antibody or RIPR-PD1(RMP) for 24 h. CD69 were analysed by flow cytometry. In j, k, data are mean ± s.d. from n = 2 biological replicates from 1 representative of 3 independent experiments.
Extended Data Fig. 6 |
Extended Data Fig. 6 |. In vitro testing of mouse RIPR-PD1.
ae, CD4+ T cells were stimulated for 3 days in the presence of anti-CD3/CD28 and anti-PD1, anti-PD-L1(VHH) or RIPR-PD1, all at 1 μM, after which cells and supernatant were collected by analysis for proliferation (a), IL-2 (b) or IFNγ (c) secretion, fraction of CD44highCD62Llow (d) and CD25 (e). Cell proliferation was quantified using CellTiter-Glo, surface expression by flow cytometry and cytokine secretion by ELISA. f, Mouse CD4+ T cells were stimulated with plate-bound anti-CD3 and soluble CD28 in the presence of absence of plate-bound PD-L1 or isotype control. Cells were treated with anti-PD1 antibody (RMP1–14) or RIPR-PD1 at 1 μM and supernatant was collected for quantification of IFNγ production on day 3. In af, data are mean ± s.d. from n = 3 biological replicates from 1 representative of 2 independent experiments. g, Size-exclusion chromatography of intact or 3C-cleaved mouse RIPR-PD1. h, Coomassie-stained SDS–PAGE of mouse mRIPR-PD1 uncleaved or treated with 3C overnight. i, Mouse CD8+ T cells were activated with plate-bound 2C11 (1 mg ml−1) and soluble CD28 (2 mg ml−1) for 24 h and treated with 1 μM of intact (middle) or 3C-treated (right) mRIPR-PD1. j, k, Quantification of the CD69 (j) and CD25 (k) expression of representative data shown in i. Data are mean from n = 2 biological replicates from 1 representative of 3 independent experiments. l, Competition experiment between mRIPR-PD1 at the indicated concentrations and anti-CD45-MSA (2 μM), anti-PD-1-MSA (2 μM) or both, as indicated. Mouse CD8+ T cells were stimulated with 8 μg ml−1 of 2C11 and 2 μg ml−1 of anti-CD28. Black line indicates CD69 expression (with 2C11 and anti-CD28 only). CD69 expression was quantified by FACS 24 h post-stimulation. Data are mean from n = 2 biological replicates from 1 representative of 3 independent experiments. m, n, Competition experiment between mRIPR-PD1 and soluble mouse PD-1 (5 μM). Mouse CD8+ T cells were stimulated with 2 μg ml−1 (m) or 4 μg ml−1 (n) of plate-bound 2C11 and 2 μg ml−1 of soluble anti-CD28. CD69 was quantified by FACS 24 h after stimulation. Data are mean from n = 2 biological replicates from 1 representative of 3 independent experiments.
Extended Data Fig. 7 |
Extended Data Fig. 7 |. RIPR-PD1 induces T cells with an effector memory phenotype in a SCLC tumour model.
a, Representative analysis of CD44 and CD62L expression in lymphocytes isolated from tumour-proximal lymph nodes collected at day 19 post inoculation with KP1 (SCLC) cells for various treatments, as indicated. Data are representative from n = 5 biological replicates from 2 independent experiments. b, c, Quantification of the representative data shown in a for CD4+ (b) and CD8+ (c) cells. In b, c, data are mean ± s.d. from n = 5 biological replicates representative of 2 independent experiments. d, Quantification of the frequency of CD4+ and CD8+ cells in spleen (left) peripheral (middle) and distal (right) lymph nodes from wild-type mice treated with 200 μg anti-PD1 or RIPR-PD1 every 3 days for one week. e, Quantification of CD4+ and CD8+ infiltrates in brown adipose tissue. Mice were treated as described in d. In d, e, data are mean ± s.d. from n = 3 (d) and n = 5 (e) biological replicates representative of 2 independent experiments. For representative gating strategy, see Supplementary Fig. 2.
Extended Data Fig. 8 |
Extended Data Fig. 8 |. RIPR-PD1 reduces MC38 colon carcinoma tumour growth.
a, b, Analysis of the RIPR-PD1(F2) binding affinity to mouse PD-1 by SPR. c, d, Analysis of RIPR-PD1(RMP) binding affinity to mouse PD-1 by SPR. In ad, data are representative of 2 independent experiments. CD8+ mouse T cells were stimulated with plate-bound 2C11 overnight. e, f, Quantification of CD69 upregulation for cells treated with RIPR-PD1(F2) (e) or RIPR-PD1(RMP) (f). g, Proliferation (CellTiter-Glo) analysis of anti-CD3 treated CD4+ mouse T cells in the presence of F2 or RMP RIPR-PD1. In eg, data are mean ± s.d. from n = 2 biological replicates from 1 representative of 3 independent experiments. h, MC38 tumour growth for mice treated with PBS, anti-PD1 (clone RMP1–14, 200 μg every 3 days) or RIPR-PD1(RMP) (200 μg daily). Data are mean ± s.e.m. from n = 10 mice. i, Representative images of the mice 24 days after inoculation with MC38 cells for the indicated treatments. Data shown are representative of 2 independent experiments, n = 10 mice per group. j, Individual tumour volume measurements for the data shown in Fig. 4f. The n values stated are the number of tumour-free mice. k, Percent survival for mice treated as described in hj. In hj, data shown are representative of 2 independent experiments, n = 10 mice per group.
Extended Data Fig. 9 |
Extended Data Fig. 9 |. Profiling of mouse T cells in response to anti-PD1 or RIPR-PD1 treatment.
a, Mice inoculated with MC38 tumour cells were treated with PBS, anti-PD1 or RIPR-PD1(RMP), 200 μg, every 3 days starting at day 5 post tumour inoculation. On day 12 T cells from spleen (Spl), peripheral and distal lymph nodes (pLN, dLN) and tumour infiltrating lymphocytes (TILs) were collected and analysed by flow cytometry. b, Quantification of tumour weight. c, Quantification of PD-1+ CD4+ T cells in TILs. df, Quantification of the fraction of positive CTLA-4 (d), TIM-3 (e) and LAG3 (f) from TILs for CD4+ T cells. g, h, Quantification of the fraction of CD62LlowCD44high effector memory CD8+ T cells isolated from the spleen (g) or tumour (h). i, Quantification of the fraction of CXCR3-positive cells for splenic CD8+ cells. Analysis of CD4+ cells showed increased fraction of CD137 (4–1BB) (j) and CXCR3 (k) in TILs. l, Quantification of effector memory and PD-1+ cells in tumour-free mice. Mice were treated with PBS, anti-PD1 or RIPR-PD1 every 3 days from day 0 to day 6 and T cells were isolated and analysed on day 7. mr, CD8+ and CD4+ T cells were analysed on day 7 for CD44, CD62L (m, n; CD8+, spleen) and PD-1 expression in the spleen (o, p) and lymph nodes (mLN; q, r). s, Quantification of Treg cells in tumour-free mice. Tumour-free FoxP3–GFP mice were treated with PBS, anti-PD1 or RIPR-PD1 (200 μg every 3 days) from day 0 to day 6, n = 3 mice per group. T cells were analysed on day 7. Quantification of the fraction of FoxP3–GFP-positive cells (gated on the CD3+CD4+ population) for cells isolated from the spleen. All data are mean ± s.d. from n = 5 mice (bk, mq) or n = 3 (s) representative from 2 independent experiments. For representative gating strategy, see Supplementary Fig. 2.
Extended Data Fig. 10 |
Extended Data Fig. 10 |. RIPR-SIRPα development and in vitro testing.
a, b, HEK293 cells were transiently transfected with target receptors and LCK (a), or LCK plus CD45 (b). After lysis, chimeric receptors were immunoprecipitated with anti-HA antibody directly conjugated to magnetic beads. Samples were probed for phosphotyrosine and HA by western blot. Data are representative of three independent biological repeats. For raw source image, see Supplementary Fig. 1. c, RIPR-SIRPα(3C) was treated with 3C (100 μg ml−1) for 14 h at 4 °C. 3C-digestion was analysed by Coomassie blue staining on SDS–PAGE gel. d, Human PBMC macrophages were pretreated with RIPR-SIRPα or ‘Velcro’ protein for 30 min at 37 °C and incubated with human tumour cells (Raji) pretreated with varying concentrations of rituximab (from 0 to 5 μg ml−1) for 30 min at 37 °C. Macrophages were co-cultured with 1 × 10⁴ CFSE+ Raji cells for 2 h at 37 °C. e, Quantification of phagocytosis as described in d for a fixed concentration of rituximab (1 μg ml−1) for cells treated with 100 nM or 500 nM of intact or 3C-digested RIPR-SIRPα or Velcro, as indicated. In d, e, data are mean ± s.d. from n = 2 (d) or n = 3 (e) biological replicates representative from 2 independent experiments. For representative gating strategy, see Supplementary Fig. 2. f, Coomassie blue staining on SDS–PAGE gel for AB21 Fab and RIPR-SIRPα(AB21). g, HEK293 cells were transiently transfected with LCK, CD45, CD45dead and SIRPα as indicated. HEK293 cells were treated with RIPRSIPRα 24 h after transfection for 30 min at 37 °C. Cells were collected and cell lysates were incubated with HA beads, HA–SIRPα was immunoprecipitated and analysed by western blot assay as indicated. Data are representative from 2 independent experiments. For raw source image, see Supplementary Fig. 1.
Fig. 1 |
Fig. 1 |. Ligand-independent PD1 signalling reduces T cell activation.
Jurkat T cells were transduced with gRNA targeting PD-1 (J-CRISPR-PD-1) and stimulated with OKT3. a, Quantification of PD-1 expression. WT, wild-type Jurkat cells. b, c, CD69 expression in the absence (b) or presence (c) of nivolumab (nivo). In ac, data are mean ± s.d. from n = 3 biological replicates representative of 3 independent experiments. d, Schematic depiction of PD-1 phosphorylation before (left) and after (middle) ligand binding and anti-PD-1 antibody blockade (right). e, Left, Jurkat T cells were transduced with PD-1 lacking the extracellular region. Right, quantification of CD69 expression. Data are mean ± s.d. from n = 2 biological replicates representative of 2 independent experiments. f, Detection of PD-1 phosphorylation and SHP-2 in Jurkat T cells by western blot, after PD-1 immunoprecipitation (IP) and various treatments (PV, pervanadate; PP2, LCK inhibitor). Data are representative of 2 independent experiments. For uncropped gels, see Supplementary Fig. 1.
Fig. 2 |
Fig. 2 |. Enforced CD45 phosphatase recruitment reduces PD-1 phosphorylation and potentiates T cell activation.
a, Schematic depiction of RIPR-mediated receptor inhibition. b, Schematic representation of RIPR-PD1 depicting the connection between the variable heavy (VH) and variable light (VL) chains of anti-CD45 and anti-PD-1 antibodies. c, d, SPR of RIPR-PD1 binding to CD45 (c) and PD-1 (d). Data are representative of 2 independent experiments. e, HEK293 cells were transiently transfected with human PD-1, LCK, CD45 or CD45dead, after which cells were incubated with RIPR-PD1. Lysates were analysed for phosphotyrosine and PD-1 by western blot after PD-1 immunoprecipitation. Data are representative of 3 independent experiments. For uncropped gels, see Supplementary Fig. 1. f, g, Quantification of CD69 (f) and CD25 (g) expression in Jurkat T cells stimulated with OKT3 and treated with PBS, RIPR-PD1 or nivolumab. h, i, IFNγ (h) and IL-2 (i) secretion by HER2–4-1BB-CD3ζ CAR T cells treated with various molecules, as indicated, in response to coculture with MG63.3 tumour cells. In fi, data are mean ± s.d. from n = 3 biological replicates representative of 3 independent experiments. ****P < 0.0001.
Fig. 3 |
Fig. 3 |. Crosslinking of CD45 to PD-1 potentiates T cell activation.
ad, Peptide-stimulated PBMCs were treated with nivolumab, pembrolizumab, RIPR-PD1(N), RIPR-PD1(P) or an anti-CD45 diabody (anti-CD45-Db#4). Unst., unstimulated; PepMix, stimulated with PepMix only. Quantification of CD69 (a) CD25 (b), IFNγ (c) and IL-2 (d). Data are mean ± s.d. from n = 3 biological replicates representative of 3 independent experiments. e, Schematic depiction of RIPR-3C-PD1 after treatment with 3C. f, SDS–PAGE of intact and 3C-treated RIPR-3C-PD1. g, CD25 expression after activation of PBMCs using anti-CD3 and anti-CD28 and treatment with intact or 3C-treated human RIPR-PD1 (hRIPR-PD1). Data are mean ± s.d. from n = 2 biological replicates representative of 2 independent experiments. ***P < 0.001; ****P < 0.0001.
Fig. 4 |
Fig. 4 |. Mouse RIPR-PD1 reduces tumour progression in mouse models of SCLC and colon cancer.
a, Schematic depiction of mouse RIPR-PD1 (mRIPR-PD1). b, c, CD69 (b) and CD25 (c) expression in activated CD8+ T cells treated with intact or 3C-cleaved mRIPR-3C-PD1. Data are mean ± s.d. from n = 2 biological replicates representative of 3 independent experiments. d, Quantification of KP1 SCLC tumour growth in immunocompetent mice. Data are mean ± s.d., n = 5. e, Representative tumours are shown after collection at day 19. Scale bar, 2 cm. f, Quantification of MC38 tumour growth. Data are mean ± s.e.m., n = 10. g, Quantification of PD-1 expression in CD4+ T cells in spleen (left) and lymph node (right). h, Quantification of CTLA-4 (left), TIM-3 (middle) or LAG-3 (right) in CD8+ cells. In g, h, data are mean ± s.d., n = 5. In d–h, data are representative of 2 independent experiments. **P < 0.01; ***P < 0.001; ****P < 0.0001.
Fig. 5 |
Fig. 5 |. Recruitment of CD45 reduces receptor phosphorylation of diverse immunoreceptor targets.
a, Representation of a chimeric system in which anti-human or anti-hen lysozyme nanobodies were fused to the cytoplasmic domains of CD45 or target receptors of interest (left). Detection of receptor tyrosine phosphorylation after CD45 recruitment to PD-1, CD28 or CTLA-4, by western blot after anti-HA immunoprecipitation. Data are representative of 3 independent biological repeats. For uncropped gels, see Supplementary Fig. 1. b, c, RIPR-SIRPa enhances antibody-dependent cellular phagocytosis. In vitro phagocytosis using primary macrophages co-cultured with Raji B cells, pretreated with anti-CD20 antibody (rituximab) at the indicated concentrations (b), or at 1 μg ml−1 with the indicated concentrations of AB21 or RIPR-SIRPα (c). Data are mean ± s.d. from n = 2 biological replicates. d, Detection of SIRPα phosphorylation in THP-1 macrophages. Cells were incubated with AB21 or RIPR-SIRPα before SIRPα immunoprecipitation. In bd, data are representative of 2 independent experiments.

Similar articles

Cited by

References

    1. Wei SC, Duffy CR & Allison JP Fundamental mechanisms of immune checkpoint blockade therapy. Cancer Discov. 8, 1069–1086 (2018). - PubMed
    1. Hermiston ML, Xu Z & Weiss A CD45: a critical regulator of signaling thresholds in immune cells. Annu. Rev. Immunol. 21, 107–137 (2003). - PubMed
    1. Barr AJ et al. Large-scale structural analysis of the classical human protein tyrosine phosphatome. Cell 136, 352–363 (2009). - PMC - PubMed
    1. Smith-Garvin JE, Koretzky GA & Jordan MS T cell activation. Annu. Rev. Immunol. 27, 591–619 (2009). - PMC - PubMed
    1. Chang VT et al. Initiation of T cell signaling by CD45 segregation at ‘close contacts’. Nat. Immunol. 17, 574–582 (2016). - PMC - PubMed

Publication types

MeSH terms