

C-terminally encoded peptides (CEPs) are potential mediators of abiotic stress response in plants
- PMID: 33088046
- PMCID: PMC7548271
- DOI: 10.1007/s12298-020-00881-4
C-terminally encoded peptides (CEPs) are potential mediators of abiotic stress response in plants
Abstract
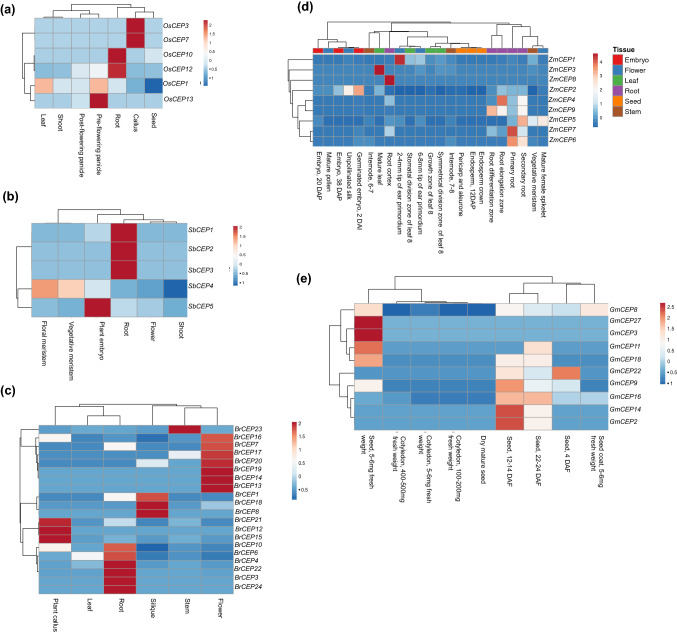
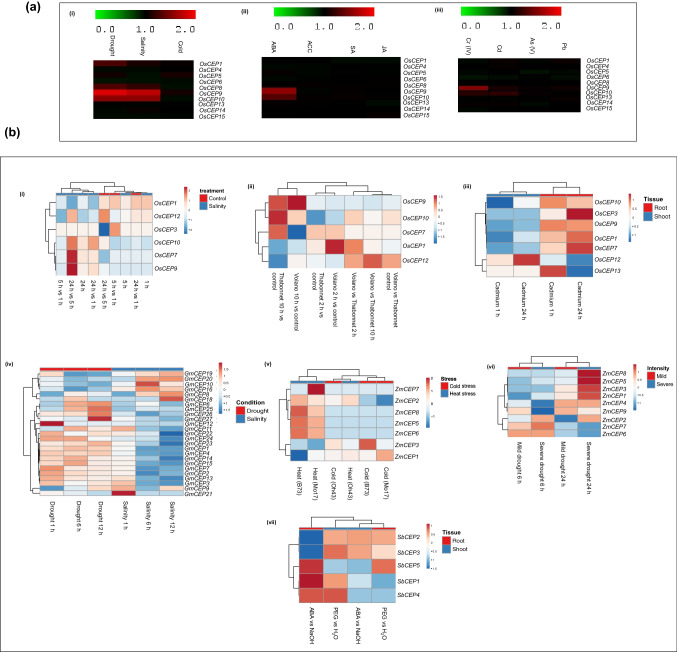
Intracellular signaling is a critical determinant of the normal growth and development of plants. Signaling peptides, also known as peptide hormones, along with classical phytohormones, are the significant players of plant intracellular signaling. C-terminally encoded peptide (CEP), a 15-amino acid post-translationally peptide identified in Arabidopsis, plays a pivotal role in lateral root formation, nodulation, and act as long-distance root to shoot signaling molecule in N-starvation conditions. Expression of CEP gene members in Arabidopsis is perturbed by nitrogen starvation; however, not much is known regarding their role in other abiotic stress conditions. To gain a comprehensive insight into CEP biology, we identified CEP genes across diverse plant genera (Glycine max, Sorghum bicolor, Brassica rapa, Zea mays, and Oryza sativa) using bioinformatics tools. In silico promoter analysis revealed that CEP gene promoters show an abundance of abiotic stress-responsive elements suggesting a possible role of CEPs in abiotic stress signaling. Spatial and temporal expression patterns of CEP via RNA seq and microarray revealed that various CEP genes are transcriptionally regulated in response to abiotic stresses. Validation of rice CEP genes expression by qRT-PCR showed that OsCEP1, OsCEP8, OsCEP9, and OsCEP10 were highly upregulated in response to different abiotic stress conditions. Our findings suggest these CEP genes might be important mediators of the abiotic stress response and warrant further overexpression/knockout studies to delineate their precise role in abiotic stress response.
Keywords: Abiotic stress; C-terminally encoded peptide (CEP); Signaling peptides; qRT-PCR.
© Prof. H.S. Srivastava Foundation for Science and Society 2020.
Figures


Similar articles
-
Functional characterization of C-TERMINALLY ENCODED PEPTIDE (CEP) family in Brassica rapa L.Plant Signal Behav. 2022 Dec 31;17(1):2021365. doi: 10.1080/15592324.2021.2021365. Epub 2021 Dec 30. Plant Signal Behav. 2022. PMID: 34968412 Free PMC article.
-
CEP genes regulate root and shoot development in response to environmental cues and are specific to seed plants.J Exp Bot. 2013 Dec;64(17):5383-94. doi: 10.1093/jxb/ert332. Epub 2013 Oct 31. J Exp Bot. 2013. PMID: 24179096
-
CEP peptide hormones: key players in orchestrating nitrogen-demand signalling, root nodulation, and lateral root development.J Exp Bot. 2018 Apr 9;69(8):1829-1836. doi: 10.1093/jxb/ery037. J Exp Bot. 2018. PMID: 29579226 Review.
-
Systematic Annotation Reveals CEP Function in Tomato Root Development and Abiotic Stress Response.Cells. 2022 Sep 20;11(19):2935. doi: 10.3390/cells11192935. Cells. 2022. PMID: 36230896 Free PMC article.
-
Dialog between Kingdoms: Enemies, Allies and Peptide Phytohormones.Plants (Basel). 2021 Oct 21;10(11):2243. doi: 10.3390/plants10112243. Plants (Basel). 2021. PMID: 34834606 Free PMC article. Review.
Cited by
-
Transcript profiling of Polycomb gene family in Oryza sativa indicates their abiotic stress-specific response.Funct Integr Genomics. 2022 Dec;22(6):1211-1227. doi: 10.1007/s10142-022-00906-z. Epub 2022 Oct 5. Funct Integr Genomics. 2022. PMID: 36197542
-
A Genome-Wide Analysis of the CEP Gene Family in Cotton and a Functional Study of GhCEP46-D05 in Plant Development.Int J Mol Sci. 2024 Apr 11;25(8):4231. doi: 10.3390/ijms25084231. Int J Mol Sci. 2024. PMID: 38673820 Free PMC article.
-
Small signaling peptides mediate plant adaptions to abiotic environmental stress.Planta. 2022 Feb 26;255(4):72. doi: 10.1007/s00425-022-03859-6. Planta. 2022. PMID: 35218440 Review.
-
Research progress of peptides discovery and function in resistance to abiotic stress in plant.Stress Biol. 2025 May 23;5(1):36. doi: 10.1007/s44154-025-00220-1. Stress Biol. 2025. PMID: 40407840 Free PMC article. Review.
-
Functional characterization of C-TERMINALLY ENCODED PEPTIDE (CEP) family in Brassica rapa L.Plant Signal Behav. 2022 Dec 31;17(1):2021365. doi: 10.1080/15592324.2021.2021365. Epub 2021 Dec 30. Plant Signal Behav. 2022. PMID: 34968412 Free PMC article.
References
-
- Benjamini Y, Hochberg Y. Controlling the false discovery rate: a practical and powerful approach to multiple testing. J R Stat Soc Ser B (Methodol) 1995;57(1):289–300. doi: 10.1111/j.2517-6161.1995.tb02031.x. - DOI
LinkOut - more resources
Full Text Sources