

Dipolar elementary current systems for ionospheric current reconstruction at low and middle latitudes
- PMID: 33088208
- PMCID: PMC7561552
- DOI: 10.1186/s40623-020-01284-1
Dipolar elementary current systems for ionospheric current reconstruction at low and middle latitudes
Abstract
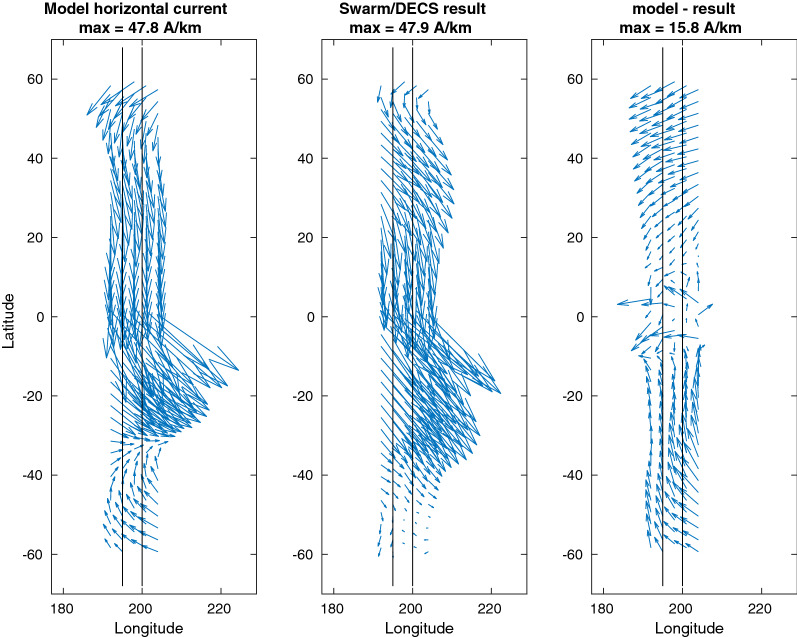
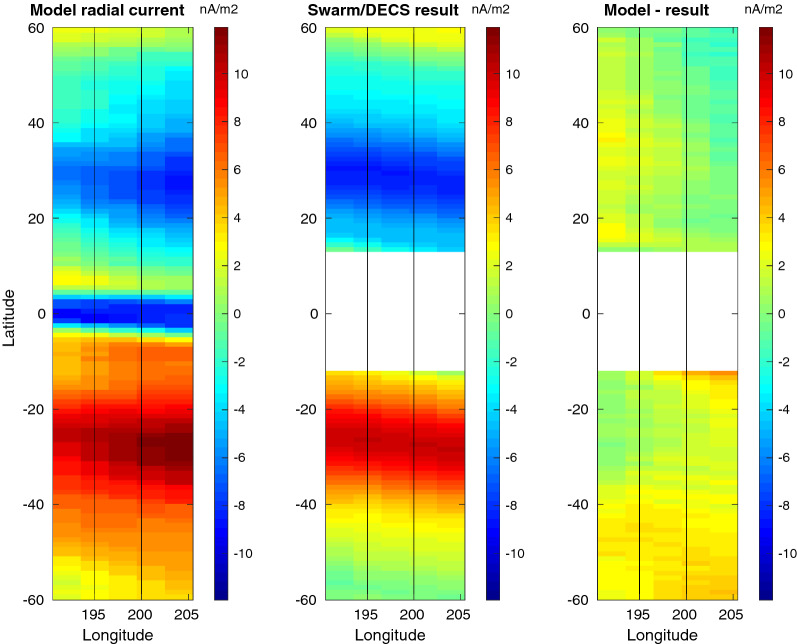
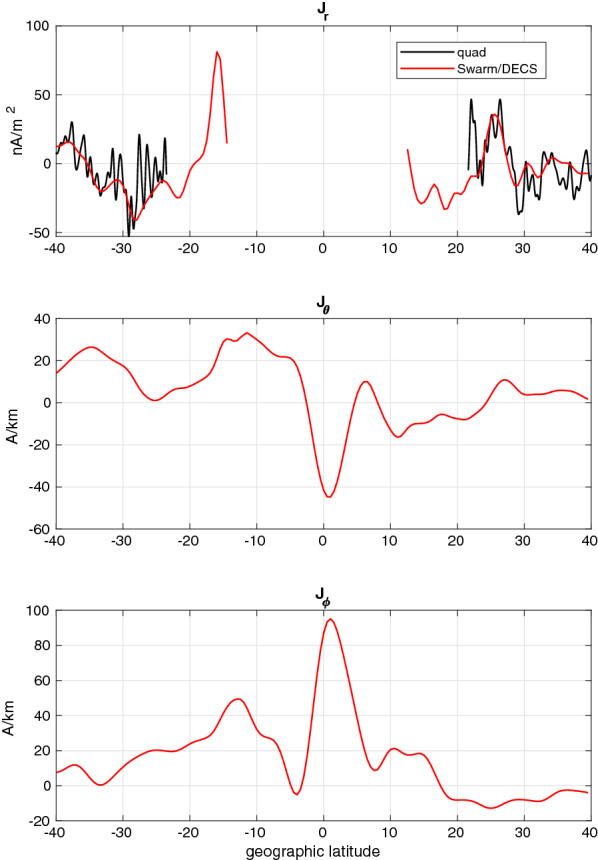
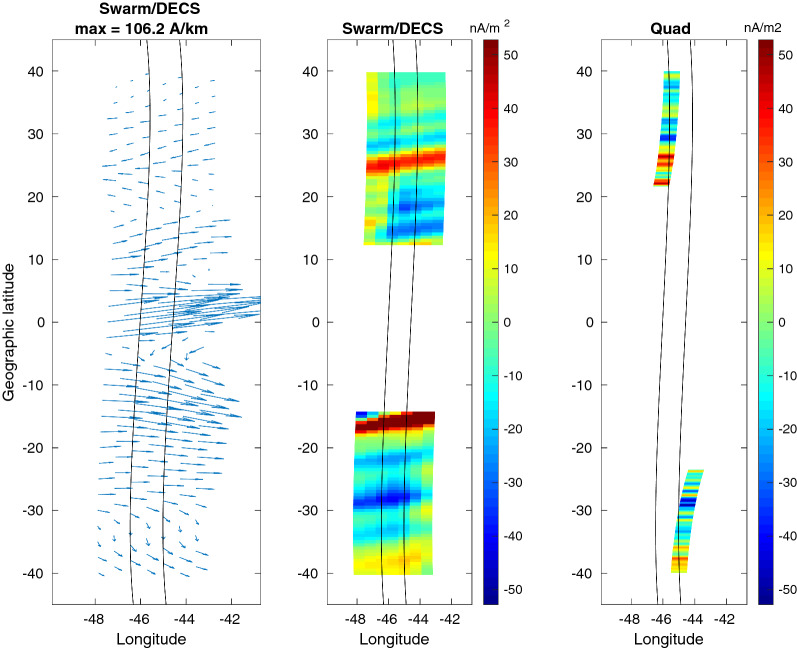
The technique of spherical elementary current systems (SECS) is a powerful way to determine ionospheric and field-aligned currents (FAC) from magnetic field measurements made by low-Earth-orbiting satellites, possibly in combination with magnetometer arrays on the ground. The SECS method consists of two sets of basis functions for the ionospheric currents: divergence-free (DF) and curl-free (CF) components, which produce poloidal and toroidal magnetic fields, respectively. The original CF SECS are only applicable at high latitudes, as they build on the assumption that the FAC flow radially into or out of the ionosphere. The FAC at low and middle latitudes are far from radial, which renders the method inapplicable at these latitudes. In this study, we modify the original CF SECS by including FAC that flow along dipolar field lines. This allows the method to be applied at all latitudes. We name this method dipolar elementary current systems (DECS). Application of the DECS to synthetic data, as well as Swarm satellite measurements are carried out, demonstrating the good performance of this method, and its applicability to studies of ionospheric current systems at low and middle latitudes.
Keywords: Ionospheric current; Magnetic field; SECS method.
© The Author(s) 2020.
Conflict of interest statement
Competing interestsThe authors declare that they have no conflict of interest.
Figures


References
-
- Alken P, Maute A, Richmond AD. The F-region gravity and pressure gradient current systems: a review. Space Sci Rev. 2016;206:451–469. doi: 10.1007/s11214-016-0266-z. - DOI
-
- Alken P, Maute A, Richmond AD, Vanhamäki H, Egbert GD. An application of principal component analysis to the interpretation of ionospheric current systems. J Geophys Res. 2017 doi: 10.1002/2017JA024051. - DOI
-
- Amm O. Ionospheric elementary current systems in spherical coordinates and their application. J Geomagnetism Geoelectricity. 1997;49:947–955. doi: 10.5636/jgg.49.947. - DOI
-
- Amm O, Viljanen A. Ionospheric disturbance magnetic field continuation from the ground to the ionosphere using spherical elementary current systems. Earth Planets Space. 1999;51:431–440. doi: 10.1186/BF03352247. - DOI
-
- Amm O, Vanhamäki H, Kauristie K, Stolle C, Christiansen F, Haagmans R, Masson A, Floberghagen R, Taylor MGGT, Escoubet CP. A method to derive maps of ionospheric conductances, currents, and convection from the Swarm multisatellite mission. J Geophys Res Space Phys. 2015 doi: 10.1002/2014JA020154. - DOI
LinkOut - more resources
Full Text Sources
Miscellaneous