. 2020 Sep 30;5(1):177-239.
doi: 10.20411/pai.v5i1.348. eCollection 2020.

Pharmacological Inhibition of PPARy Boosts HIV Reactivation and Th17 Effector Functions, While Preventing Progeny Virion Release and de novo Infection

Affiliations

Pharmacological Inhibition of PPARy Boosts HIV Reactivation and Th17 Effector Functions, While Preventing Progeny Virion Release and de novo Infection

Delphine Planas et al. Pathog Immun. .

Abstract

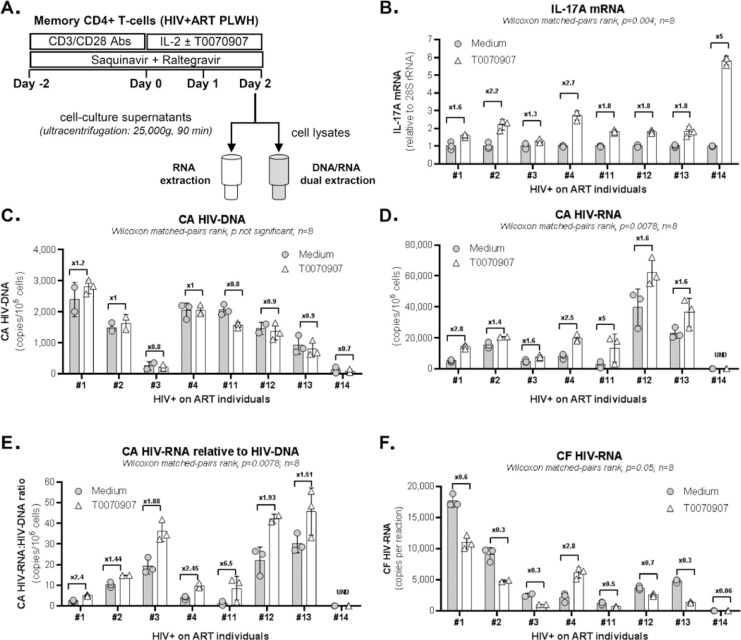
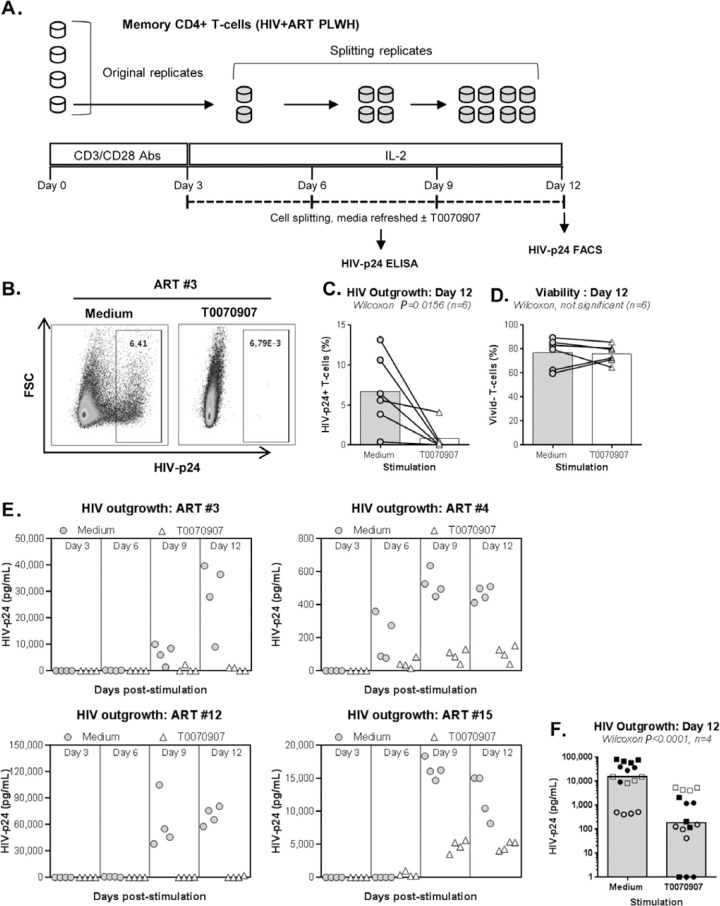
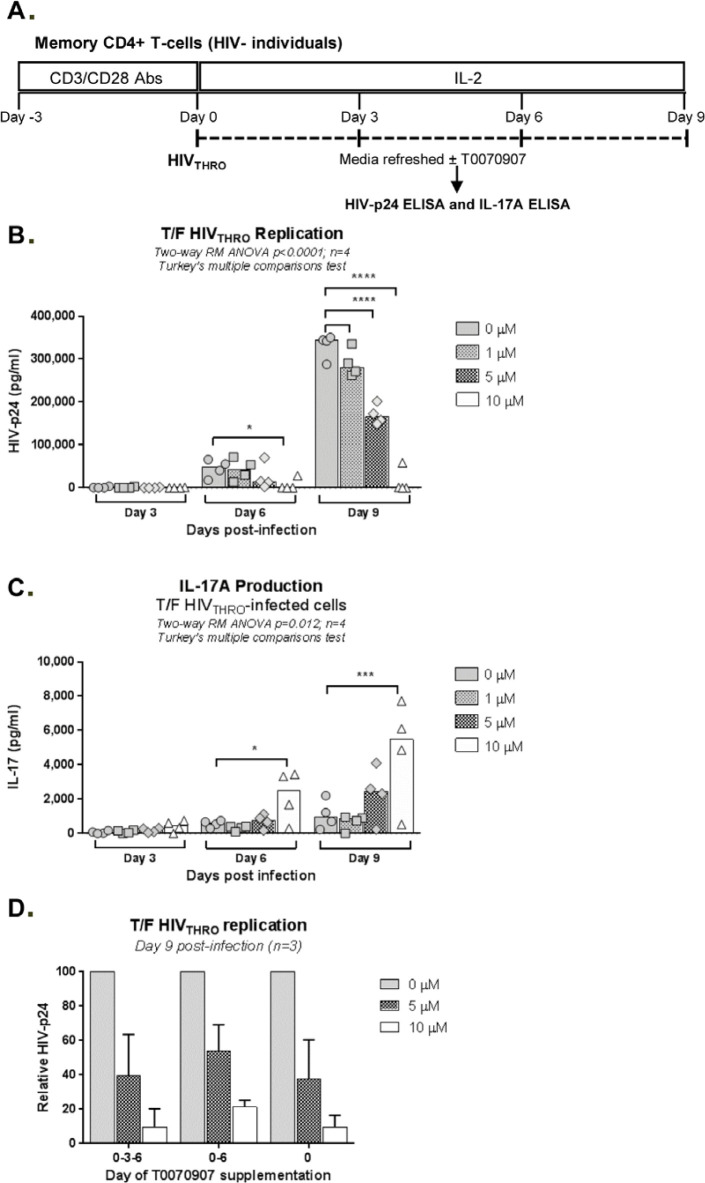
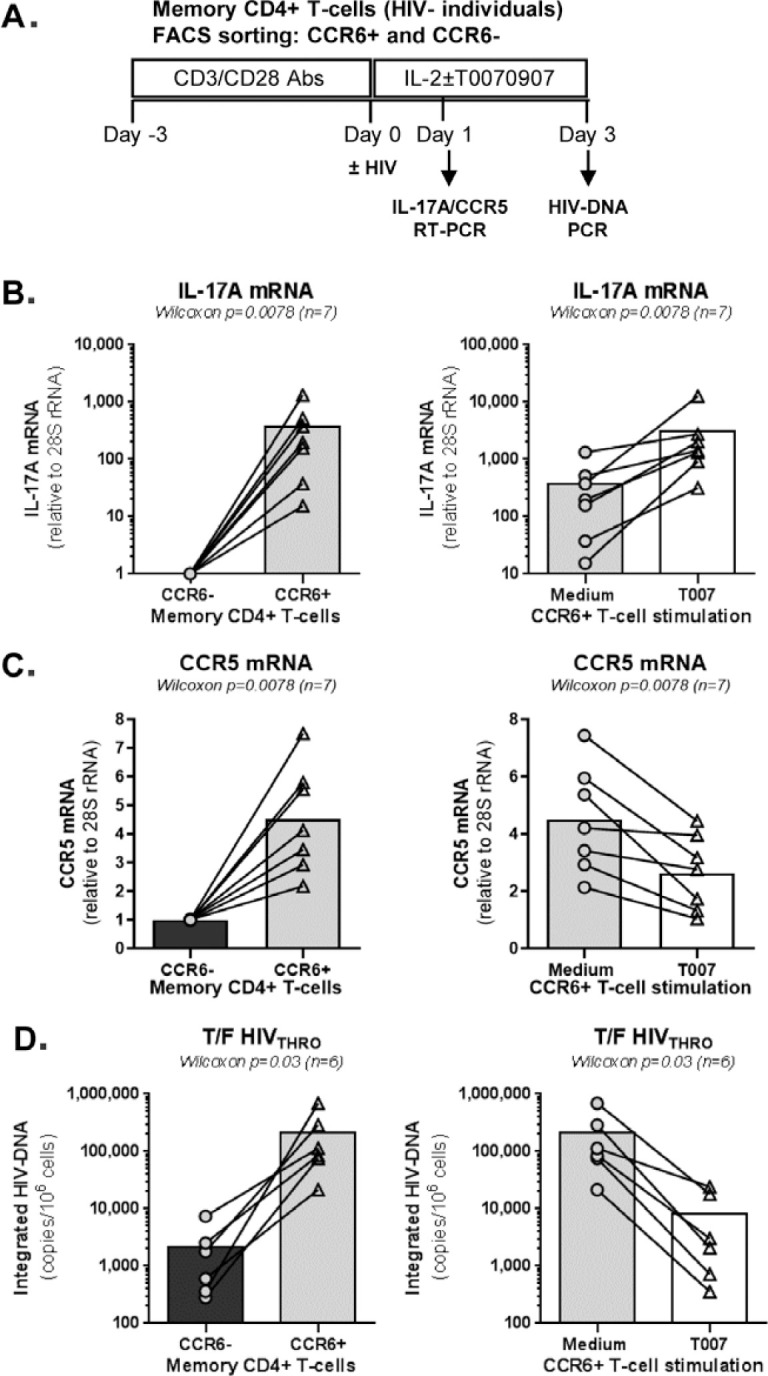
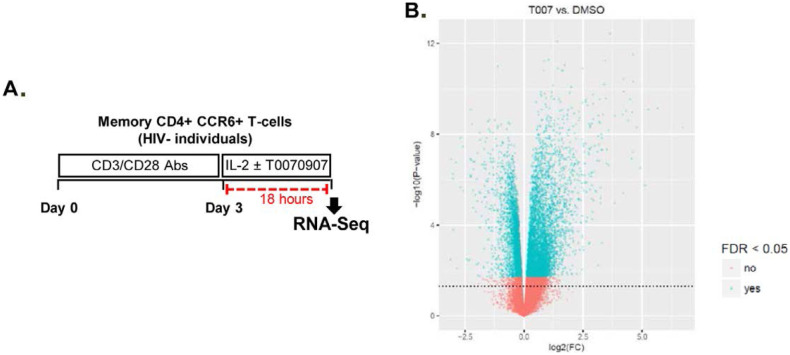
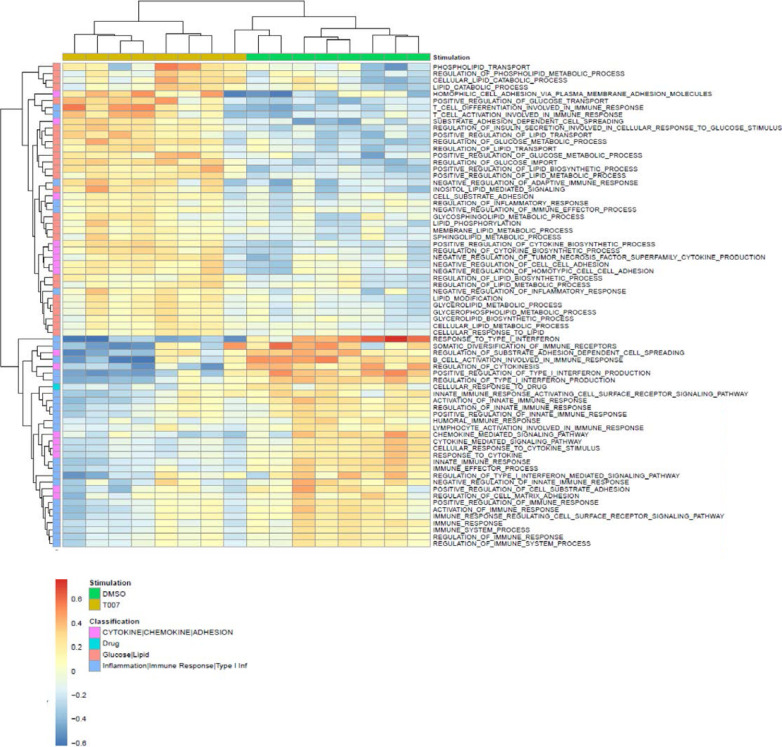
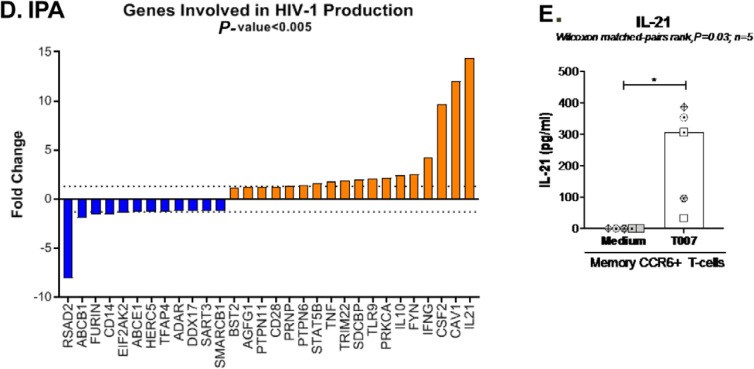
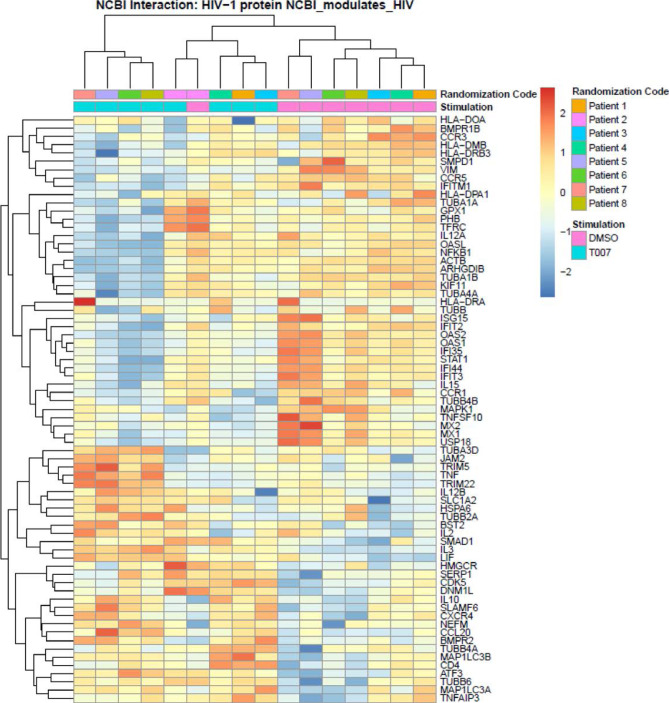
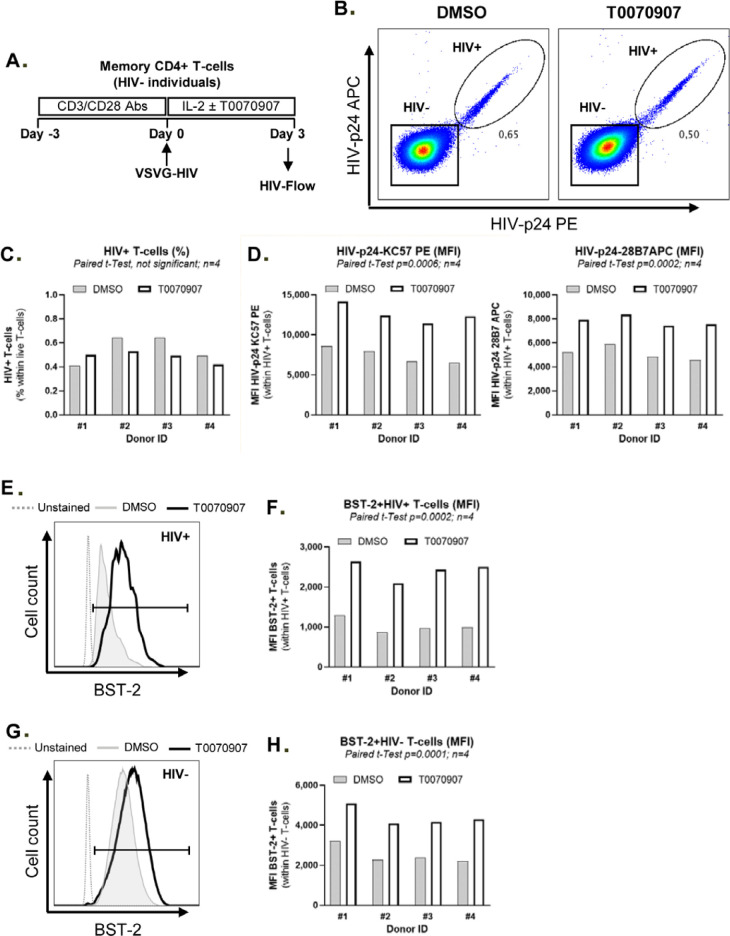
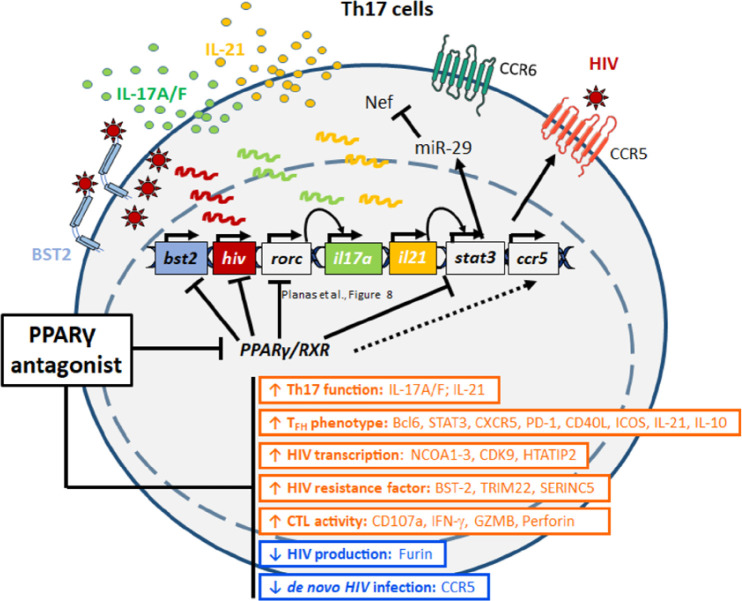
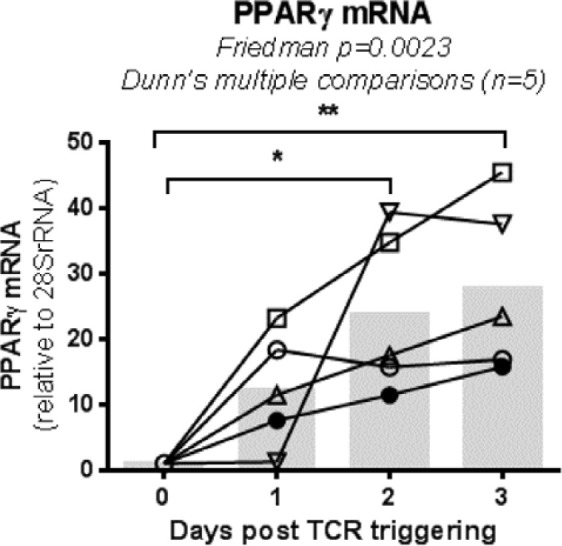
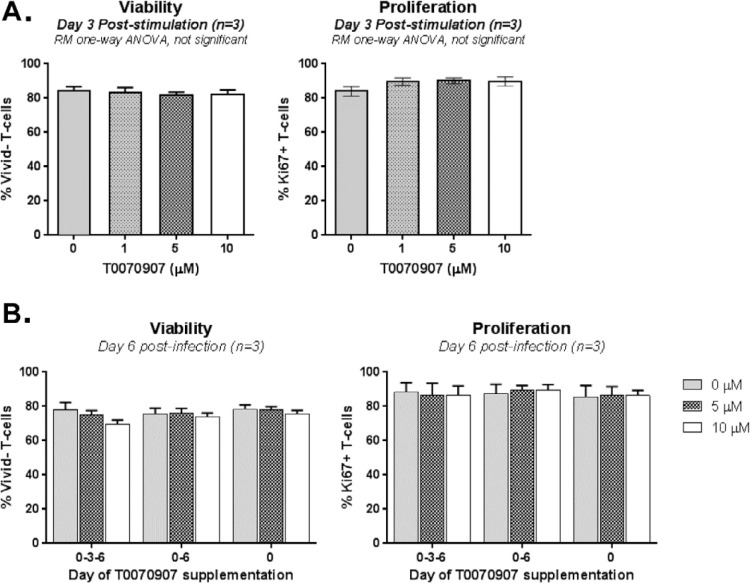
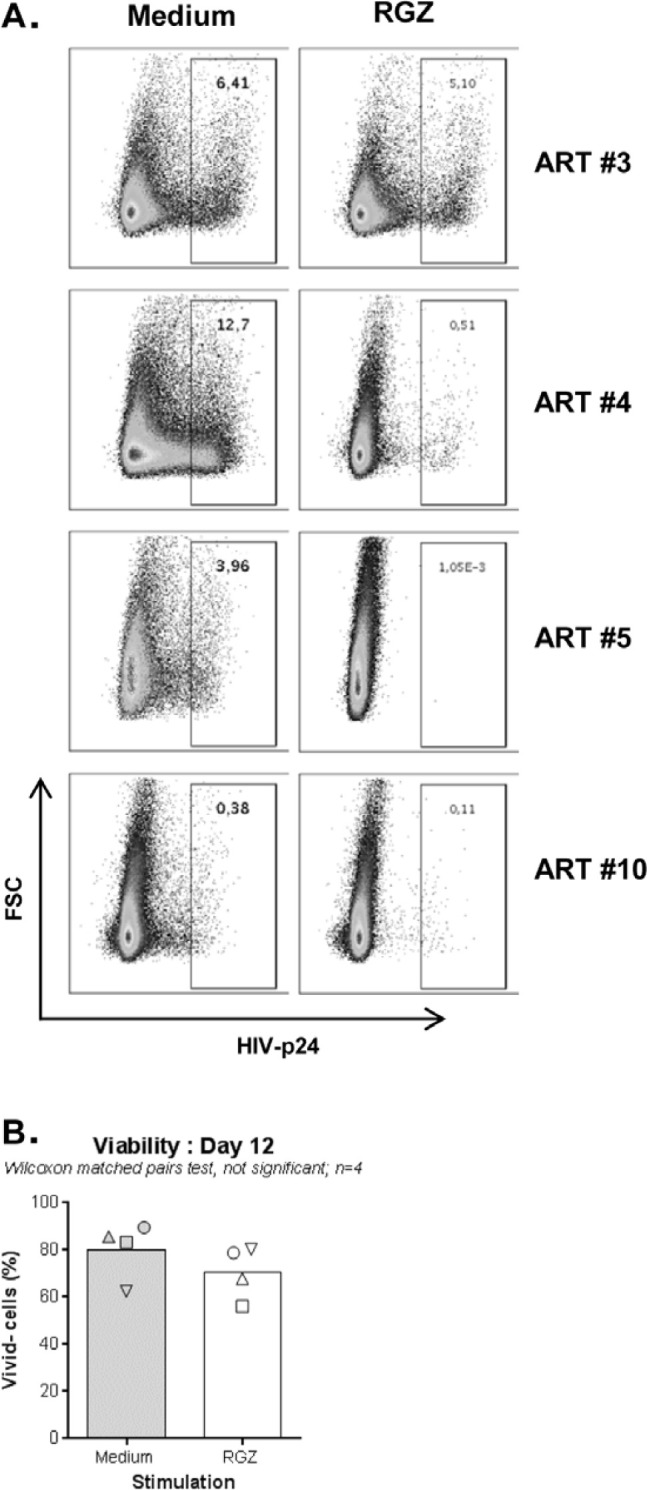
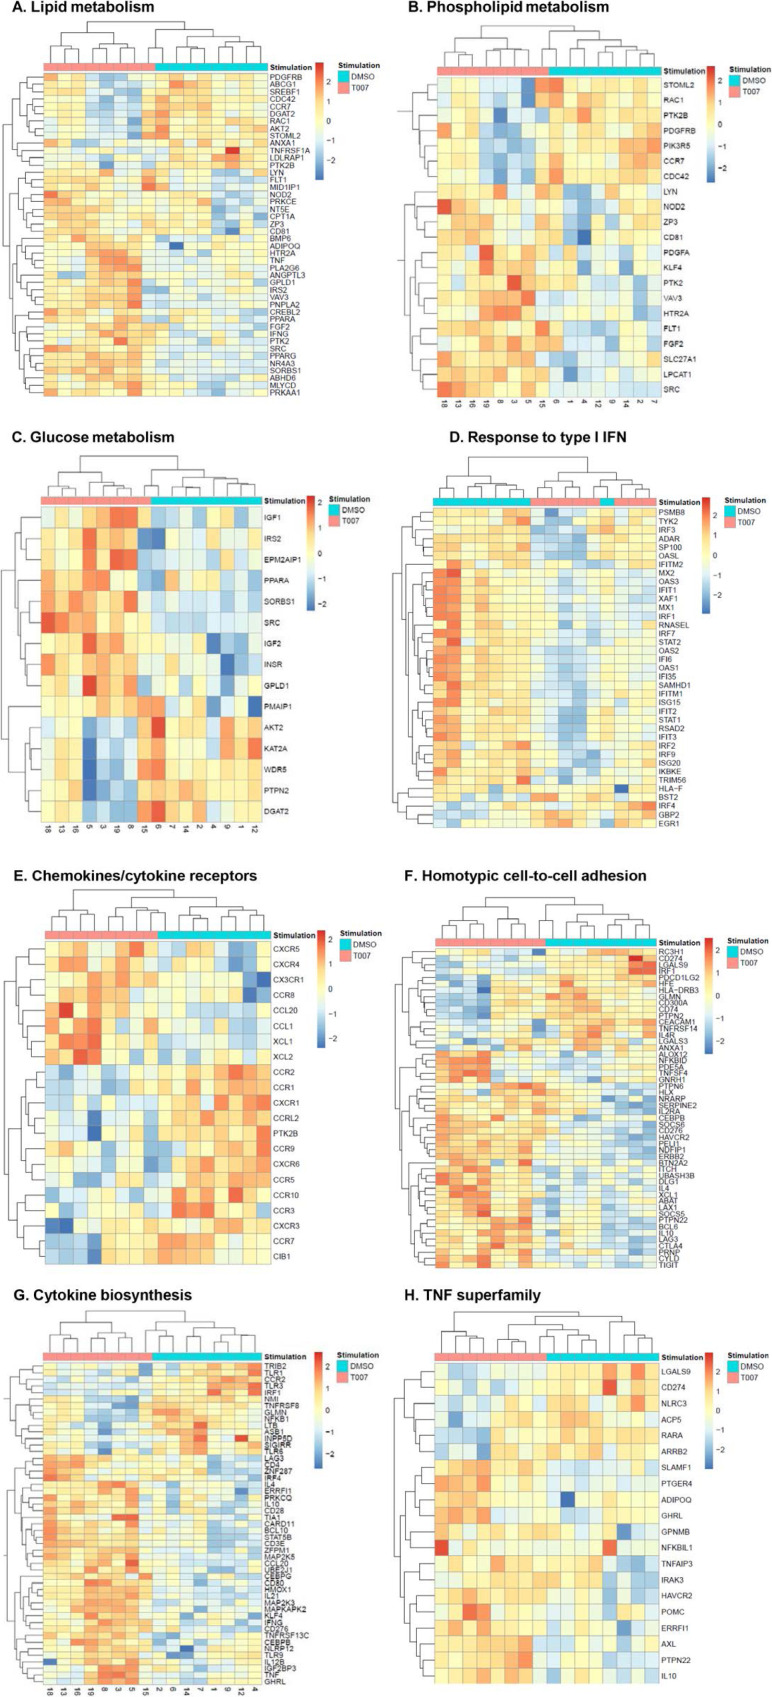
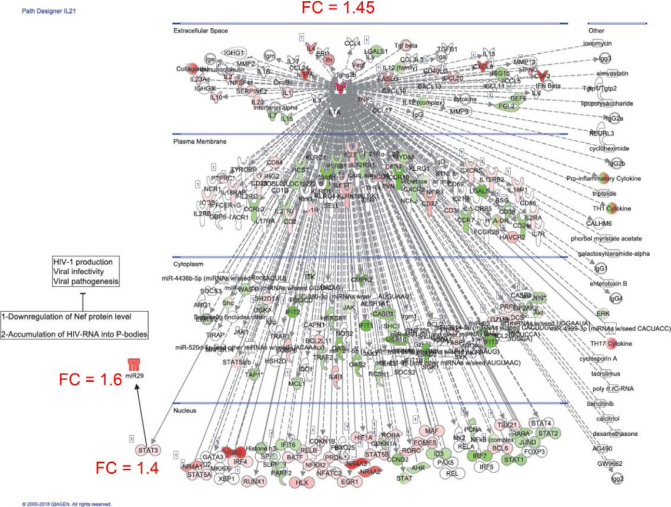
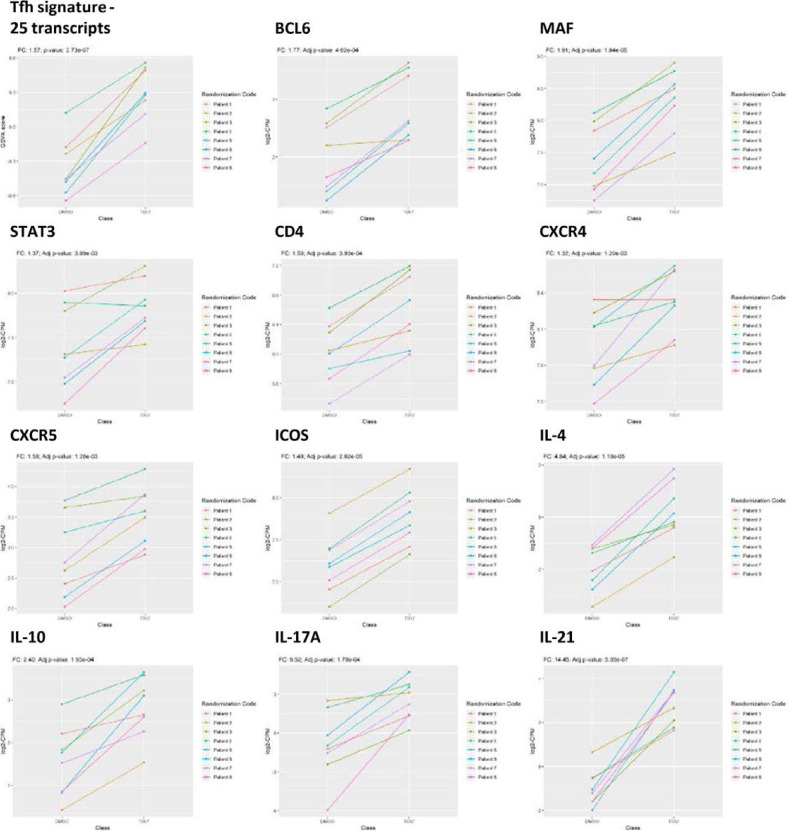
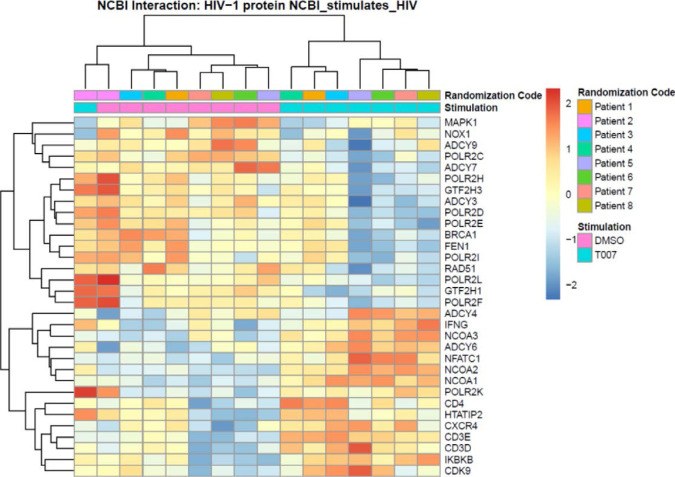
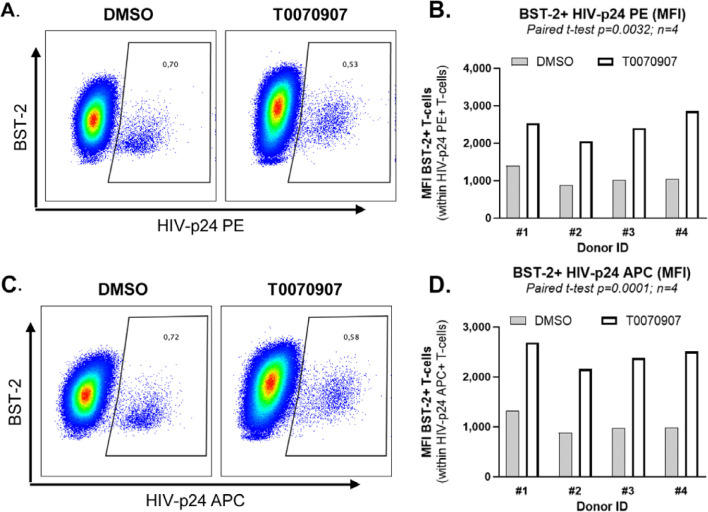
The frequency and functions of Th17-polarized CCR6+RORyt+CD4+ T cells are rapidly compromised upon HIV infection and are not restored with long-term viral suppressive antiretroviral therapy (ART). In line with this, Th17 cells represent selective HIV-1 infection targets mainly at mucosal sites, with long-lived Th17 subsets carrying replication-competent HIV-DNA during ART. Therefore, novel Th17-specific therapeutic interventions are needed as a supplement of ART to reach the goal of HIV remission/cure. Th17 cells express high levels of peroxisome proliferator-activated receptor gamma (PPARy), which acts as a transcriptional repressor of the HIV provirus and the rorc gene, which encodes for the Th17-specific master regulator RORyt. Thus, we hypothesized that the pharmacological inhibition of PPARy will facilitate HIV reservoir reactivation while enhancing Th17 effector functions. Consistent with this prediction, the PPARy antagonist T0070907 significantly increased HIV transcription (cell-associated HIV-RNA) and RORyt-mediated Th17 effector functions (IL-17A). Unexpectedly, the PPARy antagonism limited HIV outgrowth from cells of ART-treated people living with HIV (PLWH), as well as HIV replication in vitro. Mechanistically, PPARy inhibition in CCR6+CD4+ T cells induced the upregulation of transcripts linked to Th17-polarisation (RORyt, STAT3, BCL6 IL-17A/F, IL-21) and HIV transcription (NCOA1-3, CDK9, HTATIP2). Interestingly, several transcripts involved in HIV-restriction were upregulated (Caveolin-1, TRIM22, TRIM5α, BST2, miR-29), whereas HIV permissiveness transcripts were downregulated (CCR5, furin), consistent with the decrease in HIV outgrowth/replication. Finally, PPARy inhibition increased intracellular HIV-p24 expression and prevented BST-2 downregulation on infected T cells, suggesting that progeny virion release is restricted by BST-2-dependent mechanisms. These results provide a strong rationale for considering PPARy antagonism as a novel strategy for HIV-reservoir purging and restoring Th17-mediated mucosal immunity in ART-treated PLWH.

Keywords: ART; CD4+ T cells; HIV-1; IL-21; PPARy; Th17.


Conflict of interest statement

DP, AF, YZ, JPG, JR, AF, MJR, LRM, DC, HC, TRWS, and AG declare no financial or non-financial competing interests to disclose. EAC is a member of the Scientific Advisory Board of Theratechnologies. JPR performed contract research and/or served on Advisory Boards for Gilead Sciences Canada Inc., Merck Canada Inc., Abbvie Corp., ViiV Healthcare, Bristol Myers Squibb, Janssen Inc., Argos Pharmaceuticals from InnaVirVax, and Theravectys. NC received research funding from EMD Serono and served on Advisory Boards for Gilead Sciences. PA's laboratory receives research funding from Glaxo Smith Klein/NeoMed for projects different from the present study. PA served as a Consultant at Merck Canada Inc.

Figures

Figure 1.
Figure 1.
The PPARy antagonist T0070907 increases HIV and IL-17A transcription but inhibits viral release from memory CD4+ T cells of ART-treated PLWH. (A) Shown is the experimental flow chart. Briefly, memory CD4+ T cells of ART-treated PLWH (Table 1, n=8) were activated by CD3/CD28 for 2 days in the presence of ARVs (Saquinavir 5μM; Raltegravir 200nM) to limit cell-to-cell virion spreading, washed and further cultured with ARVs in the presence or the absence of T0070907 (10μM) for other 48 hours. DMSO (1 μL/mL; identified as Medium) was used as a control. Total RNA and DNA levels were dually extracted from cell pellets and total RNA was extracted from cell culture supernatants. (B) IL-17A mRNA was quantified by real-time RT-PCR and normalized to 28S rRNA levels. (C) Cell-associated (CA) HIV-DNA (Gag primers) were quantified by nested real-time PCR and normalized per 106 cells (2 copies CD3-DNA per cell). (D-E) CA HIV-RNA (unspliced, Gag primers) levels were quantified by nested real-time RT-PCR and normalized per 106 cells (D) and HIV-DNA/106 cells (E) using results from panel C. (F) Cell-free (CF) HIV-RNA (Gag primers) copies were quantified by nested real-time RT-PCR in RNA extracted from cell culture supernatants. Each symbol represents 1 experimental replicate (mean±SD). The Wilcoxon matched-pairs signed rank test P-values and the fold change (FC) ratios between medium and T0070907 are indicated on the graphs.
Figure 2.
Figure 2.
T0070907 inhibits HIV outgrowth in memory CD4+ T cells of ART-treated PLWH. (A) Shown is the experimental flow chart for the viral outgrowth assay (VOA) performed with memory CD4+ T cells of ART-treated PLWH. Briefly, cells cultured in 48-well plates (106 cells/well) were activated with CD3/CD28 antibodies for 3 days, washed and cultured in the presence or the absence of T0070907 (10μM) up to 12 days. Cells were split into 2 new wells, supernatants collected and media refreshed every 3 days. At day 12, cells were stained with a viability dye and then intracellularly with HIV-p24 antibodies. (B-D) In a first set of experiments, the VOA was performed with one original replicate (106 cells/well) at day 0 that generated 8 splitting replicates at day 12. Shown is (B) the intracellular HIV-p24 expression in cells pooled from the 8 splitting replicates at day 12 from one representative donor (ART #3), as well as statistical analysis of (C) intracellular HIV-p24 staining and (D) cell viability in n=6 ART-treated PLWH (Table 1; ART #3, #4, #5, #10, #12, and #15). (E-F) In another set of experiments, the VOA was performed in 4 original replicates of 106 cells/well cultured at day 0 that each generated 8 splitting replicates at day 12. Shown are HIV-p24 levels in cell culture supernatant quantified in cell culture supernatant collected from the splitting replicates of each original replicate at days 3 (1 well), 6 (2 wells), 9 (4 wells), and 12 (8 wells) for each donor individually (E) and statistical analysis on n=4 ART-treated PLWH at day 12 (F) (Table 1; ART #3, #4, #12, and #15). Each symbol represents the median HIV-p24 value of 8 splitting replicate wells resulting from 1 original replicate (4 original replicates/donor), with grey circles for Medium and open triangles for T0070907 (E) and different symbols for each donor (F). The Wilcoxon matched-pairs signed rank test P-values and the fold change (FC) ratios between medium and T0070907 are indicated on the graphs.
Figure 3.
Figure 3.
T0070907 boosts IL-17A production and limits T/F HIVTHRO replication in vitro in a dose-dependent manner. (A) Shown is the experimental flow chart. Briefly, memory CD4+ T cells isolated from HIV-uninfected individuals were stimulated by CD3/CD28 for 3 days. (B-C) Cells were exposed to T/F HIVTHRO strain (25 ng/106 cells) and cultured in the presence of IL-2 (5 ng/ml) and in the presence/absence of T0070907 (1, 5, and 10µM) for up to 9 days, with media, IL-2 and/or T0070907 being refreshed every 3 days. Shown are HIV-p24 levels (B) and IL-17A (C) quantified by ELISA in cell culture supernatants at days 3, 6 and 9 post-infection (n=4). Each symbol represents 1 different donor, and bars represent median values. Two-way RM ANOVA P-values and Turkey's multiple comparisons are indicated on the graphs. (D) To determine the effect of single versus multiple T0070907 doses on HIV replication, in another set of experiments, infected cells were cultured in the presence of IL-2 and in the presence/absence of T0070907 (5 and 10µM), with T0070907 being administered either once at day 0 post-infection (0), twice at days 0 and 6 post-infection (0-6), or every 3 days post-infection (0-3-6). Shown are relative HIV-p24 levels quantified by ELISA in cell culture supernatants collected at day 9 post-infection (n=3).
Figure 4.
Figure 4.
T0070907 efficiently increases IL-17A expression and reduces HIV replication in sorted memory CCR6+ T cells. (A) Shown is the experimental flow chart. Briefly, memory CCR6+ and CCR6- T cells of HIV-uninfected individuals (n=6-7) were stimulated by CD3/CD28 for 3 days. (B-C) Cells were cultured in the presence of IL-2 and/or T0070907 (10μM) for 18 hours and RNA extraction was performed for RT-PCR quantification. Shown are results on (B) IL-17A (n=7) and (C) CCR5 (n=7) mRNA expression in CCR6- versus CCR6- T cells cultured in the absence of T0070907 (left panels) and CCR6+ T cells cultured in the presence/absence of T0070907 (right panels). Normalization was performed relative to 28S rRNA, with expression in CCR6-T cells being considered 1. (D) Another fraction of cells was exposed to T/F HIVTHRO strain (25 ng/106 cells) and cultured in the presence of IL-2 and/or T0070907 (10μM) for 3 additional days. Shown are levels of HIV-DNA integration (as a measure of HIV replication) in CCR6- versus CCR6+ T cells in the absence of T0070907 (left panel) and in CCR6+ T cells cultured in the presence/absence of T0070907 (right panel). The Wilcoxon signed rank test P-values are indicated on the graphs. Each symbol represents results generated with cells from one different donor; bars represent median values.
Figure 5.
Figure 5.
T0070907 imprints CCR6+CD4+ T cells with an anti-viral transcriptional program. (A) Shown is the experimental flow chart for genome-wide transcriptional analysis. Briefly, memory CCR6+ T cells of HIV-uninfected individuals (n=8) were stimulated by CD3/CD28 for 3 days and cultured with IL-2 in the presence/absence of T0070907 (10μM) for additional 18 hours. Total RNA was extracted for RNA sequencing. (B) Volcano plots for all probes in each linear model with the log2 FC on the x-axis and the negative logarithm of the adjusted P-values for false discovery rate (FDR) on the y-axis. The red/green color code is based on the 5% FDR threshold. (C) Heatmap represents 71 pathways included in the gene ontology (GO) classification: cytokines/chemokines (pink), drug transporters (blue), glucose/lipid metabolism (orange), and inflammation/immune response to type I interferon (violet) based on the 5% FDR threshold. Heatmap cells are scaled by the expression level z-scores for each probe individually. (D) Ingenuity pathway analysis (IPA) identified genes involved in HIV-1 production and differentially modulated by T0070907 (P<0.05). The y-axis represents the FC, with the 1.3 FC cut-off indicated by the dotted line. (E) IL-21 levels in cell culture supernatants were quantified by ELISA (n=5). Each symbol represents 1 different donor; bars represent median values. Wilcoxon matched-pairs signed rank test are indicated on the graphs.
Figure 5C.
Figure 5C.
GSVA on GO pathways
Figure 5D and 5E
Figure 5D and 5E
Figure 6.
Figure 6.
Meta-analysis using the NCBI HIV interaction database. Genome-wide transcriptional profiles were generated as in Figure 5. (A) Transcripts modulated by T0070907 in CCR6+ T cells (P <0.05, FC cutoff 1.3) were matched to the lists of human genes included on the NCBI HIV interaction database. Heat-map cells are scaled by the expression level z-scores for each probe individually. Results from each donor are indicated with a different color code (n=8).
Figure 7.
Figure 7.
T0070907 prevents BST-2 downregulation on HIV-infected T cells. (A) Shown is the experimental flow chart. Briefly, memory CD4+ T cells isolated from HIV-uninfected individuals were stimulated with anti-CD3/CD28 antibodies for 3 days, exposed to single round VSV-G/HIV for 3 hours. Then, cells were cultured in the presence of IL-2 (5 ng/ml) and in the presence or the absence (DMSO) of T0070709 (10μM) for 3 additional days. HIV-Flow using 2 distinct HIV-p24 antibody clones coupled with different fluorochromes (28B7 APC and PE), together with surface staining with BST-2 and CD4 antibodies, were performed and analyzed by flow cytometry. Shown is the co-expression of HIV-p24 PE and APC antibodies allowing the identification of productively infected cells (HIV+) in 1 representative donor (B) and the statistical analysis of the % of HIV+ cells (C) and the MFI of HIV-p24 PE and APC expression on exposure to DMSO or T0070907 in 4 different donors (D). Shown are histograms from 1 representative donor for BST-2 and CD4 expression (E and G), as well as the statistical analyses of BST-2 and CD4 expression (% and MFI) on HIV+ cells in 4 different donors (F and H). Paired t-test values are indicated on the graphs.
Figure 8.
Figure 8.
Summary of PPARy antagonism-mediated virological/immunological reprogramming of CCR6+ T cells. In line with the documented capacity of PPARy to repress HIV and RORyt transcription, the PPARy antagonist T0070907 acted on CCR6+ Th17 cells to boost both HIV transcription (NCOA1-3, HTATIP2, CDK9) and the expression of specific Th17/Tfh transcripts (eg, IL-17A, IL-21). Unexpectedly, the PPARy antagonism prevented de novo production/release of virions from reservoir cells by negatively interfering with multiple steps of the HIV replication cycle, from virion maturation (eg, furin) and viral particle release (eg, BST2), to viral entry into new target cells (eg, CCR5), as well as the IL-21/miR-29 antiviral axis. Thus, the PPARy antagonism may represent a new strategy to eradicate HIV reservoirs in Th17 cells. Table 1: Clinical parameters of ART-treated PLWH study participants.
Supplementary Figure 1.
PPARy mRNA express is introduced by TCR triggering. RNA was extracted from memory CD4+ T cells from HIV-uninfected individuals (n=5), either freshly-isolated (Day 0) or stimulated CD3/CD28 for 1, 2, or 3 days. PPARy mRNA levels were quantified by RT-PCR (triplicates, 60 ng RNA/test). Each symbol represents results generated with cells from a different individual. Grey bars indicate median PPARy mRNA levels for n=5. Friedman test P-values and Dunn's multiple comparisons are indicated on the graph.
Supplementary Figure 2.
Effects of T0070907 of CD4+ T-cell viability and proliferation. (A) Memory CD4+ T cells isolated from HIV-uninfected individuals were 11 stimulated by CD3/CD28 and cultured in the presence/absence of different doses of 12 T0070907 (1, 5, and 10μM) for 3 days, with T0070907 being administered only once. 13 Cells were stained with a viability dye (Vivid), and then intranuclear staining was 14 performed with Ki67 antibodies; Ki67, a marker for cell cycle progression, was used as a 15 surrogate marker of cell proliferation. Shown is cell viability (Vivid-cells, left panel) 16 and proliferation (Ki67+ cells, right panel) measured by flow cytometry with cells from 17 n=3 individuals. (B) Memory CD4+ T cells isolated from HIV-uninfected individuals 18 were stimulated by CD3/CD28, infected with HIVTHRO (as described in Figure 3 legend), 19 and cultured in the presence or the absence of T0070907 (5 and 10 μM). To determine 20 the effect of single versus multiple T0070907 doses on cell viability/proliferation, 21 T0070907 was administered either once at day 0 post-infection (0), twice at days 0 and 6 post-infection (0-6), or every 3 days post-infection (0-3-6). Shown are mean±SD of values obtained with cells from n=3 individuals.
Supplementary Figure 3.
RGZ limits HIV outgrowth in memory CD4+ T cells of ART-treated PLWH. A VOA was performed with memory CD4+ T cells of ART treated PLWH (Table 1; ART #3, 4, 5, and 10) in the presence/absence of rosiglitazone (RGZ; 50 µM). At day 12 post-culture, cells were stained as in Figure 2B. Shown is the effect of RGZ on the intracellular expression of HIV-p24 in 4 different ART-treated PLWH (A), as well as the effect of RGZ exposure on cell viability (B). Wilcoxon matched-pairs signed rank test P-values are indicated on the graph in B.
Supplementary Figure 4.
T0070907 decreases CCR5 expression on memory CD4+ T cells. Memory CD4+ T cells from HIV-uninfected individuals were stimulated by CD3/CD28 for 3 days and then cultured in the presence/absence of T0070907 (10 µM) for 2 additional days. The expression of HIV-1 receptor CD4 and co-receptors CCR5 and CXCR4 was measured by flow cytometry. Shown are histograms from 1 representative donor (A), and the statistical analyses of CD4 (B), CCR5 (C), and CXCR4 (D) expression (% and MFI) in 3 different donors. Each symbol represents 1 different donor and bars represent median values. Paired t-test values are indicated on the graphs.
Supplementary Figure 5.
Gene Ontology (GO) classification of transcripts modulated by T0070907 in CCR6+ T cells. RNA-Seq transcriptional profiles were generated as described in Figure 5. Differentially expressed genes (P<0.05) were classified based on their biological functions using GO terms as follows: lipid metabolism (A), phospholipid metabolism (B), glucose metabolism (C), response to type I IFN (D), chemokines/cytokines receptors (E), homotypic cell-to-cell adhesion (F), cytokine biosynthesis (G), and TNF superfamily (H). Heatmap cells are scaled by the expression level z-scores for each probe individually. For each heatmap, gene expression values are represented as a gradient from red (highest expression) to blue (lowest expression). Results were generated with cells from n=8 donors, with each column representing 1 donor.
Supplementary Figure 6.
Components of the IL-21 signalizing pathway modulated by T0070907 in CCR6+ T cells. RNA-Seq transcriptional profiles were generated as described in Figure 5. Ingenuity pathway analysis (IPA) was used to illustrate gene networks associated with IL-21. The color code is based on the expression FC in T0070907-treated CCR6+ versus untreated CCR6+ T cells (red and green for upregulated and downregulated transcripts, respectively). FC expression relative to IL-21, STAT3, and miR-29 in T0070907-treated versus untreated CCR6+ T cells are illustrated. The miR-29 connection to the IL-21 network was added manually based on a recent publication demonstrating that IL-21 regulates its expression by STAT3 (75).
Supplementary Figure 7.
T0070907 acts on CCR6+ T cells to promote expression of follicular helper T-cell (Tfh) marker transcripts. RNA-Seq transcriptional profiles were generated as described in Figure 5. An intelligent search was performed to identify Tfh-specific transcripts among transcripts upregulated by T0070907 in CCR6+ T cells. Shown are changes in the expression of 25 Tfh-specific transcripts identified in the literature (Crotty, 2019), as well as individual Tfh-specific transcription factors (BCL6, MAF, and STAT3), surface molecules (CD4, CXCR4, CXCR5, and ICOS), and cytokines (IL-4, IL-10, IL-17A, and IL-21). Results from n=8 individual donors are represented in different colors.
Supplementary Figure 8.
Meta-analysis using the NCBI HIV interaction database. RNA-Seq transcriptional profiles were generated as described in Figure 5. Transcripts differentially expressed in CCR6+ T cells cultured in the presence/absence of T0070907 (P< 0.05, FC cut-off 1.3) were matched to the lists of human genes previously identified to interact with HIV-1 proteins (NCBI Interactor database). Heatmap cells are scaled by the expression level z-scores for each probe individually. For each heatmap, gene expression values are represented as a gradient from red (highest expression) to blue (lowest expression). Results from each donor are indicated with a different color code (n=8).
Supplementary Figure 9.
T0070907 prevents BST-2 downregulation on HIV-infected cells. Experiments were performed as described in Figure 7 legend. Shown are dot plots of BST-2 and HIVp-24 PE or HIV-p24 APC co-expression (A and C), as well as the statistical analyses for BST-2 expression (MFI) on HIV-p24 PE+ and HIV-p24 APC+ T different donors (B and D). Paired t-test values are indicated on the graphs.

Similar articles

Cited by

References

    1. Barre-Sinoussi F, Ross AL, Delfraissy JF.. Past, present and future: 30 years of HIV research. Nature reviews Microbiology. 2013;11(12):877-83. Epub 2013/10/29. doi: 10.1038/nrmicro3132. PubMed PMID: 24162027. - DOI - PubMed
    1. Martin AR, Siliciano RF.. Progress Toward HIV Eradication: Case Reports, Current Efforts, and the Challenges Associated with Cure. Annual review of medicine. 2016;67:215-28. Epub 2015/11/04. doi: 10.1146/annurev-med-011514-023043. PubMed PMID: 26526767. - DOI - PubMed
    1. Deeks SG, Lewin SR, Ross AL, Ananworanich J, Benkirane M, Cannon P, Chomont N, Douek D, Lifson JD, Lo YR, Kuritzkes D, Margolis D, Mellors J, Persaud D, Tucker JD, Barre-Sinoussi F, International ASTaCWG, Alter G, Auerbach J, Autran B, Barouch DH, Behrens G, Cavazzana M, Chen Z, Cohen EA, Corbelli GM, Eholie S, Eyal N, Fidler S, Garcia L, Grossman C, Henderson G, Henrich TJ, Jefferys R, Kiem HP, Mc-Cune J, Moodley K, Newman PA, Nijhuis M, Nsubuga MS, Ott M, Palmer S, Richman D, Saez-Cirion A, Sharp M, Siliciano J, Silvestri G, Singh J, Spire B, Taylor J, Tolstrup M, Valente S, van Lunzen J, Walensky R, Wilson I, Zack J.. International AIDS Society global scientific strategy: towards an HIV cure 2016. Nature medicine. 2016;22(8):839-50. Epub 2016/07/12. doi: 10.1038/nm.4108. PubMed PMID: 27400264; PMCID: PMC5322797. - DOI - PMC - PubMed
    1. Chomont N, DaFonseca S, Vandergeeten C, Ancuta P, Sekaly RP.. Maintenance of CD4+ T-cell memory and HIV persistence: keeping memory, keeping HIV. Curr Opin HIV AIDS. 2011;6(1):30-6. Epub 2011/01/19. doi: 10.1097/COH.0b013e3283413775. PubMed PMID: 21242891. - DOI - PubMed
    1. Sengupta S, Siliciano RF.. Targeting the Latent Reservoir for HIV-1. Immunity. 2018;48(5):872-95. Epub 2018/05/17. doi: 10.1016/j.immuni.2018.04.030. PubMed PMID: 29768175; PMCID: PMC6196732. - DOI - PMC - PubMed