. 2020 Sep 15;2(10):613-623.
doi: 10.1096/fba.2020-00034. eCollection 2020 Oct.

The G-protein-coupled chemoattractant receptor Fpr2 exacerbates neuroglial dysfunction and angiogenesis in diabetic retinopathy

Affiliations

The G-protein-coupled chemoattractant receptor Fpr2 exacerbates neuroglial dysfunction and angiogenesis in diabetic retinopathy

Ying Yu et al. FASEB Bioadv. .

Abstract

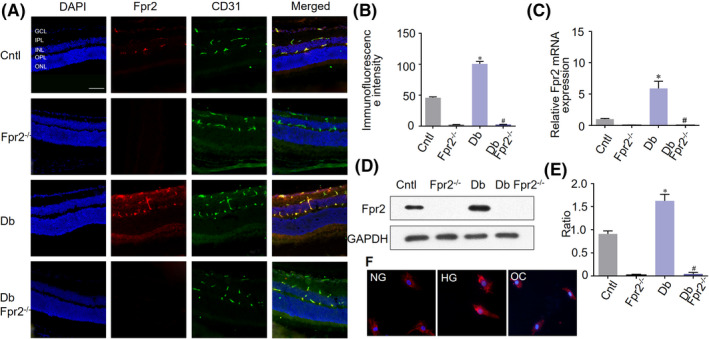
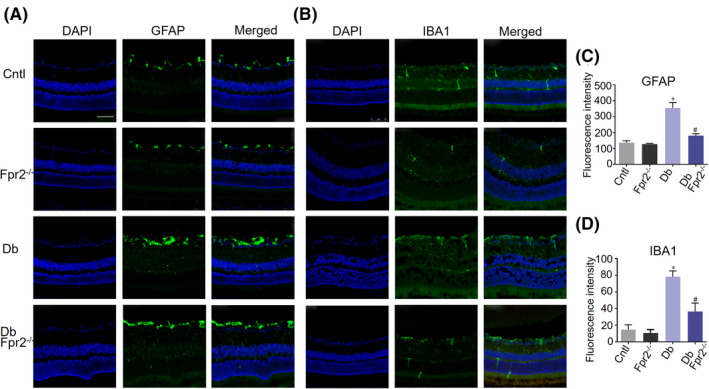
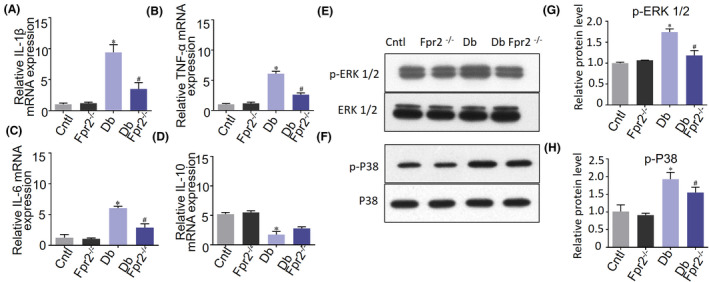
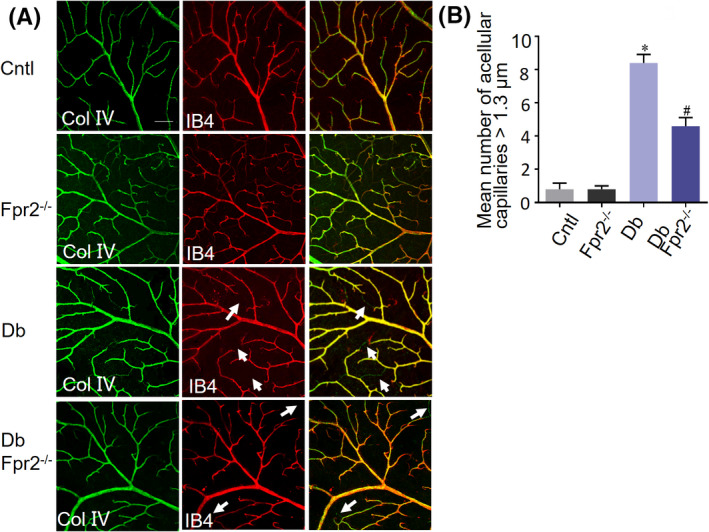
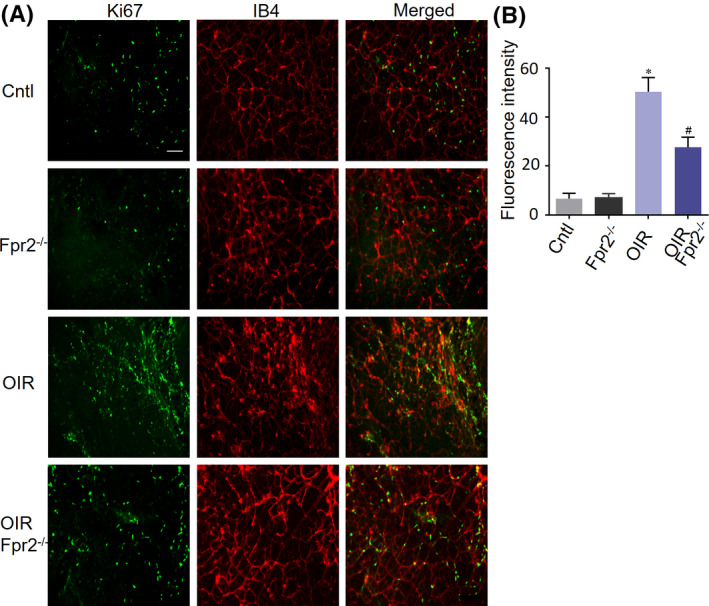
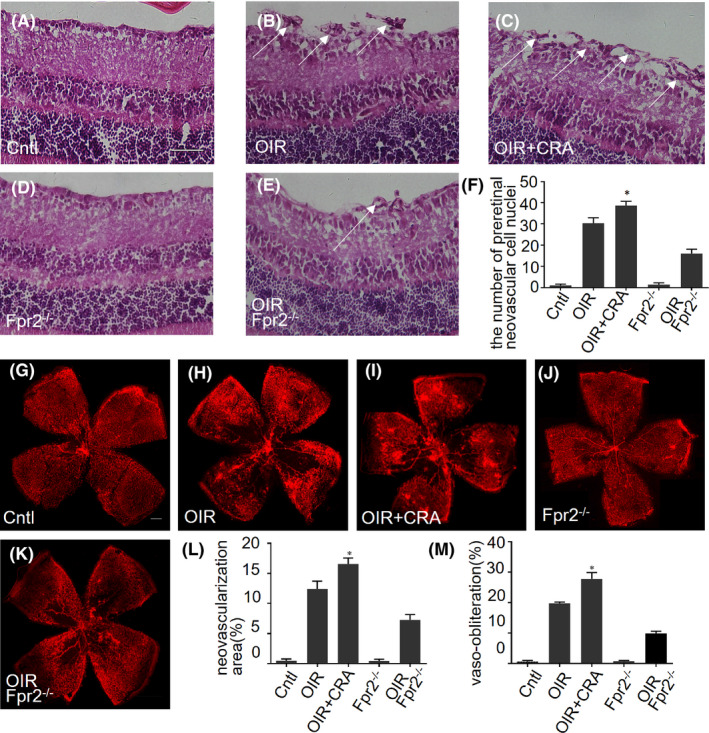
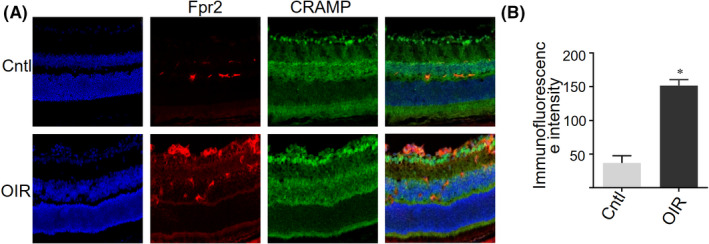
Diabetic retinopathy (DR) as a retinal neovascularization-related disease is one of the leading causes of irreversible blindness in patients. The goal of this study is to determine the role of a G-protein-coupled chemoattractant receptor (GPCR) FPR2 (mouse Fpr2) in the progression of DR, in order to identify novel therapeutic targets. We report that Fpr2 was markedly upregulated in mouse diabetic retinas, especially in retinal vascular endothelial cells, in associated with increased number of activated microglia and Müller glial cells. In contrast, in the retina of diabetic Fpr2 -/- mice, the activation of vascular endothelial cells and glia was attenuated with reduced production of proinflammatory cytokines. Fpr2 deficiency also prevented the formation of acellular capillary during diabetic progression. Furthermore, in oxygen-induced retinopathy (OIR) mice, the absence of Fpr2 was associated with diminished neovasculature formation and pathological vaso-obliteration region in the retina. These results highlight the importance of Fpr2 in exacerbating the progression of neuroglial degeneration and angiogenesis in DR and its potential as a therapeutic target.

Keywords: Fpr2; diabetic retinopathy; glial cell; neovascularization.


Figures

Figure 1
Figure 1
The expression of Fpr2 in mouse retinas with STZ‐induced diabetes. Fpr2 −/− mice and WT littermates were treated with STZ to induce diabetes. Control mice were injected with citrate buffer. A, Immunofluorescence staining of Fpr2 (red), CD31 (green) and nuclei (blue) in the retinas of C57BL/6 J (Cntl), Fpr2 −/− (Fpr2 −/−), diabetic WT (Db), and diabetic Fpr2 −/− (Db Fpr2 −/−) mice. Scale bar: 75 μm. B, Fpr2 immunofluorescence intensity quantified based on images in (A). * indicates significantly (p < .05) increased Fpr2 intensity in Db WT mouse retinas compared with normal mouse retinas. # indicates the absence of Fpr2 fluorescence in Db Fpr2 −/− mouse retinas compared with Db WT retinas. C, Fpr2 mRNA in each mouse group. * indicates significantly increased (p < .05) Fpr2 mRNA in Db WT mouse retinas compared with normal mouse retinas. # indicates the absence of Fpr2 mRNA in Db Fpr2 −/− mouse retinas compared with Db WT mouse retinas. D, Western blotting showing Fpr2 in protein the retina of mice. E, Densitometry quantification of Fpr2 protein. Results are presented as fold changes. * indicates significantly increased (p < .05) Fpr2 protein in Db WT mouse retinas compared with normal mouse retinas. # indicates the absence of Fpr2 protein in Db Fpr2 −/− mouse retinas compared with Db WT mouse retinas. F, Immunofluorescence staining of Fpr2 (red) in mRMECs
Figure 2
Figure 2
The expression of glial markers in mouse retinas with STZ‐induced diabetes. Immunofluorescence staining of GFAP and IBA1 in retinas of WT C57BL/6 J (Cntl), Fpr2 −/− (Fpr2 −/−), diabetic WT (Db) and diabetic Fpr2 −/− (Db Fpr2 −/−) mice. Scale bar: 75 μm. A, GFAP staining of the retinal Müller glial cells and astrocytes. B, IBA1 staining of the retinal microglial cells. C, GFAP immunofluorescence intensity quantified based on images in (A). * indicates significantly (p < .05) increased GFAP intensity in Db WT mouse retinas compared with normal mice retinas. # indicates significantly (p < .05) decreased GFAP intensity in Db Fpr2 −/− mouse retinas compared with Db WT mouse retinas. D, IBA1 immunofluorescence intensity quantified based on images in (B). * indicates significantly (p < .05) increased IBA1 intensity in Db WT mouse retinas compared with WT mouse retinas. # indicates significantly (p < .05) decreased IBA1 intensity in Db Fpr2 −/− mouse retinas compared with Db WT mouse retinas
Figure 3
Figure 3
Inflammatory cytokine mRNA and MAPR phosphorylation in the retinas of diabetic mice. A‐D, Cytokine mRNA expression in diabetic mouse retinas measured by RT‐PCR. Histograms represent quantification of mRNA expression. The average value for each sample was normalized against the amount of GAPDH. Cytokine mRNA measured includes IL‐1β, IL‐6, TNF‐α, and IL‐10. * indicates significantly (p < .05) increased mRNA levels in diabetic WT mice. # indicates significantly (p < .05) decreased mRNA levels in diabetic Fpr2 −/− mice. E, F, Western blotting performed to examine the phosphorylation of P38 and ERK1/2 in the retinas of diabetic mice. E, ERK1/2 phosphorylation in diabetic mice. F, P38 phosphorylation in diabetes mice. G, Densitometry quantification of ERK1/2 phosphorylation normalized against total ERK. Results are presented as fold changes. * indicates significantly (p < .05) increased ERK phosphorylation in diabetic WT mice. # indicates significantly (p < .05) decreased ERK1/2 phosphorylation in diabetic Fpr2 −/− mice. H, Densitometry quantification of phosphorylated P38 normalized against total P38. Results are presented as fold changes. * indicates significantly (p < .05) increased P38 phosphorylation in diabetic WT mice. # indicates significantly (p < .05) decreased P38 phosphorylation in diabetic Fpr2 −/− mice.
Figure 4
Figure 4
Pathological acellular capillaries in diabetic mouse retinas. Retinal flat mount was analyzed for pathological acellular capillaries. A, The retinal vasculature visualized in flat mounts using concomitant labeling of endothelium (IB4) and basement membrane (collagen IV). Acellular capillaries are visualized by continual collagen IV positivity with loss of endothelium. Images show acellular capillaries (arrows) with collagen IV positive (green) and IB4 negative (red) vessels. B, The number of >1.3 μm acellular capillaries in mouse retinas. * indicates significantly (p < .05) increased number in Db WT mouse retinas compared with normal WT mouse retinas. # indicates significantly (p < .05) decreased number in Db Fpr2 −/− mouse retinas compared with Db WT mouse retinas
Figure 5
Figure 5
The effect of Fpr2 on cell proliferation in the retinas of OIR mice. Retinal proliferation was visualized in flat mounts by concomitant labeling of endothelium IB4 (red) and Ki67 (green). A, Increased cell proliferation was observed in oxygen‐induced WT mouse retinas than in WT C57BL/6 J (Cntl) mouse retinas. Cell proliferation was significantly reduced in Fpr2 −/− OIR mouse retinas. B, Immunofluorescence intensity quantified based on images in (A). * indicates significantly (p < .05) increased intensity in Db WT mouse retinas compared with normal mice retinas. # indicates significantly (p < .05) decreased intensity in Db Fpr2 −/− mouse retinas compared with Db WT mouse retinas
Figure 6
Figure 6
The effect of Fpr2 on pathological angiogenesis in OIR mice. H&E staining was used to detect pathological retinal neovascularization. A‐E, Neovascular cell nuclei anterior to internal limiting membrane (ILM) that represent the extent of retinal neovascularization in the retinas as indicated with arrows. F, The number of preretinal neovascular cell nuclei on the vitreous side of ILM calculated based on (A). *indicates significantly (p < .05) increased neovascular cell nuclei in OIR WT mice treated with CRAMP compared with OIR WT mice. The retinal flat‐mount staining with isolectin IB4 was measured to analyze neovascularization (NV) and vaso‐obliteration (VO) areas. G‐K, Images of NV and VO areas in the retinas of each mouse group. L, NV areas quantified based on images in (G‐K). *indicates significantly (p < .05) increased NV areas in OIR WT mice treated with CRAMP compared with OIR WT mice. M, VO areas quantified based on images in (G‐K). *indicates significantly (p < .05) increased VO areas in WT OIR mice treated with CRAMP compared with WT OIR mice
Figure 7
Figure 7
The expression of CRAMP in the retina of OIR mice. CRAMP was detected by immunofluorescence in the retina of OIR mice. A, Increased level of CRAMP in OIR WT mouse retinas compared with normal WT retinas. CRAMP: green, Fpr2: red and nuclei: blue. B, CRAMP immunofluorescence intensity quantified based on images in (A). * indicates significantly (p < .05) increased CRAMP intensity in OIR WT mouse retinas compared with normal WT mouse retinas

Similar articles

Cited by

References

    1. Ting DS, Cheung GC, Wong TY. Diabetic retinopathy: global prevalence, major risk factors, screening practices and public health challenges: a review. Clin Exp Ophthalmol. 2016;44:260–277. - PubMed
    1. Stitt AW, Curtis TM, Chen M, et al. The progress in understanding and treatment of diabetic retinopathy. Prog Retin Eye Res. 2016;51:156–186. - PubMed
    1. Kwong TQ, Mohamed M. Anti‐vascular endothelial growth factor therapies in ophthalmology: current use, controversies and the future. Br J Clin Pharmacol. 2014;78:699–706. - PMC - PubMed
    1. Yu Y, Chen H, Su SB. Neuroinflammatory responses in diabetic retinopathy. J Neuroinflammation. 2015;12:141. - PMC - PubMed
    1. Rungger‐Brandle E, Dosso AA, Leuenberger PM. Glial reactivity, an early feature of diabetic retinopathy. Invest Ophthalmol Vis Sci. 2000;41:1971–1980. - PubMed

LinkOut - more resources