

Human Hematopoietic Stem, Progenitor, and Immune Cells Respond Ex Vivo to SARS-CoV-2 Spike Protein
- PMID: 33089452
- PMCID: PMC7577648
- DOI: 10.1007/s12015-020-10056-z
Human Hematopoietic Stem, Progenitor, and Immune Cells Respond Ex Vivo to SARS-CoV-2 Spike Protein
Abstract
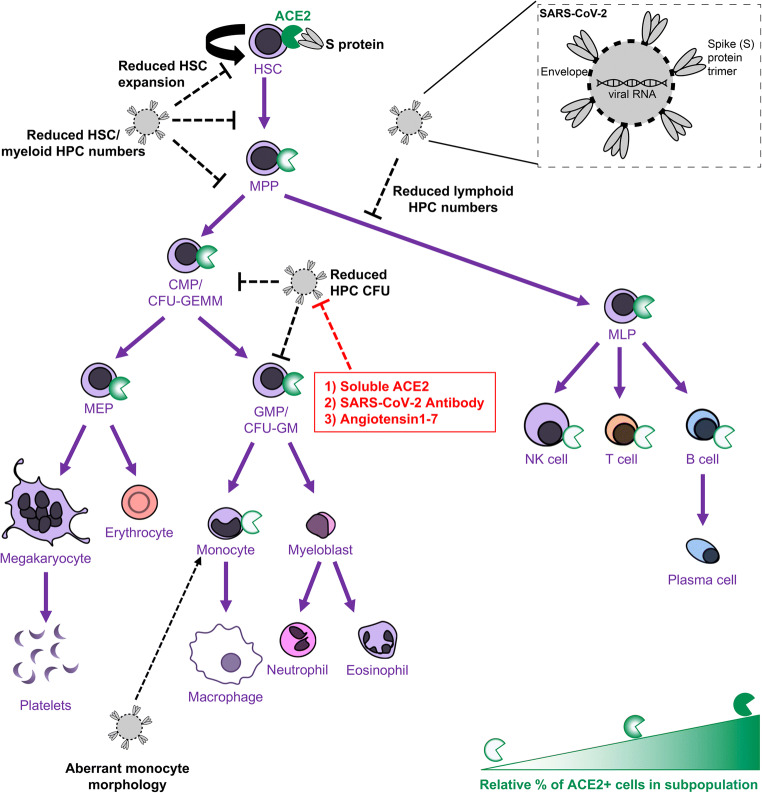
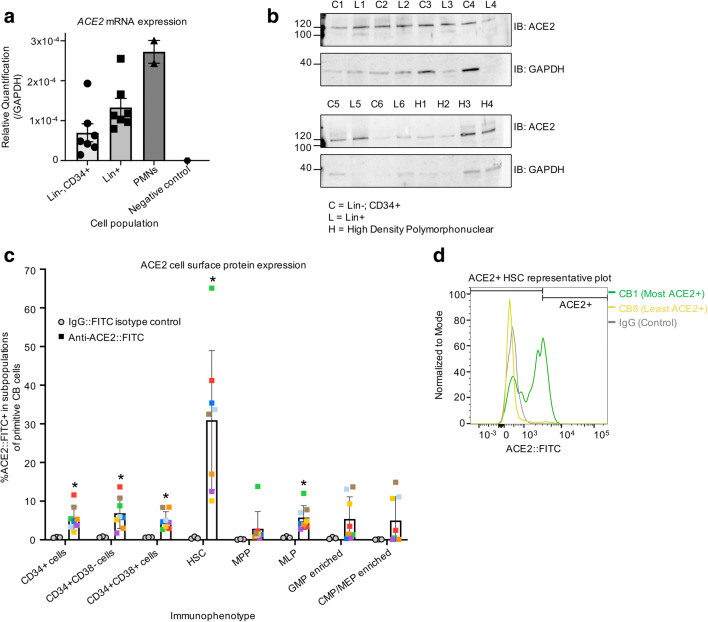
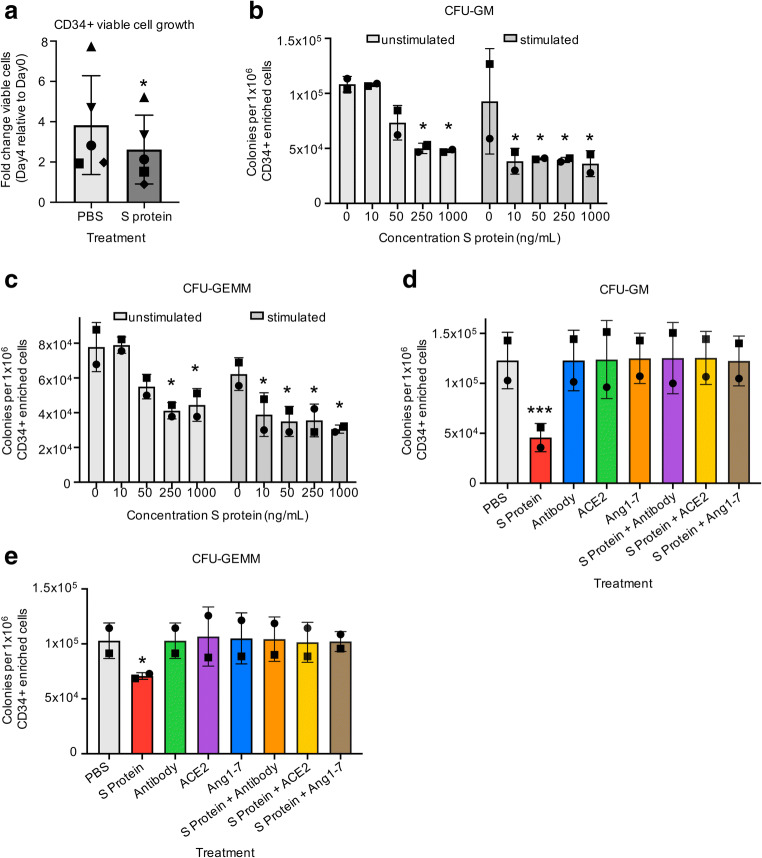
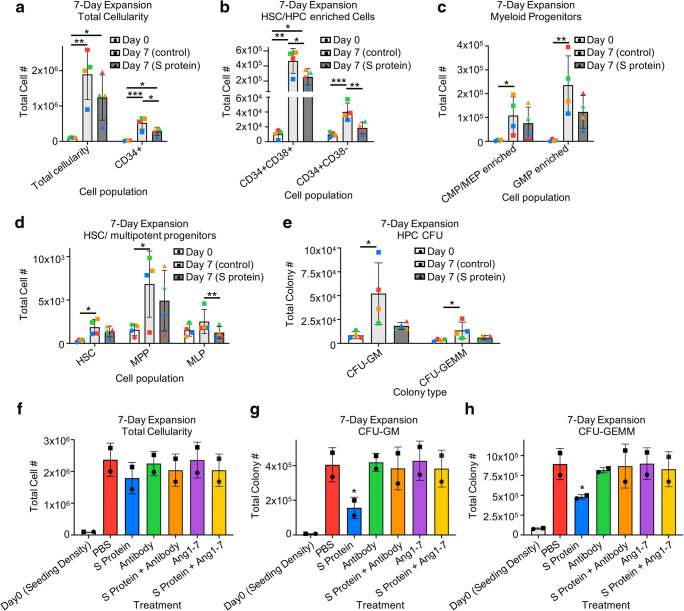
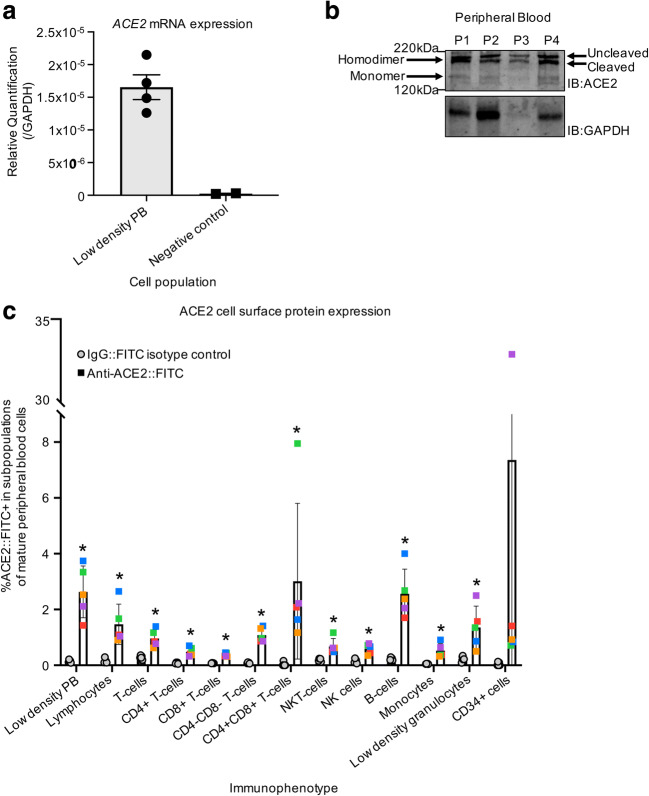
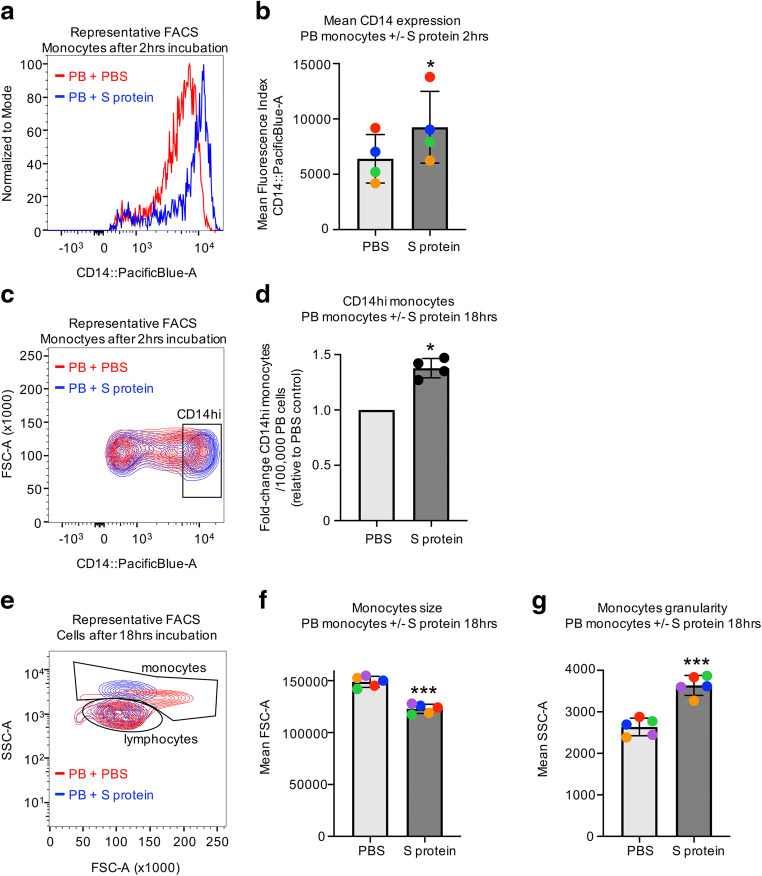
Despite evidence that SARS-CoV-2 infection is systemic in nature, there is little known about the effects that SARS-CoV-2 infection or exposure has on many host cell types, including primitive and mature hematopoietic cells. The hematopoietic system is responsible for giving rise to the very immune cells that defend against viral infection and is a source of hematopoietic stem cells (HSCs) and progenitor cells (HPCs) which are used for hematopoietic cell transplantation (HCT) to treat hematologic disorders, thus there is a strong need to understand how exposure to the virus may affect hematopoietic cell functions. We examined the expression of ACE2, to which SARS-CoV-2 Spike (S) protein binds to facilitate viral entry, in cord blood derived HSCs/HPCs and in peripheral blood derived immune cell subtypes. ACE2 is expressed in low numbers of immune cells, higher numbers of HPCs, and up to 65% of rigorously defined HSCs. We also examined effects of exposing HSCs/HPCs and immune cells to SARS-CoV-2 S protein ex vivo. HSCs and HPCs expand less effectively and have less functional colony forming capacity when grown with S protein, while peripheral blood monocytes upregulate CD14 expression and show distinct changes in size and granularity. That these effects are induced by recombinant S protein alone and not the infectious viral particle suggests that simple exposure to SARS-CoV-2 may impact HSCs/HPCs and immune cells via S protein interactions with the cells, regardless of whether they can be infected. These data have implications for immune response to SARS-CoV-2 and for HCT. Graphical Abstract • Human HSCs, HPCs, and immune cells express ACE2 on the cell surface, making them potentially susceptible to SARS-CoV-2 infection. • SARS-CoV-2 S protein, which binds to ACE2, induces defects in the colony forming capacity of human HPC and inhibits the expansion of HSC/HPC subpopulations ex vivo. These effects can be at least partially neutralized by treatment with SARS-CoV-2 targeting antibody, recombinant human ACE2, or Angiotensin1-7. • S protein also induces aberrant morphological changes in peripheral blood derived monocytes ex vivo. • Thus, there are many different manners in which SARS-CoV-2 virus may impact the functional hematopoietic system, which has important implications for hematological manifestations of COVID-19 (i.e. thrombocytopenia and lymphopenia), immune response, and hematopoietic stem cell transplant in the era of COVID-19.
Keywords: ACE2; COVID-19; Cord blood; Hematopoiesis; Hematopoietic cell expansion; Hematopoietic stem and progenitor cells; Immune cells; SARS-CoV-2; Spike protein.
Figures
Similar articles
-
SARS-CoV-2 Entry Receptor ACE2 Is Expressed on Very Small CD45- Precursors of Hematopoietic and Endothelial Cells and in Response to Virus Spike Protein Activates the Nlrp3 Inflammasome.Stem Cell Rev Rep. 2021 Feb;17(1):266-277. doi: 10.1007/s12015-020-10010-z. Stem Cell Rev Rep. 2021. PMID: 32691370 Free PMC article.
-
Functional and genetic analysis of viral receptor ACE2 orthologs reveals a broad potential host range of SARS-CoV-2.Proc Natl Acad Sci U S A. 2021 Mar 23;118(12):e2025373118. doi: 10.1073/pnas.2025373118. Proc Natl Acad Sci U S A. 2021. PMID: 33658332 Free PMC article.
-
Molecular dynamic simulation analysis of SARS-CoV-2 spike mutations and evaluation of ACE2 from pets and wild animals for infection risk.Comput Biol Chem. 2022 Feb;96:107613. doi: 10.1016/j.compbiolchem.2021.107613. Epub 2021 Dec 1. Comput Biol Chem. 2022. PMID: 34896769 Free PMC article.
-
The glycosylation in SARS-CoV-2 and its receptor ACE2.Signal Transduct Target Ther. 2021 Nov 15;6(1):396. doi: 10.1038/s41392-021-00809-8. Signal Transduct Target Ther. 2021. PMID: 34782609 Free PMC article. Review.
-
COVID-19: angiotensin-converting enzyme 2 (ACE2) expression and tissue susceptibility to SARS-CoV-2 infection.Eur J Clin Microbiol Infect Dis. 2021 May;40(5):905-919. doi: 10.1007/s10096-020-04138-6. Epub 2021 Jan 3. Eur J Clin Microbiol Infect Dis. 2021. PMID: 33389262 Free PMC article. Review.
Cited by
-
Insights into highly engraftable hematopoietic cells from 27-year cryopreserved umbilical cord blood.Cell Rep Med. 2023 Nov 21;4(11):101259. doi: 10.1016/j.xcrm.2023.101259. Epub 2023 Oct 31. Cell Rep Med. 2023. PMID: 37913777 Free PMC article.
-
Stem Cells as a Model of Study of SARS-CoV-2 and COVID-19: A Systematic Review of the Literature.Biomed Res Int. 2021 Aug 25;2021:9915927. doi: 10.1155/2021/9915927. eCollection 2021. Biomed Res Int. 2021. PMID: 34458372 Free PMC article.
-
Interplay between Neutrophils, NETs and T-Cells in SARS-CoV-2 Infection-A Missing Piece of the Puzzle in the COVID-19 Pathogenesis?Cells. 2021 Jul 19;10(7):1817. doi: 10.3390/cells10071817. Cells. 2021. PMID: 34359987 Free PMC article. Review.
-
iPSC-derived human cortical organoids display profound alterations of cellular homeostasis following SARS-CoV-2 infection and Spike protein exposure.FASEB J. 2025 Feb 28;39(4):e70396. doi: 10.1096/fj.202401604RRR. FASEB J. 2025. PMID: 39950320 Free PMC article.
-
The Impacts of COVID-19 on Musculoskeletal Health.Curr Osteoporos Rep. 2022 Aug;20(4):213-225. doi: 10.1007/s11914-022-00734-x. Epub 2022 Jun 20. Curr Osteoporos Rep. 2022. PMID: 35723777 Free PMC article. Review.
References
-
- Chan JF-W, Yuan S, Kok KH, To KKW, Chu H, Yang J, Xing F, Liu J, Yip CCY, Poon RWS, Tsoi HW, Lo SKF, Chan KH, Poon VKM, Chan WM, Ip JD, Cai JP, Cheng VCC, Chen H, Hui CKM, Yuen KY. A familial cluster of pneumonia associated with the 2019 novel coronavirus indicating person-to-person transmission: A study of a family cluster. Lancet. 2020;395(10223):514–523. - PMC - PubMed
-
- Gupta A, Madhavan MV, Sehgal K, Nair N, Mahajan S, Sehrawat TS, Bikdeli B, Ahluwalia N, Ausiello JC, Wan EY, Freedberg DE, Kirtane AJ, Parikh SA, Maurer MS, Nordvig AS, Accili D, Bathon JM, Mohan S, Bauer KA, Leon MB, Krumholz HM, Uriel N, Mehra MR, Elkind MSV, Stone GW, Schwartz A, Ho DD, Bilezikian JP, Landry DW. Extrapulmonary manifestations of COVID-19. Nature Medicine. 2020;26(7):1017–1032. - PMC - PubMed
-
- Mallapaty S. Mini organs reveal how the coronavirus ravages the body. Nature. 2020;583(7814):15–16. - PubMed
Publication types
MeSH terms
Substances
Grants and funding
LinkOut - more resources
Full Text Sources
Medical
Research Materials
Miscellaneous
