. 2021 Jul;31(4):e12914.
doi: 10.1111/bpa.12914. Epub 2020 Dec 29.

Contribution of the astrocytic tau pathology to synapse loss in progressive supranuclear palsy and corticobasal degeneration

Affiliations

Contribution of the astrocytic tau pathology to synapse loss in progressive supranuclear palsy and corticobasal degeneration

Nils Briel et al. Brain Pathol. 2021 Jul.

Abstract

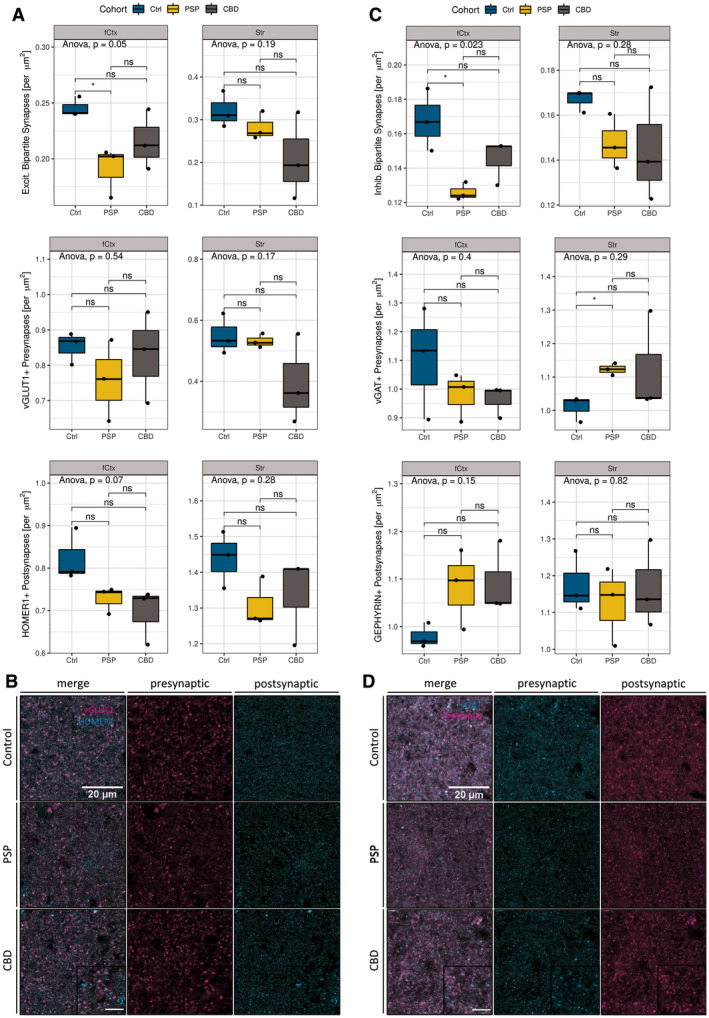
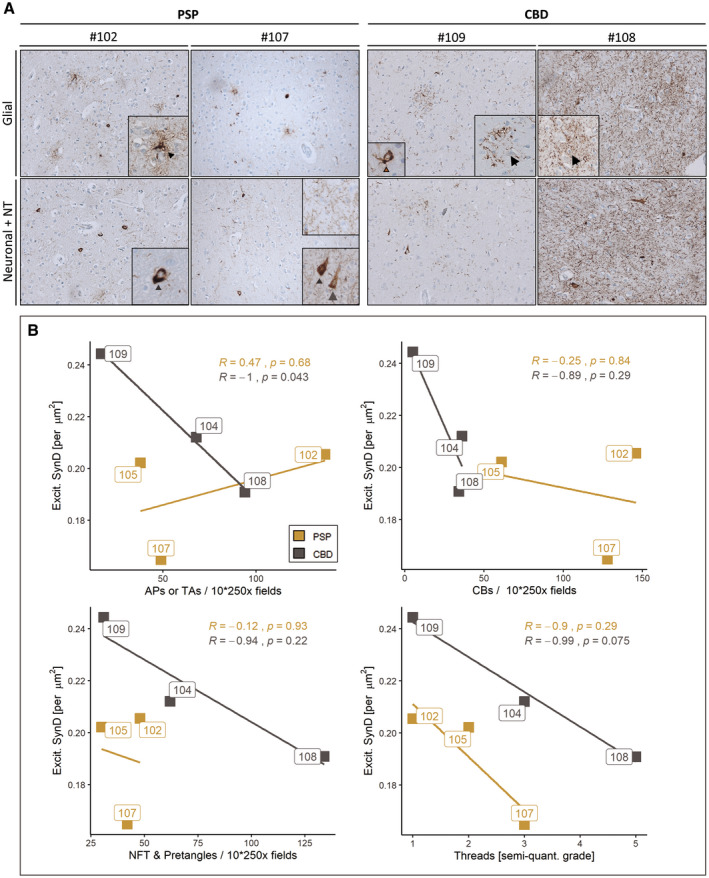
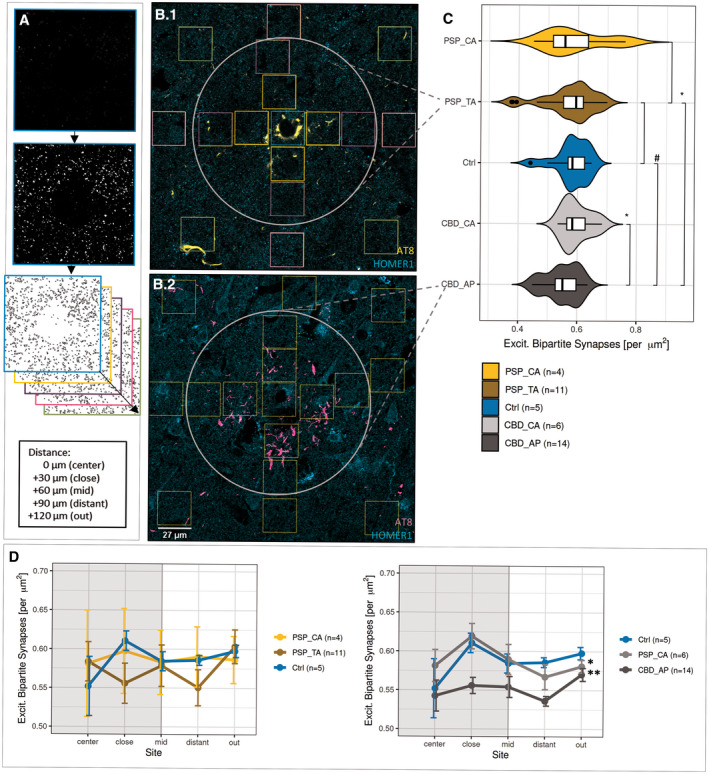
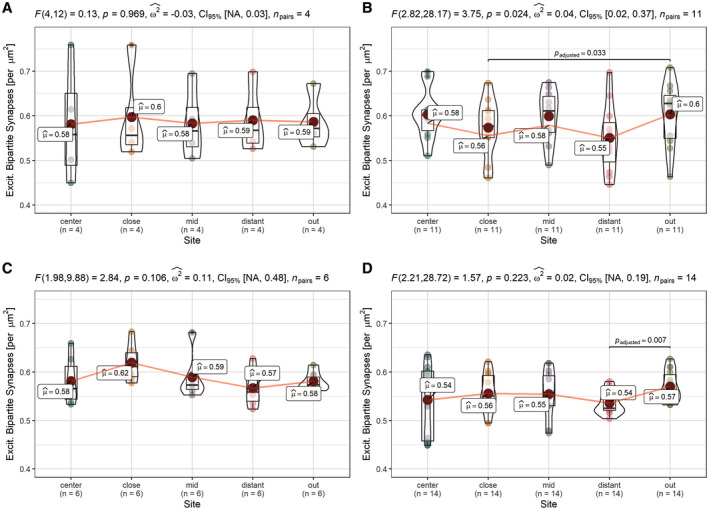
Primary 4-repeat tauopathies with frontotemporal lobar degeneration (FTLD) like Progressive Supranuclear Palsy (PSP) or Corticobasal Degeneration (CBD) show diverse cellular pathology in various brain regions. Besides shared characteristics of neuronal and oligodendroglial cytoplasmic inclusions of accumulated hyperphosphorylated tau protein (pTau), astrocytes in PSP and CBD contain pathognomonic pTau aggregates - hence, lending the designation tufted astrocytes (TA) or astrocytic plaques (AP), respectively. pTau toxicity is most commonly assigned to neurons, whereas the implications of astrocytic pTau for maintaining neurotransmission within the tripartite synapse of human brains is not well understood. We performed immunofluorescent synapse labeling and automated puncta quantification in the medial frontal gyrus (MFG) and striatal regions from PSP and CBD postmortem samples to capture morphometric synaptic alterations. This approach indicated general synaptic losses of both, excitatory and inhibitory bipartite synapses in the frontal cortex of PSP cases, whereas in CBD lower synapse densities were only related to astrocytic plaques. In contrast to tufted astrocytes in PSP, affected astrocytes in CBD could not preserve synaptic integrity within their spatial domains, when compared to non-affected internal astrocytes or astrocytes in healthy controls. These findings suggest a pTau pathology-associated role of astrocytes in maintaining connections within neuronal circuits, considered as the microscopic substrate of cognitive dysfunction in CBD. By contrasting astrocytic-synaptic associations in both diseases, we hereby highlight astrocytic pTau as an important subject of prospective research and as a potential cellular target for therapeutic approaches in the primary tauopathies PSP and CBD.

Keywords: astrocytic plaques; corticobasal degeneration; progressive supranuclear palsy; synapse loss; tauopathy; tufted astrocytes.


Conflict of interest statement

The authors declare that they have no competing interests.

Figures

FIGURE 1
FIGURE 1
Bipartite synapse quantifications. (a) Statistical analysis of excitatory synapses (# synapses per µm2) facetted by region (left column: fCtx, right column: Str) and markers (vGLUT1, HOMER1). Significant reductions of bipartite excitatory synapses in PSP‐fCtx and trending isolated postsynaptic loss in PSP‐ and CBD‐fCtx. Boxplots show synapse densities for colocalized pre‐ and postsynaptic positive (+) signal (1st row), presynapses only (2nd row), and postsynapses (3rd row) in the fCtx and Str. The color code indicates disease entity. Black dots depict values of single cases. The upper and lower hinges of each box correspond to the 75th and 25th percentiles, while median values are represented by a black bar. Whiskers display the range of data within 1.5 of the inter‐quartile range. Significance statements are depicted according to the analysis of variance (ANOVA) with Tukey post hoc correction (entire groups) or t‐test (pair‐wise group comparisons). Results are expressed as decimal (ANOVA) or indicated as *p < 0.05 and ns = “not significant” (t‐test). (b) Confocal ex vivo images of the merged pre‐ and postsynaptic markers for excitatory synapses (vGLUT1 and HOMER1, left), presynaptic (middle column), and postsynaptic (right) in the fCtx of controls (1st row), PSP (2nd row), and CBD (3rd row) subjects. Scale bars: 20 µm (main), 10 µm (inset). (c) Statistical analysis of inhibitory synapses (# synapses per µm2) facetted by region (left column: fCtx, right: Str) and markers (vGAT, GEPHYRIN). Significant reductions of inhibitory synapse density in the fCtx and significant increases of inhibitory presynapses in the Str of PSP patients. Depiction and statistical assessment according to (a). (d) Confocal ex vivo images of the merged pre‐ and postsynaptic markers for inhibitory synapses (vGAT and GEPHYRIN, left), presynaptic (middle column), and postsynaptic (right) in the fCtx of controls, PSP and CBD subjects. Scale bars according to (c). fCtx, cortex of the MFG; Str, striatum
FIGURE 2
FIGURE 2
Synapse densities correlate with the occurrence of APs but not TAs in the frontal cortex. (a) Diverse AT8 inclusion pathology in fCtx of investigated PSP and CBD cases visualized by immunohistochemistry using the AT8 antibody. Representative light microscopy images depicting the extent of AT8+ cell type‐assigned neuropathology in those two PSP cases (left panel) and those two CBD cases (right panel) with the highest synapse counts (left column of each panel) and lowest synapse counts (right column of each panel). Insets depict particular AT8 traits of affected brain cell types. The upper row shows glial pathology with TA (arrowhead), APs (arrow), and a CB (brown arrow); the lower row depicts neuronal pathology including pretangles (grey arrowhead), NFTs (grey arrow), together with NT of varying degrees. (b) In the fCtx the density of synapses correlates with neuropathological traits present in CBD (APs, trending with NT/threads), but not with the assessed traits seen in PSP (TAs, NFT, CB, NT/threads). Correlation scatter plots for excitatory synapse density (“Excit. SynD,” synapses per µm2 area) in the fCtx facetted by each of the assessed neuropathological traits: TAs and APs (upper left), CBs (upper right), NFTs and pretangles (lower left) as well as NTs (lower right). Color code indicates disease entity. Boxed labels show single case identifiers. Statistical results are expressed as Pearson’s R and respective decimal p values (see also Table 2). AP, astrocytic plaque; TA, tufted astrocyte
FIGURE 3
FIGURE 3
Synapse loss is associated with the territory of APs. (a) Workflow for evaluating astrocytic domain‐associated synapse densities. Bins/ROIs (colored boxes in b) are placed at Sholl‐like, concentric circles surrounding the astrocyte’s core, while somatic targets of the HOMER1 antibody are excluded. Once extracted from the raw image, all bins belonging to one of the five distance representations from “center” to “out” were individually processed and subjected to puncta detection. Merged values of bins belonging to the same distance representation were positioned accordingly and the resulting sequence defined as “synapse distribution.” (b) Exemplifying the image source for the analysis of domain‐associated synapse density AT8 and HOMER1 in TAs in PSP (b.1) and APs in CBD cortices (b.2), where squares delineate bins to extract synapses from. The white circle delimits the astrocytic domain by a priori knowledge. Assignments were given as follows: “center” = light blue, “close” = orange, “mid” = purple, “distant” = pink, “out” = light green. (c) Reduced synapse density in the territory of APs. Combined box‐violin plots depicting the synapse densities of only those bins, which were located within the ascribed astrocytic domain (white circle in b). Comparisons between TAs (golden yellow) / APs (dark grey) and internal AT8‐ control astrocytes (yellow, light grey) of the same condition or external AT8‐ controls (blue) of non‐diseased control subjects. Boxplot description follows Figure 1a. T‐test assuming normal distribution, where #: p < 0.075, *p < 0.05 and ns: “not significant”. (d) Inherent differences among synapse density distributions within the domains of APs. Means of synapse densities are plotted against area representation assignment for TA and CA in PSP, AP, and CA in CBD and astrocytes in corresponding control cases (left: PSP, right: CBD). The extent of the presumed astrocytic domain is delimited as grey, boxed background. Results are expressed as ±SEM, *p < 0.05, **p < 0.01, two‐way‐ANOVA with Leven’s testing for normality and Games‐Howell post hoc test. CA, control astrocytes
FIGURE 4
FIGURE 4
Altered synapse density distributions in domains of APs and TAs. Distribution analysis of single astrocyte cohorts shows unchanged distributions in domains of internal control astrocytes (PSP_CA/CBD_CA donors, AT8‐) and significant differences in the overall distribution in CBD_APs, respective significant between‐bin‐differences to the outermost part around PSP_TAs and CBD_APs approximating a normal synapse density. (a–d) Pair‐wise comparisons of synaptic density among predefined sites within cohorts of astrocyte classes in the fCtx of PSP and CBD subjects. PSP_CA (a), PSP_TA (b), CBD_CA (c), and CBD_AP (d). Graphs show combined box‐violin plots. Small colored dots represent values of single domains at this site, while larger colored dots depict the calculated mean (mean values indicated as boxed labels). Boxed labels provide information on the mean (µ). Assuming a normal distribution, Fisher’s repeated measures one‐way ANOVA was used to estimate F‐values, p values, to determine the effect size (ω 2) and range of the confidence interval (CI95%) given a certain samples size (n), as indicated in the caption of each frame. T‐testing with Holm–Sidak adjustment was applied for pairwise comparison. Adjusted p values of between‐bin‐comparisons are specified as decimals within each of the graphs

Similar articles

Cited by

References

    1. Ahmed Z, Cooper J, Murray TK, Garn K, McNaughton E, Clarke H, et al. A novel in vivo model of tau propagation with rapid and progressive neurofibrillary tangle pathology: the pattern of spread is determined by connectivity, not proximity. Acta Neuropathol. 2014;127:667–83. - PMC - PubMed
    1. Berger Z, Roder H, Hanna A, Carlson A, Rangachari V, Yue M, et al. Accumulation of pathological tau species and memory loss in a conditional model of tauopathy. J Neurosci. 2007;27:3650–62. - PMC - PubMed
    1. Bernardinelli Y, Randall J, Janett E, Nikonenko I, König S, Jones EV, et al. Activity‐dependent structural plasticity of perisynaptic astrocytic domains promotes excitatory synapse stability. Curr Biol. 2014;24:1679–88. - PubMed
    1. Bigio EH, Brown DF, White CL. Progressive supranuclear palsy with dementia: cortical pathology. J Neuropathol Exp Neurol. 1999;58:359–64. - PubMed
    1. Bigio EH, Vono MB, Satumtira S, Adamson J, Sontag E, Hynan LS, et al. Cortical synapse loss in progressive supranuclear palsy. J Neuropathol Exp Neurol. 2001;60:403–10. - PubMed

Publication types