. 2021 May;21(4):1008-1020.
doi: 10.1111/1755-0998.13284. Epub 2020 Nov 20.

Reference genome and demographic history of the most endangered marine mammal, the vaquita

Affiliations

Reference genome and demographic history of the most endangered marine mammal, the vaquita

Phillip A Morin et al. Mol Ecol Resour. 2021 May.

Abstract

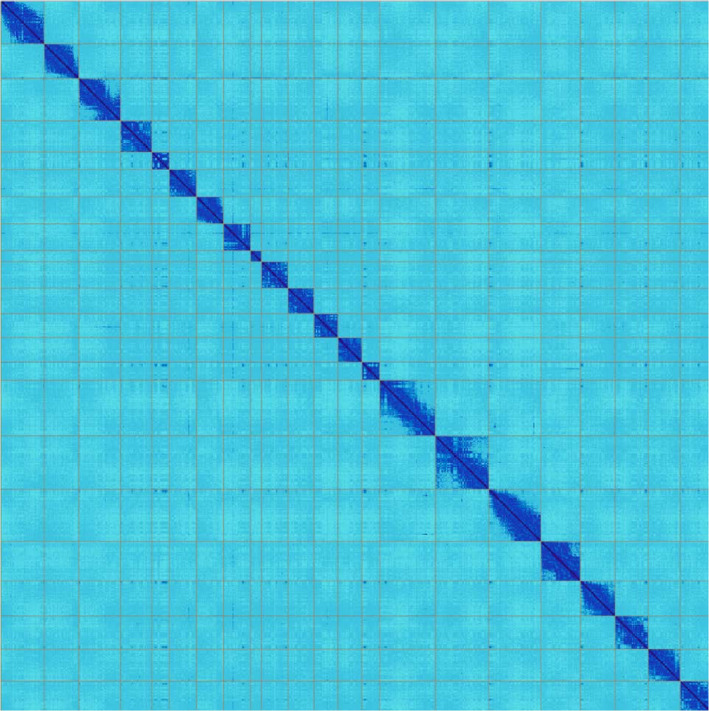
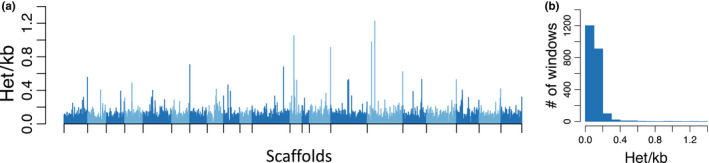
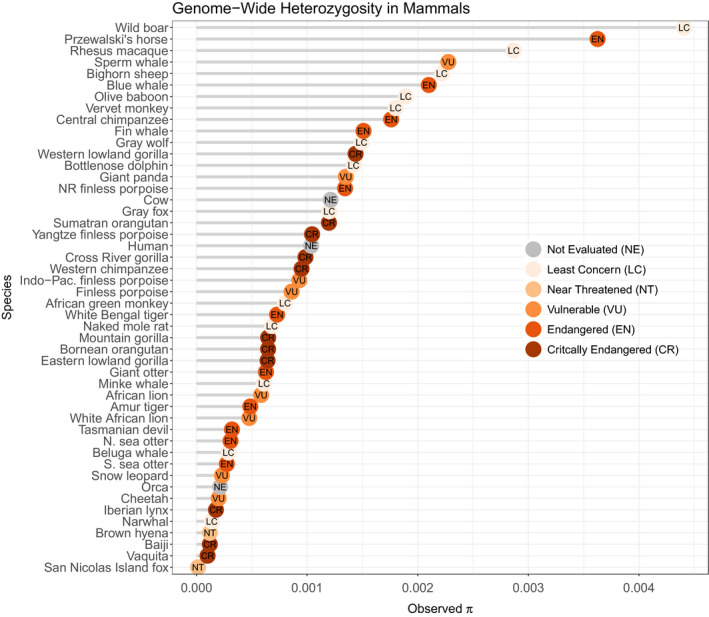
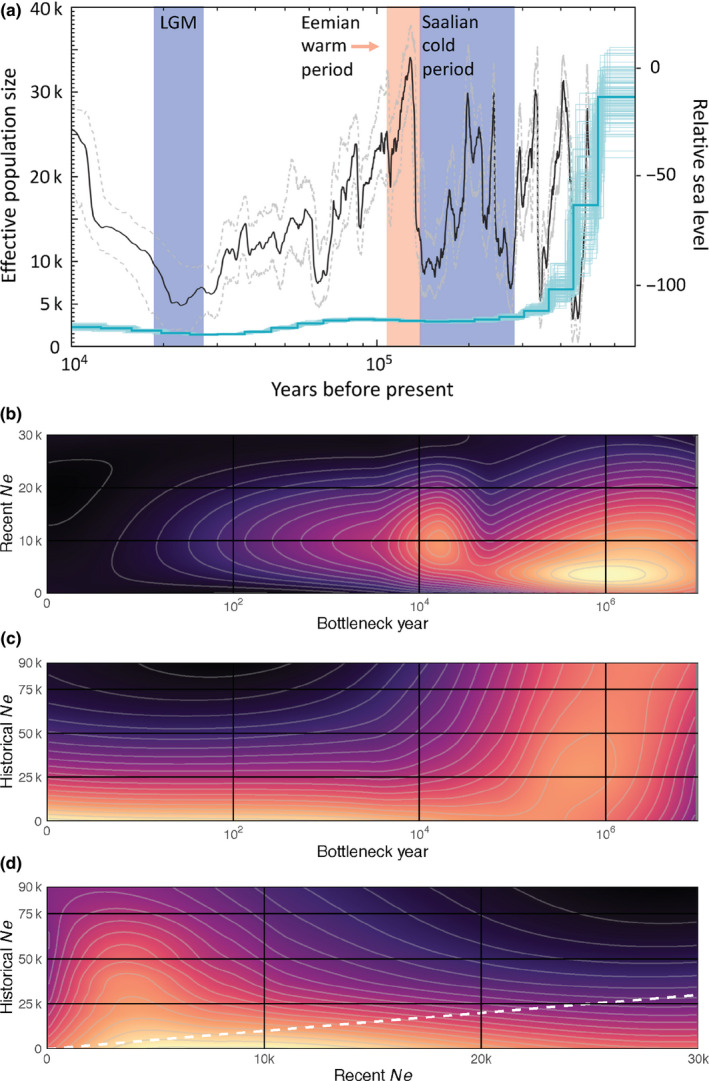
The vaquita is the most critically endangered marine mammal, with fewer than 19 remaining in the wild. First described in 1958, the vaquita has been in rapid decline for more than 20 years resulting from inadvertent deaths due to the increasing use of large-mesh gillnets. To understand the evolutionary and demographic history of the vaquita, we used combined long-read sequencing and long-range scaffolding methods with long- and short-read RNA sequencing to generate a near error-free annotated reference genome assembly from cell lines derived from a female individual. The genome assembly consists of 99.92% of the assembled sequence contained in 21 nearly gapless chromosome-length autosome scaffolds and the X-chromosome scaffold, with a scaffold N50 of 115 Mb. Genome-wide heterozygosity is the lowest (0.01%) of any mammalian species analysed to date, but heterozygosity is evenly distributed across the chromosomes, consistent with long-term small population size at genetic equilibrium, rather than low diversity resulting from a recent population bottleneck or inbreeding. Historical demography of the vaquita indicates long-term population stability at less than 5,000 (Ne) for over 200,000 years. Together, these analyses indicate that the vaquita genome has had ample opportunity to purge highly deleterious alleles and potentially maintain diversity necessary for population health.

Keywords: Conservation genomics; Phocoena sinus; Vertebrate Genomes Project; genome diversity; historical demography; porpoise.


Figures

FIGURE 1
FIGURE 1
HiC heat‐map of genomic interactions. Interactions between two locations are depicted by a dark blue pixel. Grey lines depict scaffold boundaries for the 22 chromosome‐length scaffolds. Different scaffolds should not share any interactions (pixels off diagonal outside the scaffold boundaries), while patterns within a scaffold show chromosome‐substructure
FIGURE 2
FIGURE 2
Distributions of heterozygosity across the vaquita genome. (a) Bar plot shows per‐site heterozygosity in nonoverlapping 1‐Mb windows across 21 autosomal scaffolds >10 Mb in length. Scaffolds are shown in alternating shades. Note that some of the highes peaks of heterozygosity are at the chromosme (scaffold) ends. (b) Histogram of the count of per‐window heterozygosity levels
FIGURE 3
FIGURE 3
Comparison of genome‐wide heterozygosity (π) among mammals. Values are drawn from the literature, based on Robinson et al. (2016), plus the vaquita and blue whale. Dots are coloured by the endangered status according to the Red List for Threatened Species, International Union for Conservation of Nature (IUCN). Although the Baiji, or Yangtze River dolphin, is listed as critically endangered, it is believed to have been extinct since at least 2006 (Turvey et al., 2007). See Table S4 for heterozygosity information
FIGURE 4
FIGURE 4
Changes in vaquita population size over time. (a) Changes in effective population size (Ne, blue, left axis) of the vaquita over time inferred from PSMC analysis of the nuclear genome. The darker blue line represents the median and lighter lines represent the 100 bootstrap replicates. The black line shows relative sea level (right axis, compared to present) with 95% confidence intervals (grey dashed lines) from Grant et al. (2014), and shading corresponds to cold and warm periods. (b–d) Heatmap of the distribution of the negative log‐likelihood (‐logL) of the empirical heterozygosity distribution across pairs of demographic parameters from the coalescent model, with higher likelihood combinations shown by lighter colour. The dashed white line in (d) represents a 1:1 slope, where current and historical population sizes would have been equal before and after the modelled change in population size
FIGURE 5
FIGURE 5
Bathymetric map of the Gulf of California showing 500 m isobath lines. Transition to yellow is at –140 m, indicating portions of the Gulf that were likely above sea level during the last two glacial maxima, ~22,000 and 140,000 years ago. The area north of the red line is the approximate historical range of the vaquita (Brownell, 1986)

Similar articles

Cited by

References

    1. Alonge, M. , Soyk, S. , Ramakrishnan, S. , Wang, X. , Goodwin, S. , Sedlazeck, F. J. , Lippman, Z. B. , & Schatz, M. C. (2019). RaGOO: Fast and accurate reference‐guided scaffolding of draft genomes. Genome Biology, 20(1), 224. 10.1186/s13059-019-1829-6 - DOI - PMC - PubMed
    1. Armstrong, E. E. , Taylor, R. W. , Prost, S. , Blinston, P. , van der Meer, E. , Madzikanda, H. , Mufute, O. , Mandisodza‐Chikerema, R. , Stuelpnagel, J. , Sillero‐Zubiri, C. , & Petrov, D. (2019). Cost‐effective assembly of the African wild dog (Lycaon pictus) genome using linked reads. Gigascience, 8(2), 10.1093/gigascience/giy124 - DOI - PMC - PubMed
    1. Arnason, U. , Lammers, F. , Kumar, V. , Nilsson, M. A. , & Janke, A. (2018). Whole‐genome sequencing of the blue whale and other rorquals finds signatures for introgressive gene flow. Science . Advances, 4(4), eaap9873. 10.1126/sciadv.aap9873 - DOI - PMC - PubMed
    1. Autenrieth, M. , Hartmann, S. , Lah, L. , Roos, A. , Dennis, A. B. , & Tiedemann, R. (2018). High‐quality whole‐genome sequence of an abundant Holarctic odontocete, the harbour porpoise (Phocoena phocoena). Molecular Ecology Resources, 18(6), 1469–1481. 10.1111/1755-0998.12932 - DOI - PubMed
    1. Beichman, A. C. , Phung, T. N. , & Lohmueller, K. E. (2017). Comparison of single genome and allele frequency data reveals discordant demographic histories. G3, 7(11), 3605–3620. 10.1534/g3.117.300259 - DOI - PMC - PubMed

LinkOut - more resources