. 2020 Oct 14;19(11):e13246.
doi: 10.1111/acel.13246. Online ahead of print.

Parallels between retinal and brain pathology and response to immunotherapy in old, late-stage Alzheimer's disease mouse models

Affiliations

Parallels between retinal and brain pathology and response to immunotherapy in old, late-stage Alzheimer's disease mouse models

Jonah Doustar et al. Aging Cell. .

Abstract

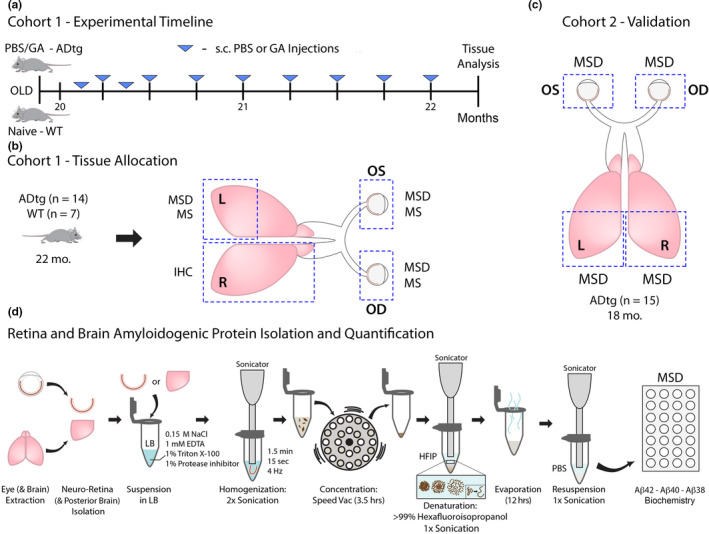
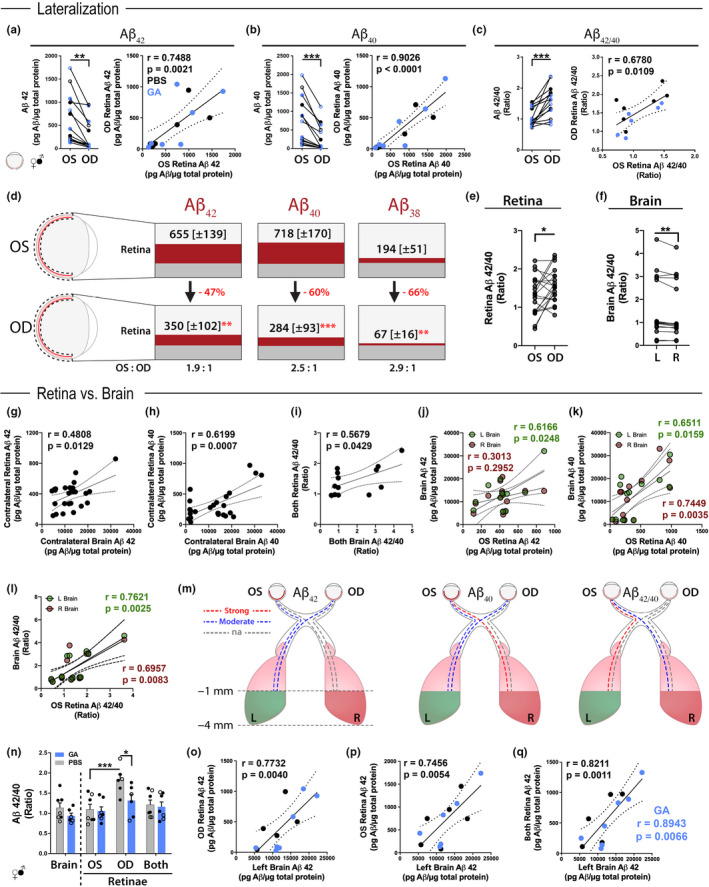
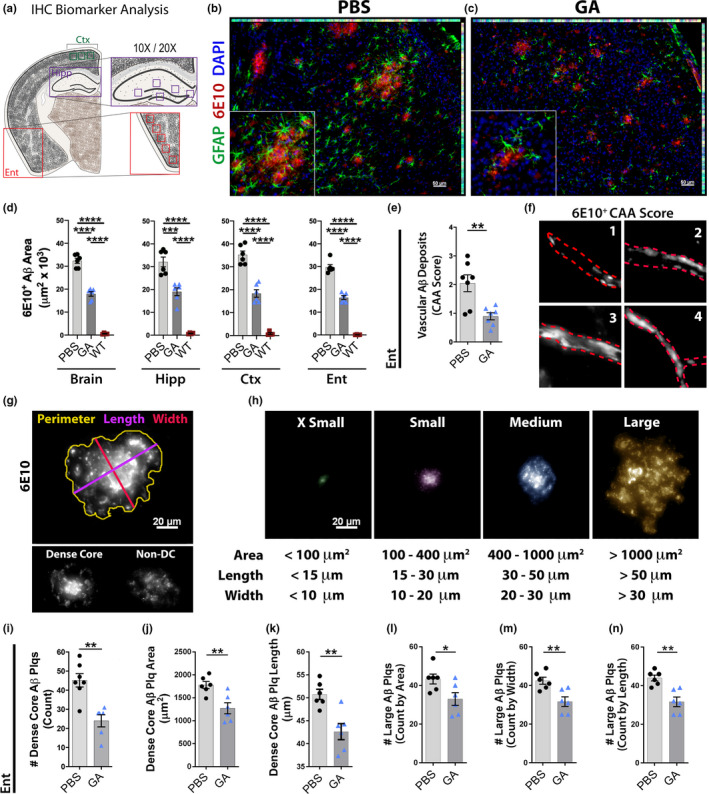
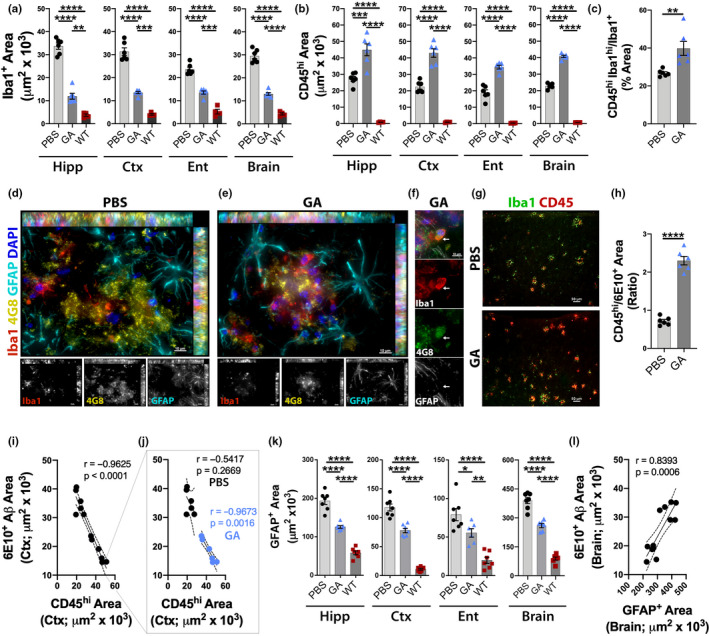
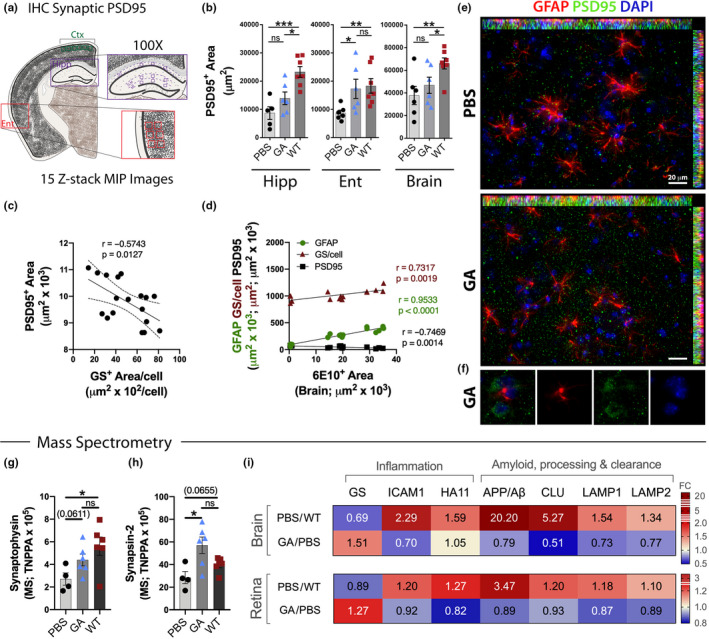
Despite growing evidence for the characteristic signs of Alzheimer's disease (AD) in the neurosensory retina, our understanding of retina-brain relationships, especially at advanced disease stages and in response to therapy, is lacking. In transgenic models of AD (APPSWE/PS1∆E9; ADtg mice), glatiramer acetate (GA) immunomodulation alleviates disease progression in pre- and early-symptomatic disease stages. Here, we explored the link between retinal and cerebral AD-related biomarkers, including response to GA immunization, in cohorts of old, late-stage ADtg mice. This aged model is considered more clinically relevant to the age-dependent disease. Levels of synaptotoxic amyloid β-protein (Aβ)1-42, angiopathic Aβ1-40, non-amyloidogenic Aβ1-38, and Aβ42/Aβ40 ratios tightly correlated between paired retinas derived from oculus sinister (OS) and oculus dexter (OD) eyes, and between left and right posterior brain hemispheres. We identified lateralization of Aβ burden, with one-side dominance within paired retinal and brain tissues. Importantly, OS and OD retinal Aβ levels correlated with their cerebral counterparts, with stronger contralateral correlations and following GA immunization. Moreover, immunomodulation in old ADtg mice brought about reductions in cerebral vascular and parenchymal Aβ deposits, especially of large, dense-core plaques, and alleviation of microgliosis and astrocytosis. Immunization further enhanced cerebral recruitment of peripheral myeloid cells and synaptic preservation. Mass spectrometry analysis identified new parallels in retino-cerebral AD-related pathology and response to GA immunization, including restoration of homeostatic glutamine synthetase expression. Overall, our results illustrate the viability of immunomodulation-guided CNS repair in old AD model mice, while shedding light onto similar retino-cerebral responses to intervention, providing incentives to explore retinal AD biomarkers.

Keywords: astrocytes reactivation; glutamine synthetase; myeloid cells; neurodegenerative disease; ocular proteins; retina; synaptic preservation; vascular amyloidosis.


Conflict of interest statement

Y.K., M.K.H., and K.L.B. are co‐founders and stockholders of NeuroVision Imaging, Inc., 1395 Garden Highway, Suite 250, Sacramento, CA 95833, USA.

Figures

Figure 1
Figure 1
Experimental design and intervention timeline assessing cerebral and retinal tissues in old, late‐stage ADtg mice. (a) Experimental timeline for mouse Cohort 1: 20‐month‐old APPSWE/PS1ΔE9 (ADtg) mice underwent weekly, subcutaneous injections of glatiramer acetate (GA, also known as Copaxone®; 100 µg) for a 2‐month duration (n = 7 mice). Age‐ and sex‐matched ADtg mice were subcutaneously injected with PBS in the same regimen and naïve non‐transgenic (WT) littermates were used as controls (n = 7 mice per group). (b) One week following the last injection, mice were sacrificed, and tissues were collected as described. Paired brains and eyeballs from Cohort 1 were allocated for further analyses: the right (R) cerebral hemisphere was used for immunohistochemistry (IHC), the left (L) posterior brain was used for quantitative biochemical Meso Scale Discovery (MSD) and Mass Spectrometry (MS) assays, and both oculus sinister (OS, left) and oculus dexter (OD, right) eyeballs were collected, the neurosensory retinae isolated, and proteins assessed by MSD and MS analyses. OS and OD retinae were separately analyzed by MSD and pooled together for MS analysis. (c) Cohort 2 was comprised of old ADtg mice (n = 15 mice; average age of 18 months). L and R posterior brains as well as OS and OD eyeballs were collected and analyzed separately for Aβ proteins by MSD. (d) Preparation of mouse neuro‐retina and posterior brain Aβ proteins for quantification by MSD. Each tissue was prepared separately for analysis (OS retina, OD retina, and left and right posterior brains). The protocol involves suspension in lysis buffer (LB), homogenization via sonication, concentration with speed vac, and protein denaturation with hexafluoroisopropanol (HFIP) followed by evaporation and resuspension in PBS prior to protein concentration analysis
Figure 2
Figure 2
Retinal and cerebral Aβ alloforms in old ADtg mice and following immunotherapy. (a–c) Analysis of Aβ1–42, Aβ1–40, and Aβ42/40 ratio levels (n = 7 mice per group) in OS versus OD retinae from Cohort 1 of GA‐immunized (blue) and PBS‐control (black) old ADtg mice. Data indicate Aβ concentrations for individual mouse in OS versus OD retina analyzed by paired Student's t test. Pearson's r correlations between levels of each Aβ1–42, Aβ1–40, and Aβ42/40 ratio in OS and OD retinae are also shown (n = 13–14 mice; right graphs). (d) Schematic display of Aβ1–42, Aβ1–40, and Aβ1–38 alloform concentrations (Average; ± SEM in brackets) in each retina from Cohort 1. Data presented in pg Aβ per µg total protein. Lower percentages of amyloid levels in OD versus OS retinae are shown in red, and OS to OD ratios of Aβ concentrations are indicated below. (e–f) Aβ42/40 ratios as assessed by MSD analysis in paired OS versus OD retinae from ADtg mice (e; Cohorts 1 and 2 without GA group; n = 20 mice) and in paired L versus R brains from Cohort 2 ADtg mice (f; n = 15 mice). Lateralization was determined by paired Student's t test. (g–m) Pearson's r correlations between retinal and cerebral Aβ burden in ADtg mice from Cohort 2. (g–h) Contralateral correlations between OS retina versus R brain and OD retina versus L brain for (g) Aβ42 and (h) Aβ40 levels (n = 12–14). (i) Correlation between average retinal and average cerebral Aβ42/40 ratios. (j–l) Unilateral correlations of OS retina versus L brain (green) or versus R brain (red) for (j) Aβ42, (k) Aβ40, and (l) Aβ42/40 ratio (n = 13). (m) Schematic illustration portraying strength of associations between each retina and each posterior brain for Aβ42, Aβ40, and Aβ42/40 ratio in old ADtg mice. The analyzed posterior brain includes tissue between −1 and −4 mm bregma. Strong associations in red (r > 0.7), moderate associations in blue (r = 0.5–0.7), and weak or no associations (na) in gray (r = 0.0–0.5). (n–q) Analysis of retinal versus cerebral Aβ levels in Cohort 1 old ADtg mice following GA immunization. (n) Brain and retinal Aβ42/40 ratios in PBS‐control versus GA‐immunized ADtg mice (n = 7 mice per group). (o–q) Pearson's r correlations between levels of Aβ42 in L brain and (o) OD retina, (p) OS retina, and (q) an average of both retinae (n = 14 mice). Strong correlations in Aβ1–42 burden between brain and retinal tissues are especially apparent following GA immunization (q). Graphs display individual data point for each mouse, with bar graphs also indicating group mean and standard error of mean (SEM) values. Mouse sex is designated as filled circles for males and open circles for females (gender not shown in correlation graphs). *p < 0.05, **p < 0.01, ***p < 0.001 assessed by paired Student's t test for two‐group comparisons, and a two‐way ANOVA with Sidak's post‐test for group analysis for brain and retinal tissues
Figure 3
Figure 3
Decreased cerebral Aβ ‐plaque pathology and vascular amyloidosis in old ADtg mice following GA immunotherapy. (a) Cerebral map indicating specific brain regions analyzed by IHC; regions include the cingulate cortex/retrosplenial area (Ctx), hippocampus (Hipp), and entorhinal cortex/piriform area (Ent). (b–c) Representative coronal sections of a cortical region stained for astrocytes (GFAP, green), Aβ plaques (6E10, red), and cell nuclei (DAPI; blue) in (b) PBS‐control and (c) GA‐treated ADtg mice. (d) Quantitative IHC analysis of 6E10+ Aβ‐plaque area in total brain, Hipp, Ctx, and Ent of all experimental groups (n = 6 mice per group). (e) Analysis of cerebral amyloid angiopathy (CAA) scores in the Ent of GA‐immunized versus untreated (PBS) old ADtg mice (n = 7 mice per group). (f) Representative images illustrating the scoring method used to assess vascular 6E10+ Aβ deposits [termed as cerebral amyloid angiopathy (CAA) scores], with scale ranges from 0 to 4, with higher scores for greater vascular Aβ pathology. (g) Representative images and measurements of perimeter, length (largest diameter), and width (smallest diameter) acquired per Aβ plaque (top); Dense‐core and non‐dense‐core/diffuse plaque subtypes are demonstrated (bottom). (h) Microscopic images showing classification of plaque by size, as defined by area, length and width. Accordingly, plaques were categorized into four subgroups: x‐small, small, medium, and large. (i–k) Quantitative analysis of dense‐core plaque phenotype within the Ent of GA‐immunized versus PBS‐control ADtg mice, including (i) total count, (j) average area, and (k) length. (l–n) Quantitative analysis of large Aβ‐plaque count, as determined by (l) area, (m) width, and (n) length, within the Ent of GA‐immunized versus PBS‐control ADtg mice (n = 6–7 mice per group). Bar graphs indicate mean, standard error of mean (SEM), and individual data points. *p < 0.05, **p < 0.01, ***p < 0.001, ****p < 0.0001 assessed by unpaired Student's t test for two‐group comparisons, and a one‐way ANOVA with Tukey's post‐test for three or more groups
Figure 4
Figure 4
Reduced cerebral microgliosis and astrogliosis along with peripheral monocyte recruitment following immunomodulation. (a) Quantitative IHC analysis of Iba1+ microgliosis within predetermined brain regions: Hipp, Ctx, and Ent, as well as their average (Brain) in GA‐immunized versus PBS‐control ADtg mice, and in naïve WT mouse littermates. (b) Quantitative IHC analysis of Iba1+CD45hi infiltrating peripheral immune cells in brain regions and their average (Brain) (n = 6 mice per group). (c) Analysis of percent area of Iba1hi/CD45hi peripheral monocytes population of Iba1+ myeloid cell area within PBS‐control and GA‐immunized groups (n = 6 mice per group). (d–e) Representative micrographs of inflammatory cells, GFAP+ astrocytes (cyan) and Iba1+ myelomonocytes (red), surrounding 4G8+ Aβ plaques (yellow) in the Ent cortex of old, late‐stage (d) PBS‐control and (e) GA‐immunized ADtg mice. (f) A representative high‐magnification micrograph of Ent cortex of GA‐immunized ADtg mice with an Iba1+ myelomonocytic cell (red) seen engulfing 4G8+ Aβ; white arrow tags location between channels. (g) Representative micrographs of Iba1+ myelomonocytes and CD45+ hematopoietic immune cells within PBS‐control and GA‐immunized mice. (h) IHC analysis of CD45hi area/6E10+ area ratio (n = 6 mice/group). (i) Pearson's r correlation analysis between CD45hi hematopoietic cells and 6E10+ Aβ‐plaque deposits in Ctx sections including PBS‐control and GA‐immunized mice (n = 12 mice). (j) Separate Pearson's r correlations between CD45hi hematopoietic cells and 6E10+ Aβ‐plaque deposits in old PBS‐control and GA‐immunized ADtg mice demonstrating retention of correlation with treatment. (k) Quantitative IHC analysis of GFAP+ astrogliosis in total brain regions for all experimental groups (n = 6–7 mice per group). (l) Pearson's r correlation analyses between GFAP+ astrogliosis and 6E10+ Aβ for total brain plaque area in PBS‐control and GA‐immunized ADtg mice (n = 12 mice). Bar graphs indicate mean, standard error of mean (SEM), and individual data points. *p < 0.05, **p < 0.01, ***p < 0.001, ****p < 0.0001 assessed by unpaired Student's t test for two‐group comparisons, and a one‐way ANOVA with Tukey's post‐test for three or more groups
Figure 5
Figure 5
Effects of GA immunization on synaptic density and AD‐related retino‐cerebral proteins in old ADtg mice. (a) Coronal section map displaying specific brain regions analyzed by IHC; regions include the cingulate cortex/retrosplenial area (Ctx), hippocampus (Hipp), and entorhinal cortex/piriform area (Ent). Magnification of 100× microscopic images covering these brain regions was analyzed for post‐synaptic biomarker (PSD95). 15 consecutive z‐stack images were captured with ApoTome‐equipped Zeiss microscope provided high‐resolution images of synaptic puncta. (b) Quantitative analysis of PSD95+ synaptic area assessed in Hipp, Ent, and combined brain regions in all experimental groups (n = 6–7 mice/group). (c) Pearson's r correlation analysis between total brain PSD95+ synaptic area and astrocytic marker glutamine synthetase (GS)+ area per cell (n = 18 mice). (d) Collective Pearson's r correlation of 6E10+ Aβ‐plaque burden against PSD95+ post‐synaptic density (black), GS+ area/cell (brown), and GFAP+ astrogliosis (green) in the Ent (n = 10–12 mice). (e) Representative fluorescent images (40×) of coronal brain sections from Ent stained for astrocytes (GFAP, red), post‐synaptic protein (PSD95, green), and cell nuclei (DAPI, blue) from PBS‐control (top) and GA‐immunized (bottom) old ADtg mice. (f) Representative, high‐magnification images (100×) of a GA‐immunized ADtg mouse brain showing density of PSD95 density. (g–h) Mass spectrometry analysis of total normalized peak protein area (TNPPA) of significantly changed synaptic proteins, including (g) synaptophysin and (h) synapsin‐2, between all experimental groups (n = 4–6 mice per group). (i) Heat map displaying relative fold change of significantly changed proteins in mass spectrometry analysis. Highlighted are AD‐related amyloid‐associated markers (amyloid‐β A4 protein—APP/Aβ, clusterin—CLN, lysosomal‐associated membrane protein 1 and 2—LAMP1/2) and inflammatory markers (glutamine synthetase—GS, intercellular adhesion molecule 1—ICAM1, h‐2 class I histocompatibility antigen—HA11) that were significantly up‐ or down‐regulated in brain and retinal tissues of PBS‐control ADtg mice versus naïve WT mice and/or GA‐immunized versus PBS‐control ADtg mice (n = 4–6 mice per group). Bar graphs indicate mean, standard error of mean (SEM), and individual data points. *p < 0.05, **p < 0.01, ***p < 0.001, by one‐way ANOVA with Tukey's post‐test for three or more experimental groups. Mass spectrometry analysis by unpaired Student's t test. Pearson's r correlation analysis was used to determine statistical association

References

    1. Alexandrov, P. N. , Pogue, A. , Bhattacharjee, S. , & Lukiw, W. J. (2020). Retinal amyloid peptides and complement factor H in transgenic models of Alzheimer's disease. NeuroReport, 22(12), 623–627. - PMC - PubMed
    1. Allen, N. J. , & Barres, B. A. (2009). Neuroscience: Glia—More than just brain glue. Nature, 457(7230), 675–677. 10.1038/457675a - DOI - PubMed
    1. Allen, N. J. , & Eroglu, C. (2017). Cell biology of astrocyte‐synapse interactions. Neuron, 96(3), 697–708. 10.1016/j.neuron.2017.09.056 - DOI - PMC - PubMed
    1. Alzheimer's Association . (2018). 2018 Alzheimer's disease facts and figures. Alzheimer's & Dementia, 14(3), 367–429. 10.1016/j.jalz.2018.02.001 - DOI
    1. Asanad, S. , Ross‐Cisneros, F. N. , Barron, E. , Nassisi, M. , Sultan, W. , Karanjia, R. , & Sadun, A. A. (2019). The retinal choroid as an oculovascular biomarker for Alzheimer's dementia: A histopathological study in severe disease. Alzheimer's & Dementia: the Journal of the Alzheimer's Association, 11, 775–783. 10.1016/j.dadm.2019.08.005 - DOI - PMC - PubMed

LinkOut - more resources