

Self-reported obstructive sleep apnea, amyloid and tau burden, and Alzheimer's disease time-dependent progression
- PMID: 33090679
- PMCID: PMC8026765
- DOI: 10.1002/alz.12184
Self-reported obstructive sleep apnea, amyloid and tau burden, and Alzheimer's disease time-dependent progression
Abstract
Introduction: Obstructive sleep apnea (OSA) is associated with Alzheimer's disease (AD) biomarkers in cognitively normal (CN) and mild cognitive impaired (MCI) participants. However, independent and combined effects of OSA, amyloid beta (Aβ) and tau-accumulation on AD time-dependent progression risk is unclear.
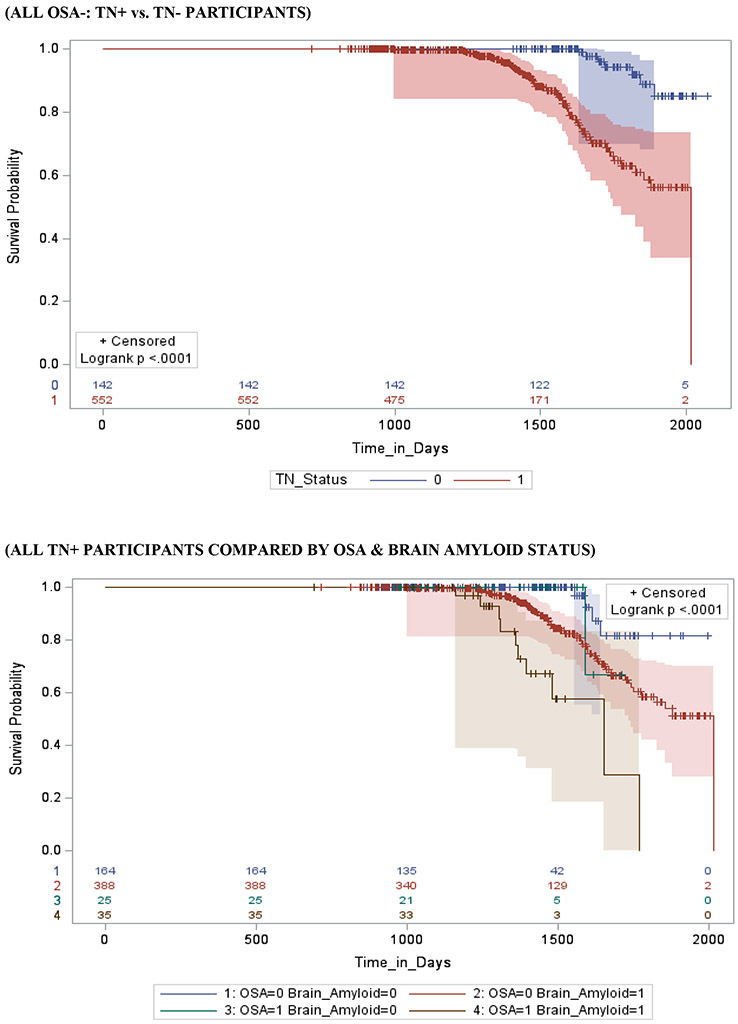
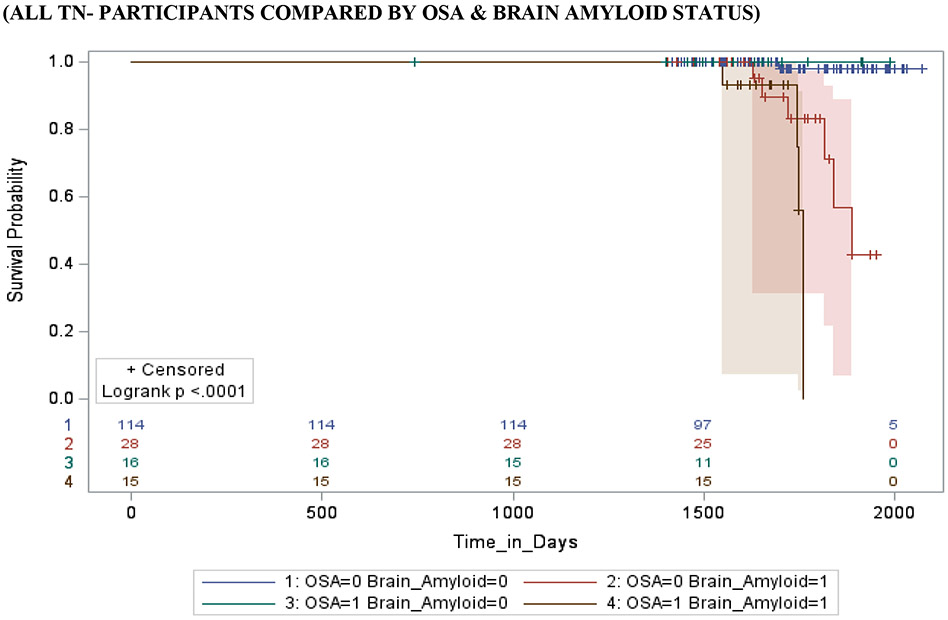
Methods: Study participants grouped by biomarker profile, as described by the A/T/N scheme, where "A" refers to aggregated Aβ, "T" aggregated tau, and "N" to neurodegeneration, included 258 CN (OSA-positive [OSA+] [A+TN+ n = 10, A+/TN- n = 6, A-/TN+ n = 10, A-/TN- n = 6 and OSA-negative [OSA-] [A+TN+ n = 84, A+/TN- n = 11, A-/TN+ n = 96, A-/TN- n = 36]) and 785 MCI (OSA+ [A+TN+ n = 35, A+/TN- n = 15, A-/TN+ n = 25, A-/TN- n = 16] and OSA- [A+TN+ n = 388, A+/TN- n = 28, A-/TN+ n = 164, A-/TN- n = 114]) older-adults from the Alzheimer's Disease Neuroimaging Initiative cohort. Cox proportional hazards regression models estimated the relative hazard of progression from CN-to-MCI and MCI-to-AD, among baseline OSA CN and MCI patients, respectively. Multi-level logistic mixed-effects models with random intercept and slope investigated the synergistic associations of self-reported OSA, Aβ, and tau burden with prospective cognitive decline.
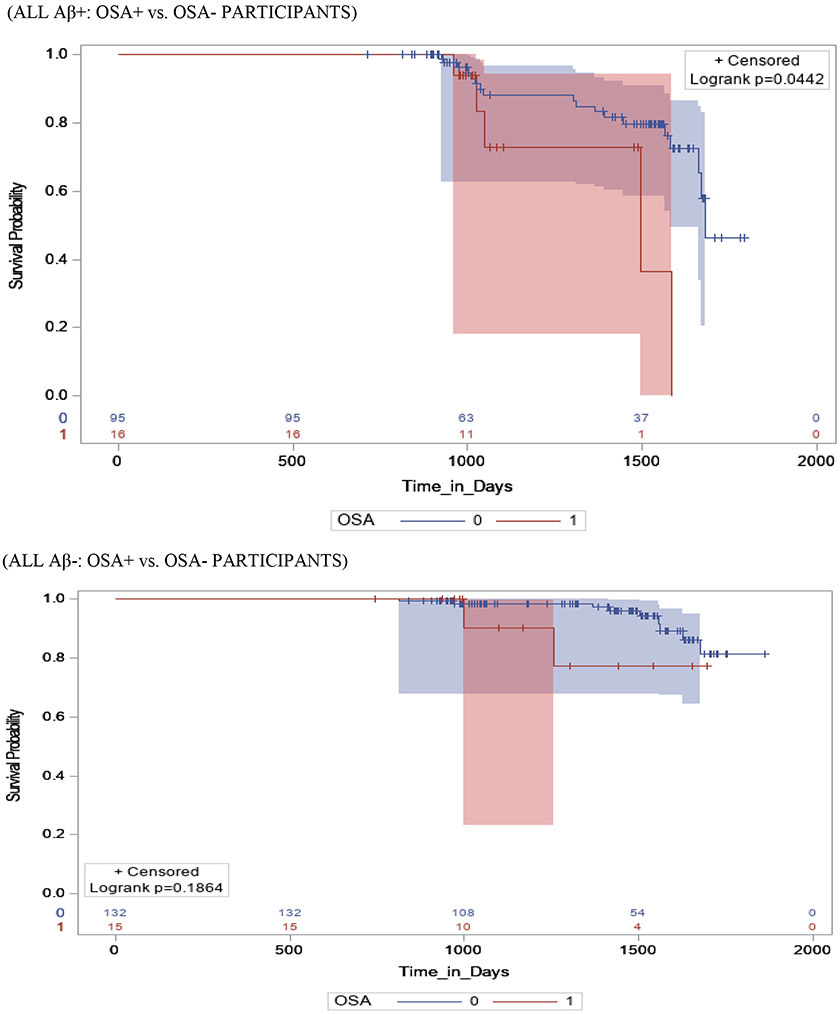
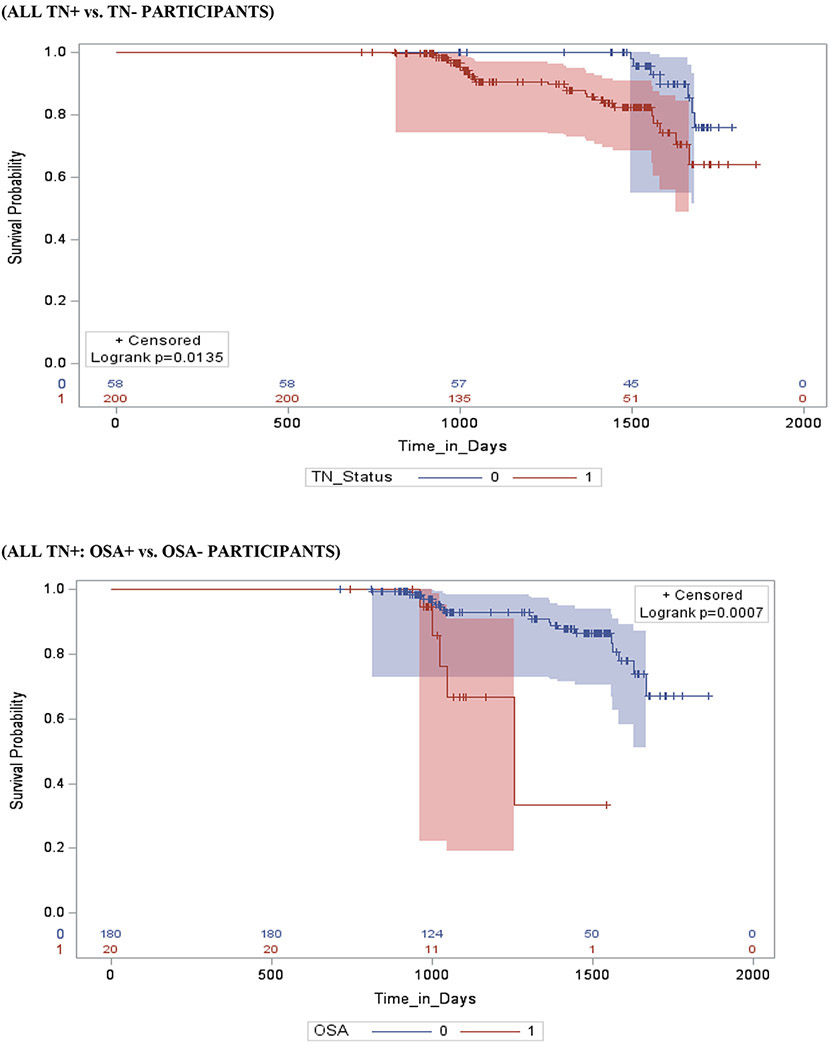
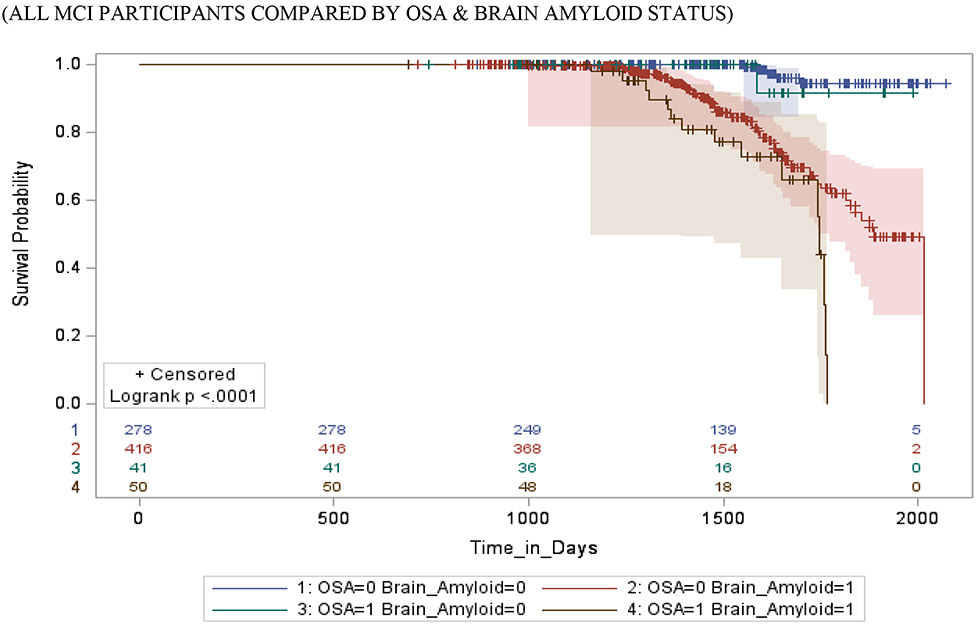
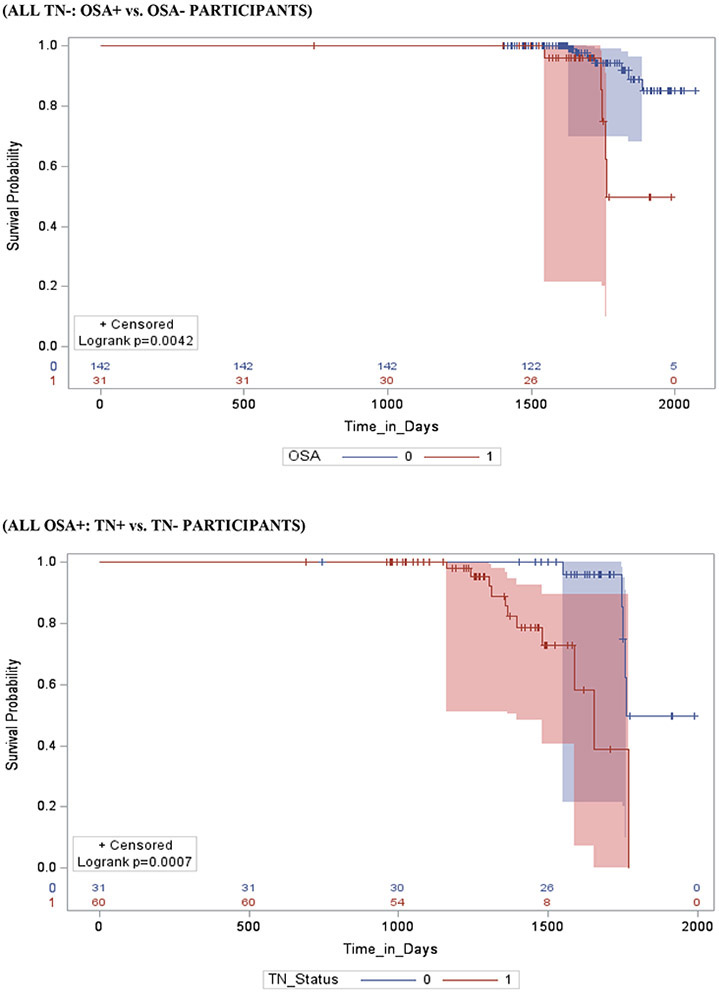
Results: Independent of TN-status (CN and MCI), OSA+/Aβ+ participants were approximately two to four times more likely to progress to MCI/AD (P < .001) and progressed 6 to 18 months earlier (P < .001), compared to other participants combined (ie, OSA+/Aβ-, OSA-/Aβ+, and OSA-/Aβ-). Notably, OSA+/Aβ- versus OSA-/Aβ- (CN and MCI) and OSA+/TN- versus OSA-/TN- (CN) participants showed no difference in the risk and time-to-MCI/AD progression. Mixed effects models demonstrated OSA synergism with Aβ (CN and MCI [β = 1.13, 95% confidence interval (CI), 0.74 to 1.52, and β = 1.18, 95%CI, 0.82 to 1.54]) respectively, and with tau (MCI [β = 1.31, 95% CI, 0.87 to 1.47]), P < .001 for all.
Discussion: OSA acts in synergism with Aβ and with tau, and all three acting together result in synergistic neurodegenerative mechanisms especially as Aβ and tau accumulation becomes increasingly abnormal, thus leading to shorter progression time to MCI/AD in CN and MCI-OSA patients, respectively.
Keywords: Alzheimer's disease; amyloid beta42; brain amyloid‐positron emission tomography; cerebrospinal fluid biomarkers; longitudinal study; obstructive sleep apnea; p‐tau; t‐tau.
© 2020 the Alzheimer's Association.
Conflict of interest statement
Declarations of interest: none
Figures


References
-
- Yaffe K, Nettiksimmons J, Yesavage J, Byers A. Sleep Quality and Risk of Dementia Among Older Male Veterans. The American journal of geriatric psychiatry : official journal of the American Association for Geriatric Psychiatry. 2015;23(6):651–654. - PubMed
-
- Bubu OM, Brannick M, Mortimer J, et al. Sleep, Cognitive impairment, and Alzheimer's disease: A Systematic Review and Meta-Analysis. Sleep. 2017;40(1). - PubMed
Grants and funding
- R01 AG022374/AG/NIA NIH HHS/United States
- T32 HL129953/HL/NHLBI NIH HHS/United States
- K23 HL125939/HL/NHLBI NIH HHS/United States
- R25 HL105444/HL/NHLBI NIH HHS/United States
- R01 AG066870/AG/NIA NIH HHS/United States
- R01 HL118624/HL/NHLBI NIH HHS/United States
- K24 HL109156/HL/NHLBI NIH HHS/United States
- R21 AG049348/AG/NIA NIH HHS/United States
- R21 AG055002/AG/NIA NIH HHS/United States
- L30 AG064670/AG/NIA NIH HHS/United States
- R21 AG059179/AG/NIA NIH HHS/United States
- P30 AG059303/AG/NIA NIH HHS/United States
- R01 AG056682/AG/NIA NIH HHS/United States
- R01 AG056531/AG/NIA NIH HHS/United States
- R01 AG056031/AG/NIA NIH HHS/United States
- K07 AG052685/AG/NIA NIH HHS/United States
LinkOut - more resources
Full Text Sources
