. 2020 Dec;11(6):1459-1475.
doi: 10.1002/jcsm.12626. Epub 2020 Oct 8.

High levels of modified ceramides are a defining feature of murine and human cancer cachexia

Affiliations

High levels of modified ceramides are a defining feature of murine and human cancer cachexia

Pauline Morigny et al. J Cachexia Sarcopenia Muscle. 2020 Dec.

Abstract

Background: Cancer cachexia (CCx) is a multifactorial energy-wasting syndrome reducing the efficiency of anti-cancer therapies, quality of life, and survival of cancer patients. In the past years, most studies focused on the identification of tumour and host-derived proteins contributing to CCx. However, there is still a lack of studies addressing the changes in bioactive lipids. The aim of this study was to identify specific lipid species as a hallmark of CCx by performing a broad range lipid analysis of plasma from well-established CCx mouse models as well as cachectic and weight stable cancer patients.

Methods: Plasma from non-cachectic (PBS-injected mice, NC26 tumour-bearing mice), pre-cachectic and cachectic mice (C26 and LLC tumour-bearing mice, ApcMin/+ mutant mice), and plasma from weight stable and cachectic patients with gastrointestinal cancer, were analysed using the Lipidyzer™ platform. In total, 13 lipid classes and more than 1100 lipid species, including sphingolipids, neutral and polar glycerolipids, were covered by the analysis. Correlation analysis between specific lipid species and readouts of CCx were performed. Lipidomics data were confirmed by gene expression analysis of metabolic organs to analyse enzymes involved in sphingolipid synthesis and degradation.

Results: A decrease in several lysophosphatidylcholine (LPC) species and an increase in numerous sphingolipids including sphingomyelins (SMs), ceramides (CERs), hexosyl-ceramides (HCERs) and lactosyl-ceramides (LCERs), were mutual features of CCx in both mice and cancer patients. Notably, sphingolipid levels gradually increased during cachexia development. Key enzymes involved in ceramide synthesis were elevated in liver but not in adipose, muscle, or tumour tissues, suggesting that ceramide turnover in the liver is a major contributor to elevated sphingolipid levels in CCx. LPC(16:1), LPC(20:3), SM(16:0), SM(24:1), CER(16:0), CER(24:1), HCER(16:0), and HCER(24:1) were the most consistently affected lipid species between mice and humans and correlated negatively (LPCs) or positively (SMs, CERs and HCERs) with the severity of body weight loss.

Conclusions: High levels of sphingolipids, specifically ceramides and modified ceramides, are a defining feature of murine and human CCx and may contribute to tissue wasting and skeletal muscle atrophy through the inhibition of anabolic signals. The progressive increase in sphingolipids during cachexia development supports their potential as early biomarkers for CCx.

Keywords: Cancer cachexia; Ceramides; Lipidomics; Signalling lipids; Sphingolipids.


Conflict of interest statement

All authors declare that they have no conflict of interest.

Figures

Figure 1
Figure 1
Lipidomic analysis of different mouse models of cachexia. (A) Diagram presenting the different mouse experiments conducted. Experiment 1—Comparison of healthy phosphate‐buffered saline (PBS)‐injected controls (grey, n = 6 animals), non‐cachectic NC26 (blue, n = 7 animals) and C26 (C26‐noncx, dark blue, n = 7 animals) tumour‐bearing mice 1 week after tumour implantation (small tumours). Experiment 2—Comparison of healthy PBS controls (grey, n = 8 animals), non‐cachectic NC26 (blue, n = 9 animals), and cachectic C26 (C26‐cx, red, n = 7 animals) tumour‐bearing mice 2–3 weeks after tumour implantation. Experiment 3—Comparison of PBS controls (grey, n = 10 animals), pre‐cachectic (C26‐precx, pink, big tumours but no body weight loss yet, n = 11 animals), and cachectic (C26‐cx, red, big tumours and body weight loss, n = 9 animals) C26 tumour‐bearing mice 2–3 weeks after tumour implantation. Experiment 4—Comparison of healthy PBS controls (for the legend of experiment 3) (grey, n = 5 animals) and cachectic LLC tumour‐bearing mice (yellow, n = 6 animals) 2–3 weeks after tumour implantation. Experiment 5—Comparison of healthy wildtype (WT, grey, n = 9 animals) controls and cachectic ApcMin/+ mutant mice (green, n = 9 animals). (B) Partial least squares‐discriminant analysis (PLS‐DA) score plots for plasma lipid species showing discrimination between the different groups of each experiment. PLS‐DAs were calculated using MetaboAnalyst 4.0. Ellipses represent 95% confidence intervals for each individual group. (C) Volcano plots showing changes in plasma lipid species between C26‐noncx/NC26 tumour‐bearing mice, C26‐cx/NC26 tumour‐bearing mice, C26‐cx/C26‐precx tumour‐bearing mice, LLC tumour‐bearing mice/PBS controls, and mutant ApcMin/+ mice/WT mice. The dashed lines indicate adjusted P value (qBH) of 0.05. Statistical analyses were performed using two‐sided Wilcoxon rank sum tests. P values were adjusted for multiple testing using the Benjamini–Hochberg correction method.
Figure 2
Figure 2
Various lipid classes are altered in plasma of cachectic mice. (AE) Plasma lipid class sum concentrations for each experiment. Triacylglycerols (TAG) (A), lysophosphatidylcholine (LPC) (B), sphingomyelins (SM) (C), ceramides (CER) (D), hexosyl‐ceramide (HCER) (E). From left to right: Experiment 1—Phosphate‐buffered saline (PBS) (grey boxplots, n = 6 animals), non‐cachectic NC26 (blue boxplots, n = 7 animals), and C26 (C26‐noncx, dark blue boxplots, n = 7 animals) tumour‐bearing mice. Experiment 2—PBS (grey boxplots, n = 8 animals), non‐cachectic NC26 (blue boxplots, n = 9 animals), and cachectic C26 tumour‐bearing mice (C26‐cx, red boxplots n = 7 animals). Experiment 3—PBS (grey boxplots, n = 10 animals), pre‐cachectic (C26‐precx, pink boxplots, n = 11 animals) and cachectic (C26‐cx, red boxplots, n = 9 animals) C26 tumour‐bearing mice. Experiment 4—PBS (grey boxplots, n = 5 animals) and cachectic LLC tumour‐bearing mice (yellow boxplots, n = 6 animals). Experiment 5—Wildtype (WT, grey boxplots, n = 9 animals) and cachectic ApcMin/+ mutant mice (green boxplots, n = 9 animals). Data are median 10–90 percentile. Statistical analyses were performed using unpaired one‐way ANOVA or Kruskal–Wallis tests with Bonferroni or Dunn's post‐hoc tests respectively (experiments 1–3) and unpaired t test or Mann and Whitney test (experiments 4–5). Tests were two sided. *P < 0.05, **P < 0.01, ***P < 0.001, ****P < 0.0001.
Figure 3
Figure 3
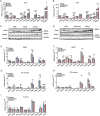
Expression of key enzymes involved in sphingolipid metabolism is altered in metabolic organs. (A,B) Liver mRNA levels of enzymes involved in ceramide metabolism in phosphate‐buffered saline (PBS) (grey bars, n = 8 animals), non‐cachectic NC26 (blue bars, n = 7 animals), and cachectic C26 (C26‐cx, red bars, n = 6 animals) tumour‐bearing mice (A, experiment 2); and PBS (grey bars, n = 10 animals), pre‐cachectic (C26‐precx, pink bars, n = 11 animals), and cachectic (C26‐cx, red bars, n = 9 animals) C26 tumour‐bearing mice (B, experiment 3). (C,D) Liver protein levels of Cers6 and Smpd1 from experiments 2 and 3. Vinculin was used as loading control. (EI) mRNA levels of enzymes involved in ceramide metabolism in epididymal white adipose tissue (eWAT) (E,F), GC muscle (G,H), and tumour (I). Data are mean ± SEM; statistical analyses were performed using unpaired one‐way ANOVA or Kruskal–Wallis tests with Bonferroni or Dunn's post‐hoc tests, respectively. Tests were two sided. *P < 0.05, **P < 0.01, ***P < 0.001, ****P < 0.0001.
Figure 4
Figure 4
Profiles of circulating lipids in cachectic and weight‐stable cancer patients resemble changes in cancer cachexia (CCx) mouse models. (A) Volcano plot showing the changes in plasma lipid species between cachectic (Cx, n = 20 individuals) and weight stable (Ws, n = 19 individuals) cancer patients. The dashed line indicates the adjusted P value (qBH) of 0.05. Statistical analyses were performed using two‐sided Wilcoxon rank sum tests. P values were adjusted for multiple testing using the Benjamini–Hochberg correction method. (B) Plasma lipid class sum concentrations of weight stable (Ws, grey boxplots, n = 19 individuals) and cachectic (Cx, orange boxplots, n = 20 individuals) cancer patients. Data are median 10–90 percentile. (C) Heat map showing the fold change in plasma lipid class concentrations in non‐cachectic (NC26/PBS, C26‐noncx/NC26), pre‐cachectic (C26‐precx/PBS), and cachectic mice (C26‐cx/NC26, C26‐cx/C26‐precx, LLC/PBS, ApcMin/+/WT) as well as cachectic cancer patients (Cx/Ws patients). Statistical analyses were performed using unpaired t tests or Mann–Whitney tests (B,C) and unpaired one‐way ANOVA or Kruskal–Wallis tests with Bonferroni or Dunn's post‐hoc tests (C). Tests were two sided. *P < 0.05, **P < 0.01, ***P < 0.001, ****P < 0.0001.
Figure 5
Figure 5
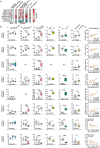
Commonly altered lipid species in mice and patients correlate with cachexia severity. (A) Heat map showing the fold change of the most consistently affected lipid species between non‐cachectic [NC26/phosphate buffered saline (PBS), C26‐noncx/NC26], pre‐cachectic (C26‐precx/PBS), and cachectic mice (C26‐cx/NC26, C26‐cx/C26‐precx, LLC/PBS, ApcMin/+/WT) as well as cachectic cancer patients (Cx/Ws patients). Statistical analyses were performed using two‐sided Wilcoxon rank sum tests. P values were adjusted for multiple testing using the Benjamini–Hochberg correction method. *P < 0.05, **P < 0.01, ***P < 0.001. (B) Plasma concentration of the top lipid species associated with cachexia. From left to right: PBS (grey boxplots, n = 6 animals), non‐cachectic NC26 (blue boxplots, n = 7 animals), and C26 (C26‐noncx, dark blue boxplots, n = 7 animals) tumour‐bearing mice. PBS (grey boxplots, n = 8 animals), non‐cachectic NC26 (blue boxplots, n = 9 animals), and cachectic C26 tumour‐bearing mice (C26‐cx, red boxplots n = 7 animals). PBS (grey boxplots, n = 10 animals), pre‐cachectic (C26‐precx, pink boxplots, n = 11 animals), and cachectic (C26‐cx, red boxplots, n = 9 animals) C26 tumour‐bearing mice. PBS (grey boxplots, n = 5 animals) and cachectic LLC tumour‐bearing mice (yellow boxplots, n = 6 animals). Wildtype (WT, grey boxplots, n = 9 animals) and cachectic ApcMin/+ mutant mice (green boxplots, n = 9 animals). Weight stable (Ws, grey boxplots, n = 19 individuals) and cachectic (Cx, orange boxplots, n = 20 individuals) cancer patients. (C) Correlations between the concentration of lipid species and percentage of body weight loss in weight stable (grey dots, n = 19 individuals) and cachectic (orange dots, n = 20 individuals) cancer patients. Data are median 10–90 percentile (B). Statistical analyses were performed using unpaired one‐way ANOVA or Kruskal–Wallis tests with Bonferroni or Dunn's post‐hoc tests (B, experiments 1‐3), unpaired t test or Mann‐Whitney test (B, experiments 4‐5 and cancer patients) and linear regression (C). Tests were two sided. *P < 0.05, **P < 0.01, ***P < 0.001, ****P < 0.0001.
Figure 6
Figure 6
Overview of the main ceramide synthesis enzymes altered in livers of cachectic mice, as well as the main sphingolipid species increased with cancer cachexia.

Comment in

  • Biomarkers for cancer cachexia: where do we stand?
    Palus S, Springer J. Palus S, et al. J Cachexia Sarcopenia Muscle. 2020 Dec;11(6):1388-1389. doi: 10.1002/jcsm.12641. Epub 2020 Nov 30. J Cachexia Sarcopenia Muscle. 2020. PMID: 33258306 Free PMC article. No abstract available.

References

    1. Fearon K, Strasser F, Anker SD, Bosaeus I, Bruera E, Fainsinger RL, et al. Definition and classification of cancer cachexia: an international consensus. Lancet Oncol 2011;12:489–495. - PubMed
    1. Argiles JM, Stemmler B, López‐Soriano FJ, Busquets S. Inter‐tissue communication in cancer cachexia. Nat Rev Endocrinol 2018;15:9–20. - PubMed
    1. Schmidt SF, Rohm M, Herzig S, Diaz MB. Cancer cachexia: more than skeletal muscle wasting. Trends Cancer 2018;4:849–860. - PubMed
    1. Argiles JM, López‐Soriano FJ, Stemmler B, Busquets S. Novel targeted therapies for cancer cachexia. Biochem J 2017;474:2663–2678. - PubMed
    1. Biswas AK, Acharyya S. Understanding cachexia in the context of metastatic progression. Nat Rev Cancer 2020;20:274–284. - PubMed

Publication types