. 2020 Oct 22;16(10):e1008336.
doi: 10.1371/journal.pcbi.1008336. eCollection 2020 Oct.

LocusFocus: Web-based colocalization for the annotation and functional follow-up of GWAS

Affiliations

LocusFocus: Web-based colocalization for the annotation and functional follow-up of GWAS

Naim Panjwani et al. PLoS Comput Biol. .

Abstract

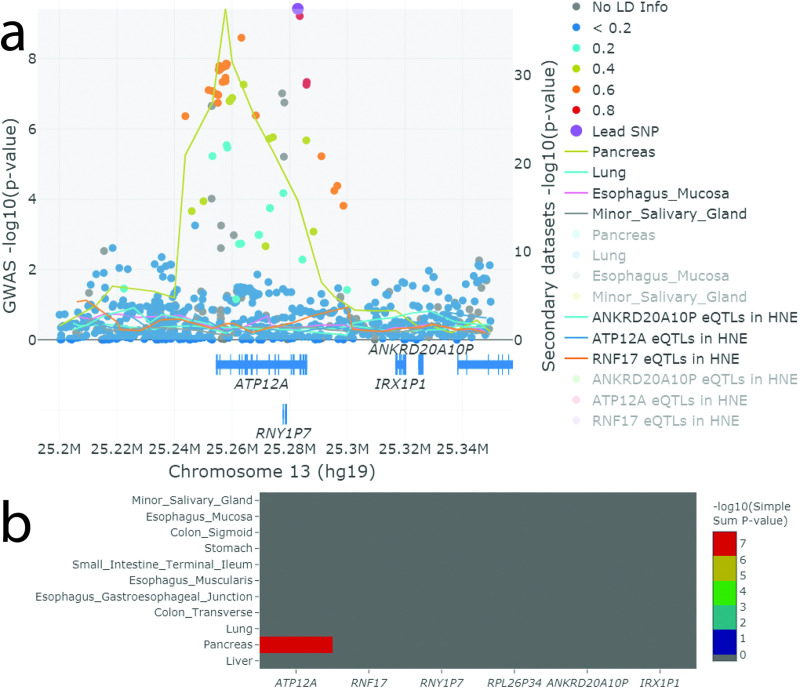
Genome-wide association studies (GWAS) have primarily identified trait-associated loci in the non-coding genome. Colocalization analyses of SNP associations from GWAS with expression quantitative trait loci (eQTL) evidence enable the generation of hypotheses about responsible mechanism, genes and tissues of origin to guide functional characterization. Here, we present a web-based colocalization browsing and testing tool named LocusFocus (https://locusfocus.research.sickkids.ca). LocusFocus formally tests colocalization using our established Simple Sum method to identify the most relevant genes and tissues for a particular GWAS locus in the presence of high linkage disequilibrium and/or allelic heterogeneity. We demonstrate the utility of LocusFocus, following up on a genome-wide significant locus from a GWAS of meconium ileus (an intestinal obstruction in cystic fibrosis). Using LocusFocus for colocalization analysis with eQTL data suggests variation in ATP12A gene expression in the pancreas rather than intestine is responsible for the GWAS locus. LocusFocus has no operating system dependencies and may be installed in a local web server. LocusFocus is available under the MIT license, with full documentation and source code accessible on GitHub at https://github.com/naim-panjwani/LocusFocus.


Conflict of interest statement

The authors have declared that no competing interests exist.

Figures

Fig 1
Fig 1. Sample interactive plot output from the LocusFocus web application.
GWAS summary statistics of MI in individuals with CF for chr13q12.12 and eQTLs from HNEs from individuals with CF were uploaded, and digestive tissues and lung from GTEx were selected for colocalization analysis (interactive plots available at bit.ly/LocusFocus-ATP12A-Example). A more detailed explanation of all components of the figure is provided in S2A Fig) Filled circles represent GWAS -log10(p-values) (left y-axis) for MI. Lines (right y-axis) serve as a visual guide of the secondary datasets and trace the lowest p-value per 22.5bp window. Gene track is from GENCODE v19, with transcripts collapsed into single genes. The gray shaded region shows the region used for the SS calculation, 0.1 Mbp on each side of the selected lead SNP is the default. We used the full region for the SS calculations. Users may click the tissue panel list in the legend to show or hide information. The eQTL scatterplots, from which the line traces are derived from, are hidden by default but may be overlaid by clicking on the grayed-out text in the legend. All tissues were tested (S1 Table and S2 Fig, or view interactively at bit.ly/LocusFocus-ATP12A-Full-Example). Other features of the plot include the ability to zoom in, tooltips for each data point, save image options in png or svg vector format, selection and fading tools, and resetting, rescaling or shifting of axes. b) The heatmap shown summarizes the SS colocalization tests for all the genes in the user-defined region and across all the selected tissues. Gray squares indicate either no eQTL data (typically due to little or no expression), or the gene-tissue pair does not have significant eQTL signal after Bonferroni correction (see S1 Table for exact reason). Colocalization for eQTLs in HNEs are summarized as an interactive table online and were either not significant or were not expressed for all six genes (S2 Fig).

References

    1. Maurano MT, Humbert R, Rynes E, Thurman RE, Haugen E, Wang H, et al. Systematic localization of common disease-associated variation in regulatory DNA. Science. 2012;337(6099):1190–5. 10.1126/science.1222794 - DOI - PMC - PubMed
    1. Edwards SL, Beesley J, French JD, Dunning AM. Beyond GWASs: illuminating the dark road from association to function. Am J Hum Genet. 2013;93(5):779–97. 10.1016/j.ajhg.2013.10.012 - DOI - PMC - PubMed
    1. Giambartolomei C, Vukcevic D, Schadt EE, Franke L, Hingorani AD, Wallace C, et al. Bayesian test for colocalisation between pairs of genetic association studies using summary statistics. PLoS Genet. 2014;10(5):e1004383 10.1371/journal.pgen.1004383 - DOI - PMC - PubMed
    1. Hormozdiari F, van de Bunt M, Segre AV, Li X, Joo JWJ, Bilow M, et al. Colocalization of GWAS and eQTL Signals Detects Target Genes. Am J Hum Genet. 2016;99(6):1245–60. 10.1016/j.ajhg.2016.10.003 - DOI - PMC - PubMed
    1. Nica AC, Montgomery SB, Dimas AS, Stranger BE, Beazley C, Barroso I, et al. Candidate causal regulatory effects by integration of expression QTLs with complex trait genetic associations. PLoS Genet. 2010;6(4):e1000895 10.1371/journal.pgen.1000895 - DOI - PMC - PubMed

Publication types

MeSH terms