. 2020 Oct 22;16(10):e1008899.
doi: 10.1371/journal.ppat.1008899. eCollection 2020 Oct.

Herpes simplex virus type 1 infection leads to neurodevelopmental disorder-associated neuropathological changes

Affiliations

Herpes simplex virus type 1 infection leads to neurodevelopmental disorder-associated neuropathological changes

Haowen Qiao et al. PLoS Pathog. .

Abstract

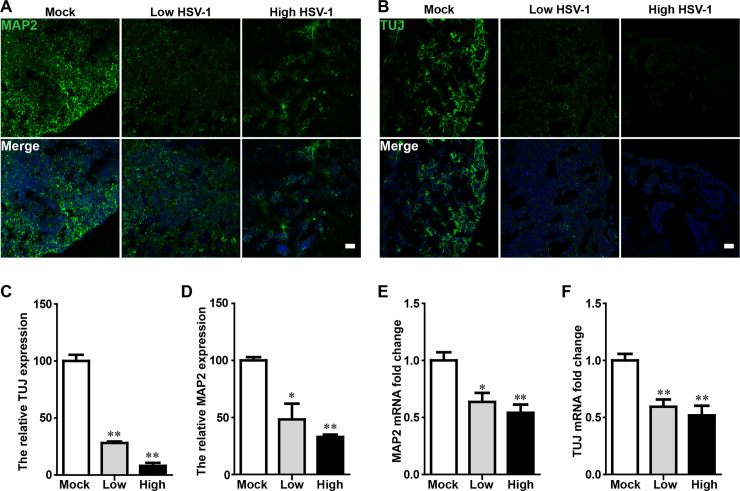
Neonatal herpes simplex virus type 1 (HSV-1) infections contribute to various neurodevelopmental disabilities and the subsequent long-term neurological sequelae into the adulthood. However, further understanding of fetal brain development and the potential neuropathological effects of the HSV-1 infection are hampered by the limitations of existing neurodevelopmental models due to the dramatic differences between humans and other mammalians. Here we generated in vitro neurodevelopmental disorder models including human induced pluripotent stem cell (hiPSC)-based monolayer neuronal differentiation, three-dimensional (3D) neuroepithelial bud, and 3D cerebral organoid to study fetal brain development and the potential neuropathological effects induced by the HSV-1 infections. Our results revealed that the HSV-1-infected neural stem cells (NSCs) exhibited impaired neural differentiation. HSV-1 infection led to dysregulated neurogenesis in the fetal neurodevelopment. The HSV-1-infected brain organoids modelled the pathological features of the neurodevelopmental disorders in the human fetal brain, including the impaired neuronal differentiation, and the dysregulated cortical layer and brain regionalization. Furthermore, the 3D cerebral organoid model showed that HSV-1 infection promoted the abnormal microglial activation, accompanied by the induction of inflammatory factors, such as TNF-α, IL-6, IL-10, and IL-4. Overall, our in vitro neurodevelopmental disorder models reconstituted the neuropathological features associated with HSV-1 infection in human fetal brain development, providing the causal relationships that link HSV biology with the neurodevelopmental disorder pathogen hypothesis.


Conflict of interest statement

The authors have declared that no competing interests exist.

Figures

Fig 1
Fig 1. HSV-1-infected NSCs exhibited increased cell apoptosis.
(A) Schematic representation of the experimental pipeline used in the differentiation process of hiPSC-derived neurons. (B) Confirmation of the characteristic expression of hiPSCs, hiPSC-derived NSCs, and NSC-derived neurons. Immunolabeling of SOX2 and Nestin in hiPSC-derived NSCs at the day 7; NSCs were further differentiated into neurons illustrated using MAP2 and NeuN immunofluorescence after the day 21 of neural induction. Scale bars represent 50 μm. (C) Sample images of hiPSCs, NSCs and neurons 24 hours after infection with HSV-1, immunostained for HSV1 gE envelop protein (green) and DAPI (blue). The images were taken using an Olympus microscope. Scale bars represent 100 μm. (D) Quantification of infection efficiency for different cell types, including hiPSCs, hiPSC-derived NSCs, and NSC-derived neurons. Data represent the mean ± SEM. *p < 0.05 by ANOVA (n = 3 per sample). (E) Flow cytometry analysis showed the apoptotic NSCs after 24 hours treatment with or without HSV-1 infection (0.2 MOI or 2 MOI) for 2 hours. (F) Bar graphs showed the percentage of late apoptotic cells. Data represent the mean ± SEM. *p < 0.05, **p < 0.01 by ANOVA (n = 3 per sample).
Fig 2
Fig 2. HSV-1-infected NSCs exhibited dysregulated neural differentiation.
(A) Schematic diagram depicting the effect of HSV-1-infection on the NSCs in the term of neuronal differentiation. (B) Sample images of NSCs after 24 hour infection without or with HSV-1(0.2 MOI or 2 MOI) for 2 hours, immunostained for NSCs markers Nestin (green) and SOX2 (red) and DAPI (blue). The images were taken using an Olympus microscope. (C) Quantification of Nestin and SOX2. (D) Detection of the mRNA expression of SOX2 and Nestin (n = 3). (E) The expressions of MAP2 were identified by immunofluorescence staining, and the quantifications (F) for the percentage of MAP2+ were shown using Image J. Data represent the mean ± SEM. *p < 0.05, **p < 0.01 by ANOVA (n = 3 per sample). (G) Unsupervised hierarchical clustering of genes differentially expressed in NSCs on the basis of infection with or without HSV-1 (0.2MOI, 2MOI). (H) Gene Ontology (GO) biological process groups enriched in genes down-regulated in NSCs infected with the HSV-1(0.2 MOI), compared with the NSCs.
Fig 3
Fig 3. The neuroepithelial buds and cerebral organoids recapitulated early stages of human fetal brain development.
(A) Schematic diagram depicting the effect of HSV-1-infection on the neuroepithelial buds and brain organoids in the areas of modelling the pathological features of developing human fetal brain, including injured neurogenesis, impaired neuronal differentiation, abnormal microglial activation, and dysregulated brain regionalization. (B) Schematic diagram of the neuroepithelial bud and cerebral organoid method and timing. Scale bars: 50μm. (C) The immunofluorescence staining for PAX6, TUJ, Nestin, and SOX2 in the neuroepithelial buds at the day 18. Scale bars: 25 μm. (D) Expressions of the specific brain regions markers (forebrain, PAX6; hindbrain ISL1) in brain organoids at the day 18; the cerebral organoids derived from hiPSCs at the day 45 showed the diverse neuron subtypes, including the mature neurons (MAP2), the astrocyte marker (GFAP), and microglia markers (Iba1). Scale bars: 25 μm. The images were taken Images were captured on a Leica TCS SP8 STED confocal microscope.
Fig 4
Fig 4. HSV-1 infection impaired neurogenesis in neuroepithelial buds.
(A) The immunofluorescence staining for Nestin and SOX2 in the neuroepithelial buds at 18 days after 3 days with HSV-1 infection (Mock, Low infection, and High infection). Scale bars: 25 μm. The images were taken Images were captured on a Leica TCS SP8 STED confocal microscope. (B) Relative fluorescence intensity statistics of SOX2 and Nestin expressions were shown in different groups. Specifically, the expression of SOX2 was calculated by dividing the integrated optical density (IOD) with the total area of the nucleus, and the expression of Nestin was calculated by dividing the IOD with the total area of the cytoplasm. Images were prepared using ImageJ software (NIH, MD, USA). Data represent the mean ± SEM. *p < 0.05, **p < 0.01 by ANOVA (n = 3 per sample). (C) The mRNA expressions of Nestin and SOX2 were identified by RT-PCR. Data represent the mean ± SEM. *p < 0.05, **p < 0.01 by ANOVA (n = 4 per sample). (D) The immunofluorescence staining on the neuroepithelial buds was performed for detecting positive HSV-1 gE envelop protein at 18 day after 3 days with HSV-1 infection. Scale bars: 25 μm. (E) Bar graphs showing the percentages of HSV-1-positive cells in the neuroepithelial buds. Data represent the mean ± SEM from four experiments.
Fig 5
Fig 5. Dysregulated the cortical layer and hindbrain populations in HSV-1-infected neuroepithelial buds.
(A) The dorsal NSC marker (PAX6) and newborn neuron marker (TUJ) were observed in the brain cerebral organoids at the 18 day after 3 days with HSV-1 infection (Mock, Low infection). Scale bars: 25 μm. The images were taken Images were captured on a Leica TCS SP8 STED confocal microscope. (B) Comparison of depths of CP layer between mock- and HSV-1-infected neuroepithelial buds. (C) Immunofluorescence staining for the hindbrain marker (ISL1) in neuroepithelial buds at the day 18 after 3 days with HSV-1 infection. Scale bars: 25 μm. (D) Quantification of ISL1-positive cells in the presence or absence of HSV-1 infection. Data represent the mean ± SEM from four experiments. **p < 0.01 by Student’s t test.
Fig 6
Fig 6. HSV-1 infection inhibited neuronal differentiation in HSV-1-infected cerebral organoids.
(A and B) Immunofluorescence staining for the mature neuronal marker (MAP2) and early neurons marker (TUJ) in cerebral organoids at the day 45 after 3 days with HSV-1 infection. The images were taken Images were captured on a Leica TCS SP8 STED confocal microscope. Scale bars: 25 μm. (C and D) The relative fluorescence intensity statistics of MAP2 and TUJ expressions were shown in different groups. Data represent the mean ± SEM. *p < 0.05, **p < 0.01 by ANOVA (n = 3 per sample). (E and F) Validation by RT-PCR of MAP2 and TUJ in cerebral organoids at the day 45 for 3 days with HSV-1 infection (Mock, Low infection, and High infection). Data represent the mean ± SEM. *p < 0.05, **p < 0.01 by ANOVA (n = 4 per sample).
Fig 7
Fig 7. HSV-1 infection promoted abnormal microglial proliferation and activation in cerebral organoid.
(A and D) Immunofluorescence staining for microglia markers (Iba1) and activated microglia (CD11b) in cerebral organoids at the day 45 after 3 days with HSV-1 infection. The images were taken Images were captured on a Leica TCS SP8 STED confocal microscope. Scale bars: 25 μm. (B and E) The relative fluorescence intensity statistics of Iba1 and CD11b expressions were shown in different groups. (C and F) Validation by RT-PCR of CD11b and Iba1 in cerebral organoids at the day 45 for 3 days with HSV-1 infection (Mock, Low infection, and High infection). Data represent the mean ± SEM. *p < 0.05, **p < 0.01 by ANOVA (n = 4 per sample). (G-J) The mRNA expressions were examined for the inflammatory cytokines (TNF-α, IL-6, IL-10, and IL-4) using RT-PCR in brain cerebral organoids at the day 45 after 3 days with or without HSV-1 infection. Data represent the mean ± SEM. *p < 0.05, **p < 0.01 by ANOVA (n = 3 per sample).
Fig 8
Fig 8. HSV-1 infection accelerated the astrocytes activation in neuroepithelial buds and cerebral organoids.
(A) Immunofluorescence staining for the astrocyte marker (GFAP) in neuroepithelial buds at the day 18 after 3 days with HSV-1 infection. The images were taken Images were captured on a Leica TCS SP8 STED confocal microscope. (B) Relative fluorescence intensity statistics of GFAP expression were shown in different groups. (C) Detection of GFAP mRNA expression in neuroepithelial buds (n = 4). Data represent the mean ± SEM. **p < 0.01 by Student’s t test. (D) The sample images of immunostaining for GFAP in the cerebral organoids at the day 45 for 3 days with HSV-1 infection (Mock, Low infection, and High infection). Scale bars: 25 μm. (E) The relative fluorescence intensity statistics of GFAP expressions were shown in different groups. Data represent the mean ± SEM from three experiments. **p < 0.01 by ANOVA.

References

    1. Doernberg E, Hollander E. Neurodevelopmental Disorders (ASD and ADHD): DSM-5, ICD-10, and ICD-11. CNS Spectr. 2016;21(4):295–299. 10.1017/S1092852916000262 . - DOI - PubMed
    1. Lin CH, Lin WD, Chou IC, Lee IC, Hong SY. Epilepsy and Neurodevelopmental Outcomes in Children With Etiologically Diagnosed Central Nervous System Infections: A Retrospective Cohort Study. Front Neurol. 2019;10:528 10.3389/fneur.2019.00528 . - DOI - PMC - PubMed
    1. Anzivino E, Fioriti D, Mischitelli M, Bellizzi A, Barucca V, Chiarini F, et al. Herpes simplex virus infection in pregnancy and in neonate: status of art of epidemiology, diagnosis, therapy and prevention. Virol J. 2009;6:40 10.1186/1743-422X-6-40 . - DOI - PMC - PubMed
    1. Ecker C, Bookheimer SY, Murphy DGM. Neuroimaging in autism spectrum disorder: brain structure and function across the lifespan. The Lancet Neurology. 2015;14(11):1121–1134. 10.1016/S1474-4422(15)00050-2 . - DOI - PubMed
    1. Corradini I, Focchi E, Rasile M, Morini R, Desiato G, Tomasoni R, et al. Maternal Immune Activation Delays Excitatory-to-Inhibitory Gamma-Aminobutyric Acid Switch in Offspring. Biological Psychiatry. 2018;83(8):680–691. 10.1016/j.biopsych.2017.09.030 . - DOI - PubMed

Publication types

MeSH terms