. 2021 Jan 4;218(1):e20192193.
doi: 10.1084/jem.20192193.

α-Synuclein modulates tau spreading in mouse brains

Affiliations

α-Synuclein modulates tau spreading in mouse brains

Fares Bassil et al. J Exp Med. .

Abstract

α-Synuclein (α-syn) and tau aggregates are the neuropathological hallmarks of Parkinson's disease (PD) and Alzheimer's disease (AD), respectively, although both pathologies co-occur in patients with these diseases, suggesting possible crosstalk between them. To elucidate the interactions of pathological α-syn and tau, we sought to model these interactions. We show that increased accumulation of tau aggregates occur following simultaneous introduction of α-syn mousepreformed fibrils (mpffs) and AD lysate-derived tau seeds (AD-tau) both in vitro and in vivo. Interestingly, the absence of endogenous mouse α-syn in mice reduces the accumulation and spreading of tau, while the absence of tau did not affect the seeding or spreading capacity of α-syn. These in vivo results are consistent with our in vitro data wherein the presence of tau has no synergistic effects on α-syn. Our results point to the important role of α-syn as a modulator of tau pathology burden and spreading in the brains of AD, PDD, and DLB patients.


Conflict of interest statement

Disclosures: The authors declare no competing interests exist.

Figures
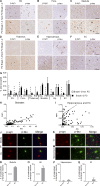
Figure 1.
Figure 1.
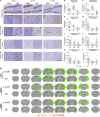
α-Syn load correlates with tau burden in the brainstem, but not cortical regions, of patients with PD in the absence of Aβ. (A–F) Representative images for mAb 81A p-α-syn and PHF1 p-tau pathology in tissue sections from the (A) substantia nigra (SN), (B) pons, (C) medulla, (D) thalamus, (E) hippocampus, and (F) entorhinal cortex (EC) in PD Braak stage 1–2 and non-PD Braak stage 1–2 patients. Scale bars, 100 µm. (G) A grouped bar graph shows a positive association between α-syn and tau percentage area stained. A two-tailed t test was performed to calculate the difference between groups. If the data were not normally distributed, a Mann–Whitney test was used. ****, P < 0.0001. (H and I) Correlation analysis between α-syn and tau in the brainstem (H; r = 0.87), hippocampus, and entorhinal cortex (I; r = 0.14). (J–M) IF double labeling was conducted for p-α-syn (red) and p-tau (green) using 81A and PHF1, respectively, in the medulla (J), entorhinal cortex (K), substantia nigra (L), and hippocampus (M) of PD patients. Scale bar, 40 µm. (N–Q) Percentage of p-tau–positive cells that were also positive for p-α-syn in the medulla (N), substantia nigra (O), hippocampus (P), and entorhinal cortex (Q) of PD patients. A two-tailed t test was performed to calculate the difference between groups; ****, P < 0.0001. Data are presented as mean ± SEM. All experimental data were quantified by two blinded scientists.
Figure 2.
Figure 2.
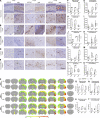
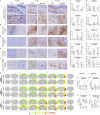
P-α-syn pathology varies spatially and temporally after injection of α-syn mpffs and AD-tau–enriched extracts under copathology conditions. (A–D) Representative images for mAb 81A p-α-syn pathology in tissue sections from rostral and caudal hippocampus (A), entorhinal cortex (B), retrosplenial cortex (C), and auditory cortex (D) of WT mice at 3, 6, or 9 mpi of either α-syn mpffs alone or combined with AD-tau–enriched extracts. (E–L) Quantification of p-α-syn seen in A–D in the ipsilateral (E) and contralateral (F) hippocampus, ipsilateral (G) and contralateral (H) entorhinal cortex, ipsilateral (I) and contralateral (J) retrosplenial cortex, and ipsilateral (K) and contralateral (L) auditory cortex. (M) Semiquantitative heat mapping of p-α-syn pathology (see Materials and methods for details) in WT mice injected with either α-syn mpffs alone or α-syn mpffs combined with human AD-tau–enriched extracts. A two-tailed t test was performed to calculate the difference between groups; *, P < 0.05. Data are presented as mean ± SEM (n = 5 mice per group). Scale bar, 100 µm. All experimental data were verified in at least two independent experiments.
Figure 3.
Figure 3.
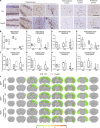
P-tau pathology is enhanced under copathology conditions after injection of AD-tau–enriched extracts combined with α-syn mpffs compared with AD-tau extracts alone. (A–E) Representative images for AT8 p-tau pathology in tissue sections from the rostral and caudal hippocampus (A), entorhinal cortex (B), retrosplenial cortex (C), auditory cortex (D), and supramammillary nucleus (E) of WT mice 3, 6, or 9 mpi of either AD-tau–enriched extracts alone or combined with α-syn mpffs. (F–O) Quantification of p-tau seen in A–E in the ipsilateral (F) and contralateral (G) hippocampus, ipsilateral (H) and contralateral (I) entorhinal cortex, ipsilateral (J) and contralateral (K) retrosplenial cortex, ipsilateral (L) and contralateral (M) auditory cortex, and ipsilateral (N) and contralateral (O) supramammillary nucleus. (P) Semiquantitative heat mapping of p-tau pathology in WT mice injected with either human AD-tau extract alone or combined with α-syn mpffs. (Q–T) Quantification of p-tau–positive neurons in the ipsilateral hippocampus (Q), contralateral hippocampus (R), ipsilateral entorhinal cortex (S), and contralateral entorhinal cortex (T) of mice injected with either human AD-tau–enriched extracts alone or combined with α-syn mpffs 3, 6, or 9 mpi. A two-tailed t test was performed to calculate the difference between groups; *, P < 0.05; **, P < 0.01; ***, P < 0.001. Data are presented as mean ± SEM (n = 5–6 mouse brains per group). Scale bar, 100 µm. All experimental data were verified in at least two independent experiments.
Figure S1.
Figure S1.
Clearance of injected AD p-tau from the brain is not affected by the presence of α-syn mpffs. (A and B) Hippocampal sections of WT mice injected with either human AD-tau–enriched extracts alone or combined with α-syn mpffs stained for either human total tau (A) or AD brain-derived p-tau (B) 5, 10, or 30 d after injection. Scale bar, 100 µm. All experimental data were verified in at least two independent experiments.
Figure S2.
Figure S2.
Neuritic p-tau pathology is modulated by the presence of α-syn. (A–E) P-tau staining 3 mpi in the hippocampus, auditory cortex, and entorhinal cortex (A) injected with either human AD-tau–enriched extracts alone or combined with α-syn mpffs (0.4 mg/ml) in WT and α-synKO mice, (B) mice injected with either human AD-tau–enriched extracts alone or combined with α-syn mpffs (0.4 mg/ml) as well as WT mice injected with human AD-tau–enriched extracts plus α-syn monomers (C), human AD-tau–enriched extracts, and α-syn mpffs injected after separate sonication (D), or human AD-tau–enriched extracts and a higher concentration of α-syn mpffs (2 mg/ml; E). Scale bar, 100 µm. All experimental data were verified in at least two independent experiments.
Figure S3.
Figure S3.
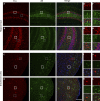
α-Syn and tau pathology are rarely localized in the same neuron. (A–D) Immunofluorescence staining showing rare colocalization of p-α-syn (red) and p-tau (green) in the hippocampus (A and B) and entorhinal cortex (C and D). (E–L) Representative images of select magnified areas from the hippocampus (E–H) and entorhinal cortex (I–L) showing α-syn and tau localization in different compartments of the same cell (see boxed portions of the images) and enlargements ofthese boxed images along the righthand margin of the main figures. Scale bar, 100 µm. All experimental data were verified in at least two independent experiments.
Figure 4.
Figure 4.
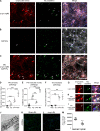
In vitro modeling of p-α-syn and p-tau copathology recapitulates in vivo data. (A–I) IF double labeling shows p-α-syn pathology (red) and increased p-tau pathology (green) in neurons transduced with AD-tau–enriched extracts and α-syn mpffs combined (C, H, and I) compared with α-syn mpffs (A and G) or AD-tau–enriched extracts (B) alone. Scale bar, 50 µm. P-tau pathology is seen in both α-syn mpff–transduced neurons (G) and after combined treatment with α-syn mpffs/AD-tau–enriched extracts (H and I); in combined treatment, p-tau pathology can be seen in cells where p-α-syn pathology is present (H) or absent (I). (G–I) Arrows point to colocalized α-syn and tau pathology in primary neurons while arrowheads point to the presence of tau pathology in the absence of α-syn pathology. Quantification of cell body tau (D), insoluble neuritic tau (E), and p-α-syn (F) pathology seen in A–C. One-way ANOVA followed by Tukey’s post-hoc analysis was used to analyze the data (three repeats). (J) Immunoelectron microscopy shows tau (arrows) and α-syn (arrow heads) in proximity. Scale bar, 100 nm. (K and L) IF for insoluble tau (green) of WT mouse neurons treated with human AD-tau–enriched extracts and either sham shRNA (K) or α-syn shRNA (L). (M) Quantification of p-tau pathology showing a significant reduction in insoluble tau pathology in α-syn shRNA-treated neurons. A two-tailed t test was performed to calculate the difference between groups; *, P < 0.05; **, P < 0.01; ****, P < 0.0001. Data are presented as mean ± SEM (n = 6–7 replicates). All experimental data were verified in at least two independent experiments.
Figure 5.
Figure 5.
α-Syn expression modulates pathology spread after AD-tau extract injection. (A–E) Representative images for AT8 p-tau pathology in tissue sections from the rostral and caudal hippocampus (A), entorhinal cortex (B), retrosplenial cortex (C), auditory cortex (D), and supramammillary nucleus (E) of WT and α-synKO mice 3, 6, or 9 mpi of AD-tau–enriched extracts. Scale bar, 100 µm. (F–O) Quantification of p-tau seen in A–E in the ipsilateral (F) and contralateral (G) hippocampus, ipsilateral (H) and contralateral (I) entorhinal cortex, ipsilateral (J) and contralateral (K) retrosplenial cortex, ipsilateral (L) and contralateral (M) auditory cortex, and ipsilateral (N) and contralateral (O) supramammillary nucleus. A two-tailed t test was performed to calculate the difference between groups; *, P < 0.05; **, P < 0.01; ****, P < 0.0001. Data are presented as mean ± SEM (n = 5–9 mice per group). (P) Semiquantitative heat mapping of p-tau pathology in WT and α-synKO mice injected with human AD-tau–enriched extracts. (Q–T) Quantification of p-tau–positive neurons in the ipsilateral hippocampus (Q), contralateral hippocampus (R), ipsilateral entorhinal cortex (S), and contralateral entorhinal cortex (T) of WT and α-synKO mice injected with human AD-tau extract 3, 6, or 9 mpi. A two-tailed t test was performed to calculate the difference between groups; *, P < 0.05; **, P < 0.01. Data are presented as mean ± SEM (n = 5–6 mice per group). All experimental data were verified in at least two independent experiments.
Figure S4.
Figure S4.
α-Syn knockout does not affect vesicular trafficking, neuronal uptake, or connectivity. (A and B) WT (A) and α-synKO (B) mouse neurons treated with FM 4–64 (red dye). Scale bar, 20 µm. (C) Quantification of FM 4–64 uptake. A two-tailed t test was performed to calculate the difference between groups. (D–F) Hippocampus (D), auditory cortex (E), and entorhinal cortex (F) of WT and α-synKO mice injected with retrobeads (RB). Scale bar, 100 µm. (G) Quantification of retrobeads 1 and 7 d after injection. A two-tailed t test was performed to calculate the difference between groups. All experimental data were verified in at least two independent experiments. A.U., arbitrary units.
Figure 6.
Figure 6.
Tau expression is not required for α-syn pathology spread after mpff brain injections. (A) Representative images for p-α-syn pathology in tissue sections from the rostral, caudal, and CA1 region of the hippocampus, entorhinal cortex, retrosplenial cortex, and auditory cortex of WT and tauKO mice at 3, 6, or 9 mpi of α-syn mpffs. Scale bars, 100 µm. (B–I) Quantification of p-α-syn seen in A in the ipsilateral (B) and contralateral (C) hippocampus, ipsilateral (D) and contralateral (E) retrosplenial cortex, ipsilateral (F) and contralateral (G) auditory cortex, and ipsilateral (H) and contralateral (I) entorhinal cortex. A two-tailed t test was performed to calculate the difference between groups. Data are presented as mean ± SEM. (J) Semiquantitative heat mapping of p-α-syn pathology in WT and tauKO mice injected with α-syn mpffs (n = 4–7 mice per group). All experimental data verified in at least two independent experiments.
Figure S5.
Figure S5.
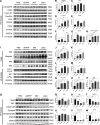
The effect of α-syn, tau, and combined pathology on modulators of phosphorylation, protein clearance, and cell viability markers. (A–W) Immunoblot analysis probing for modulators of phosphorylation (A–H), protein clearance mechanisms (I–P), and neuronal and synaptic markers (Q–W) were conducted on protein samples from the hippocampus of 4.5 and 6 mpi WT mice injected with PBS, AD-tau–enriched extracts alone, AD-tau combined with α-syn mpffs, or α-syn mpffs alone. (B and C) Statistical analysis shows a significant increase in p38MAPK in all three injected groups compared with PBS-injected WT mice (B), while a significant increase in CDK5 was observed in mice injected with AD-tau combined with α-syn mpffs compared with PBS-injected WT mice (C). (D and E) A significant increase in Cyclin D1 was observed in all three injected groups compared with PBS-injected WT mice (D), while CamKIIa levels were increased in all three injected groups compared with PBS-injected mice, though the results were not significant (E). (F and G) Statistical analysis showed a significant reduction of PKC levels in mice injected with AD-tau combined with α-syn mpffs (F), while a significant increase in GSK-3β levels was found in AD-tau–injected mice compared with PBS-injected mice (G). (H) Statistical analysis showed a significant increase in the inhibition of tau dephosphorylation enzyme p-PP2A in all three groups compared with PBS-injected mice. (I–P) Immunoblot probing for modulators of protein clearance mechanisms (I) showed a significant increase in p62 (J), ubiquitin (K), K63 (M), LC3-1/2 (N), BIP (O), and eiF2α (P) in all injected groups compared with PBS-injected control mice. An increase in K48 levels was reported in all groups compared with PBS-injected mice, albeit only significant in AD-tau combined with α-syn mpff–injected mice (L). (Q–U) Immunoblot probing for neuronal and synaptic markers (Q) showed no significant difference in NeuN (R) and a significant decrease in NFL levels in the AD-tau combined with α-syn mpff–injected mice compared with the PBS-injected group (S); a significant decrease in tubulin βIII (T), synaptophysin (V), and PSD-95 (W) was observed in all three injected groups compared with PBS-injected mice; (U) AD-tau, α-syn mpffs, and combined AD-tau and α-syn mpffs did not lead to a significant decrease in synapsin levels. Normalized OD was calculated from each corresponding sample and statistical analysis was performed to analyze target protein levels in the four injection groups. One-way ANOVA followed by Tukey’s post-hoc analysis was used to analyze the data; *, P < 0.05; **, P < 0.01; ***, P < 0.001; ****, P < 0.0001. Data are presented as mean ± SEM. All experimental data were verified in at least two independent experiments.

References

    1. Abeliovich A., Schmitz Y., Fariñas I., Choi-Lundberg D., Ho W.H., Castillo P.E., Shinsky N., Verdugo J.M., Armanini M., Ryan A., et al. . 2000. Mice lacking alpha-synuclein display functional deficits in the nigrostriatal dopamine system. Neuron. 25:239–252. 10.1016/S0896-6273(00)80886-7 - DOI - PubMed
    1. Arai Y., Yamazaki M., Mori O., Muramatsu H., Asano G., and Katayama Y.. 2001. Alpha-synuclein-positive structures in cases with sporadic Alzheimer’s disease: morphology and its relationship to tau aggregation. Brain Res. 888:287–296. 10.1016/S0006-8993(00)03082-1 - DOI - PubMed
    1. Bachhuber T., Katzmarski N., McCarter J.F., Loreth D., Tahirovic S., Kamp F., Abou-Ajram C., Nuscher B., Serrano-Pozo A., Müller A., et al. . 2015. Inhibition of amyloid-β plaque formation by α-synuclein. Nat. Med. 21:802–807. 10.1038/nm.3885 - DOI - PubMed
    1. Badiola N., de Oliveira R.M., Herrera F., Guardia-Laguarta C., Gonçalves S.A., Pera M., Suárez-Calvet M., Clarimon J., Outeiro T.F., and Lleó A.. 2011. Tau enhances α-synuclein aggregation and toxicity in cellular models of synucleinopathy. PLoS One. 6:e26609 10.1371/journal.pone.0026609 - DOI - PMC - PubMed
    1. Bassil F., Brown H.J., Pattabhiraman S., Iwasyk J.E., Maghames C.M., Meymand E.S., Cox T.O., Riddle D.M., Zhang B., Trojanowski J.Q., and Lee V.M.. 2020. Amyloid-Beta (Aβ) Plaques Promote Seeding and Spreading of Alpha-Synuclein and Tau in a Mouse Model of Lewy Body Disorders with Aβ Pathology. Neuron. 105:260–275.e6. 10.1016/j.neuron.2019.10.010 - DOI - PMC - PubMed

Publication types