. 2021 May;147(5):1683-1691.
doi: 10.1016/j.jaci.2020.10.009. Epub 2020 Oct 19.

Developmental patterns in the nasopharyngeal microbiome during infancy are associated with asthma risk

Affiliations

Developmental patterns in the nasopharyngeal microbiome during infancy are associated with asthma risk

Howard H F Tang et al. J Allergy Clin Immunol. 2021 May.

Abstract

Background: Studies indicate that the nasal microbiome may correlate strongly with the presence or future risk of childhood asthma.

Objectives: In this study, we tested whether developmental trajectories of the nasopharyngeal microbiome in early life and the composition of the microbiome during illnesses were related to risk of childhood asthma.

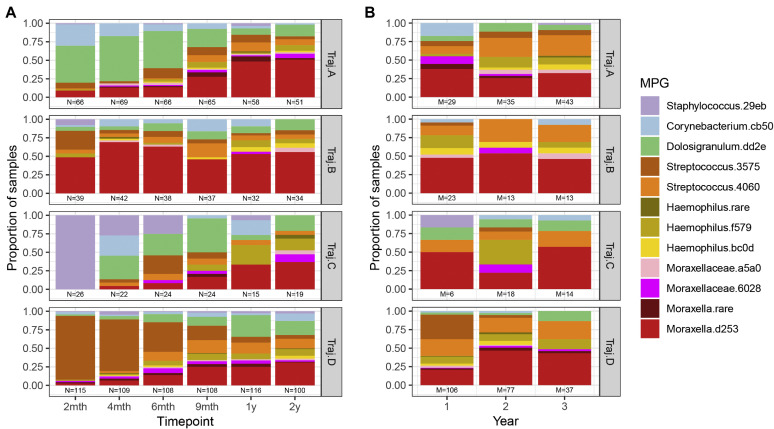
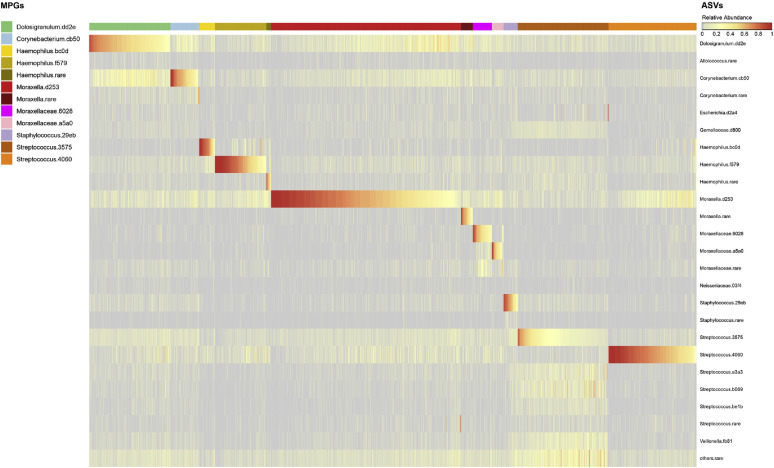
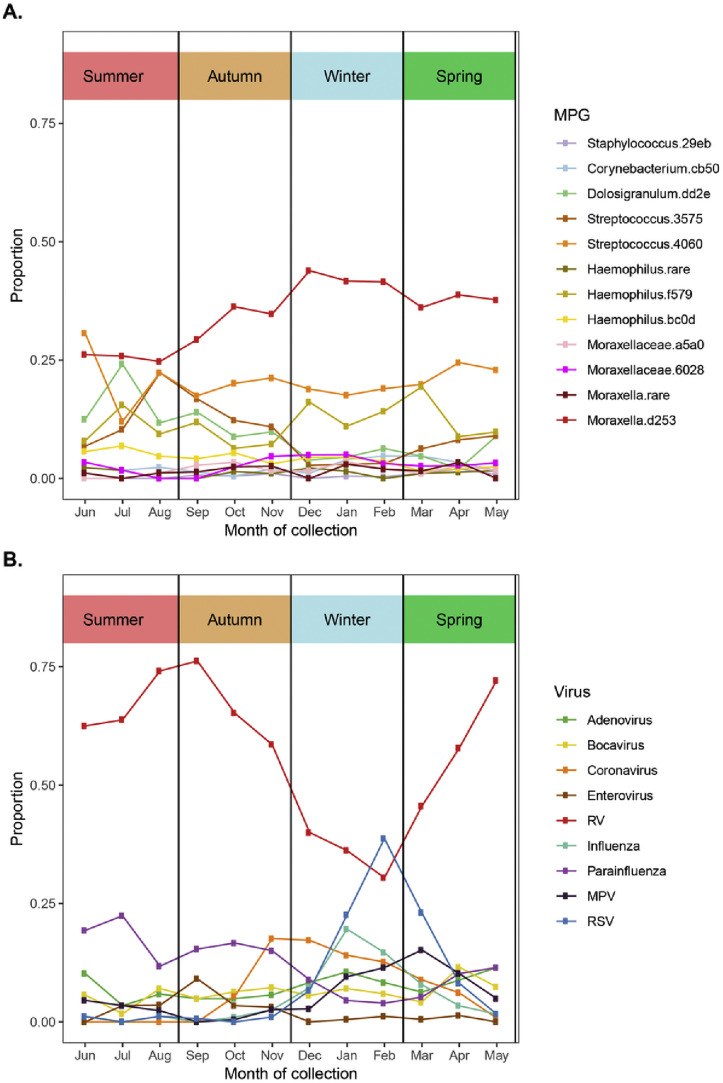
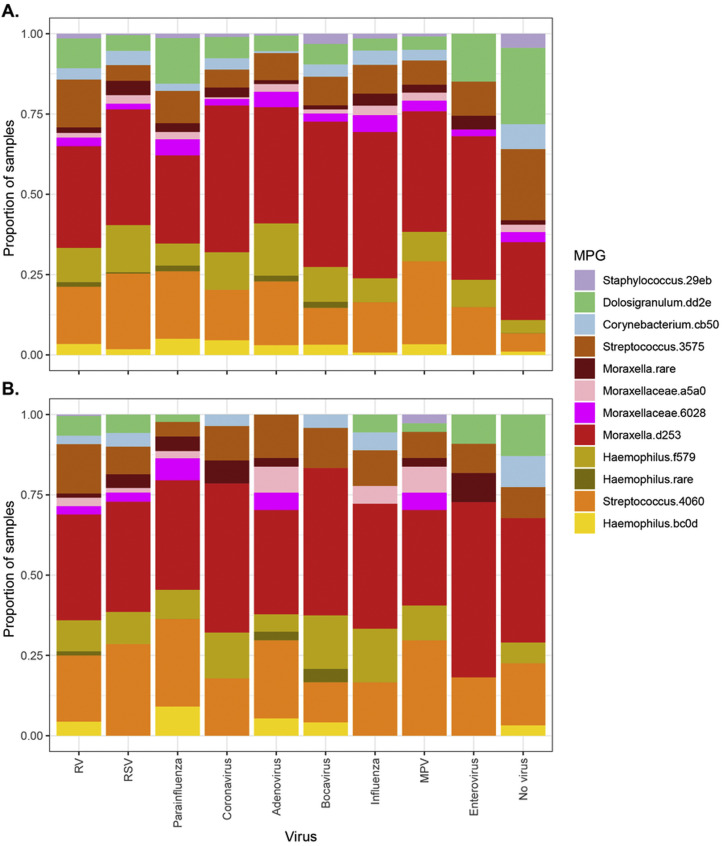
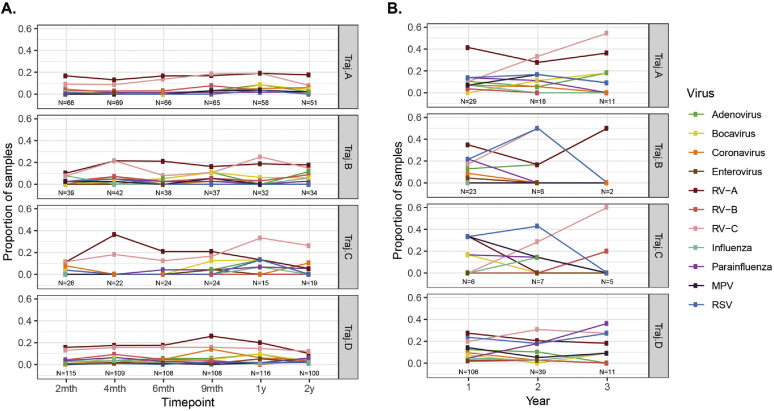
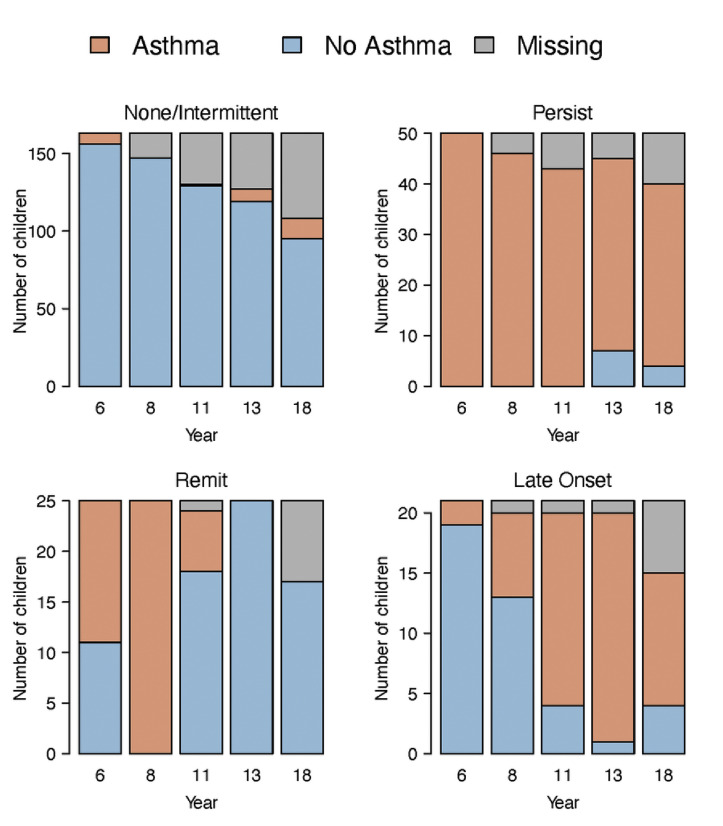
Methods: Children participating in the Childhood Origins of Asthma study (N = 285) provided nasopharyngeal mucus samples in the first 2 years of life, during routine healthy study visits (at 2, 4, 6, 9, 12, 18, and 24 months of age), and during episodes of respiratory illnesses, all of which were analyzed for respiratory viruses and bacteria. We identified developmental trajectories of early-life microbiome composition, as well as predominant bacteria during respiratory illnesses, and we correlated these with presence of asthma at 6, 8, 11, 13, and 18 years of age.

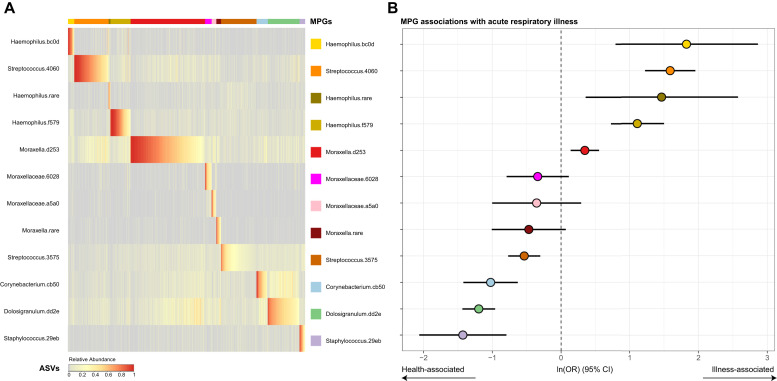
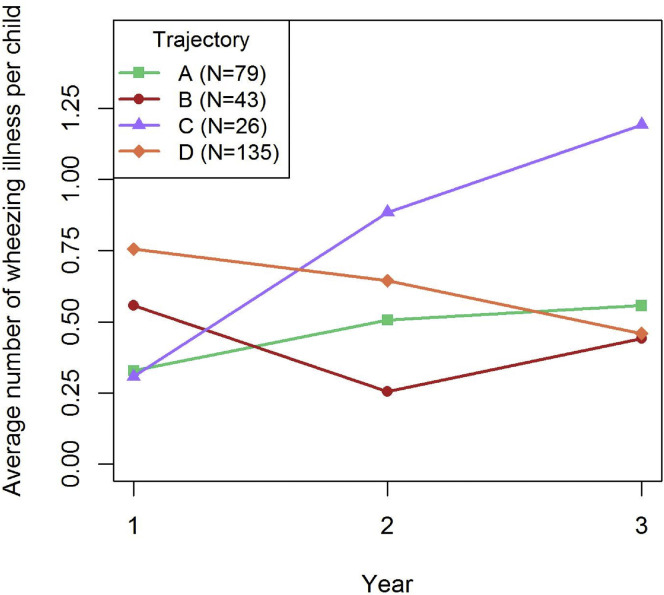
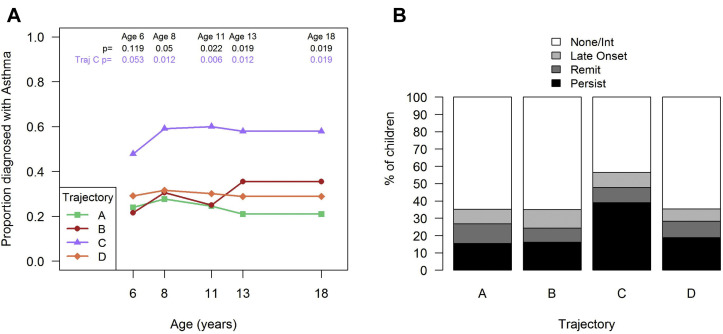
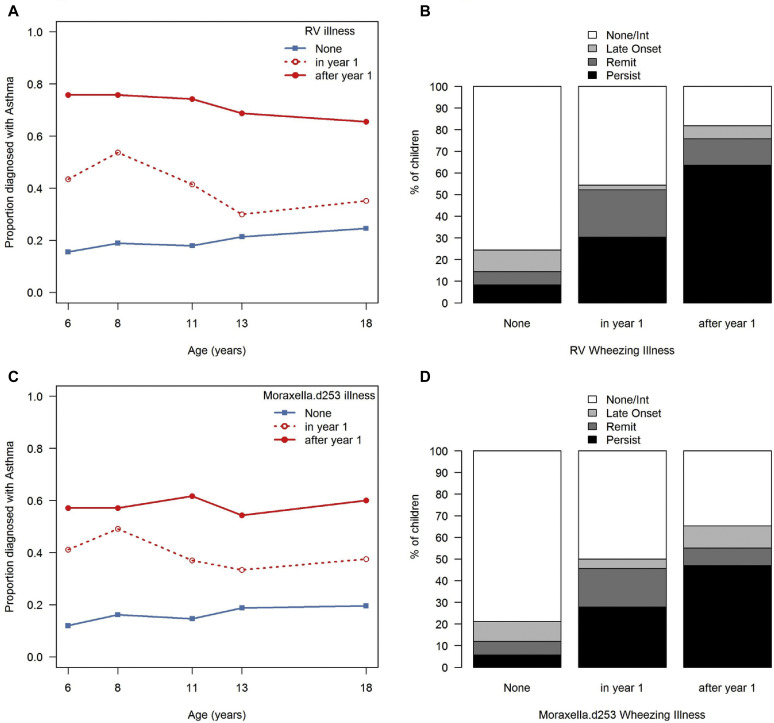
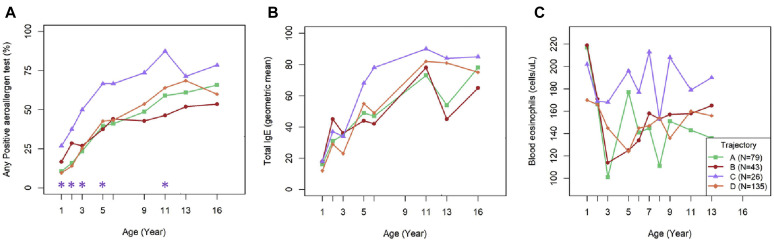
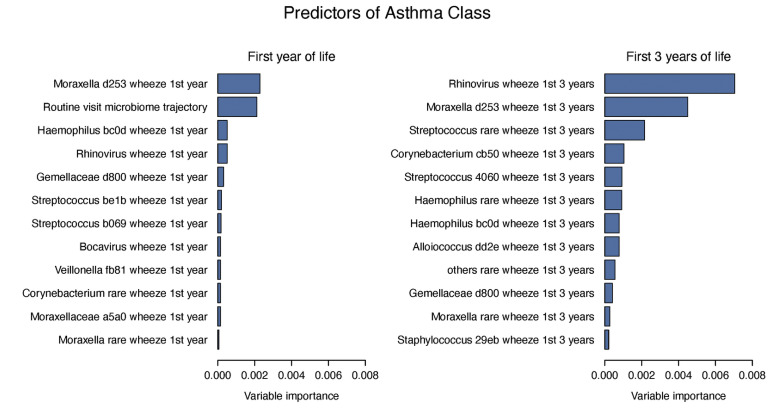
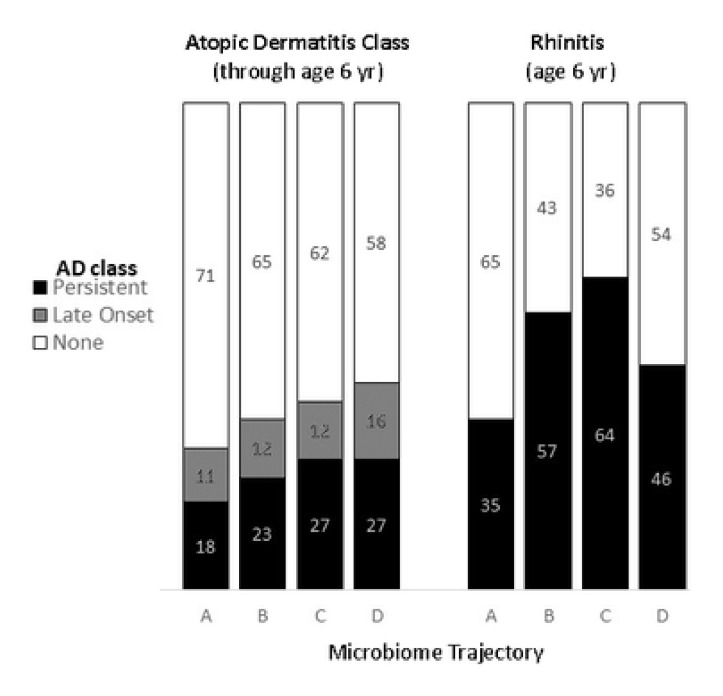
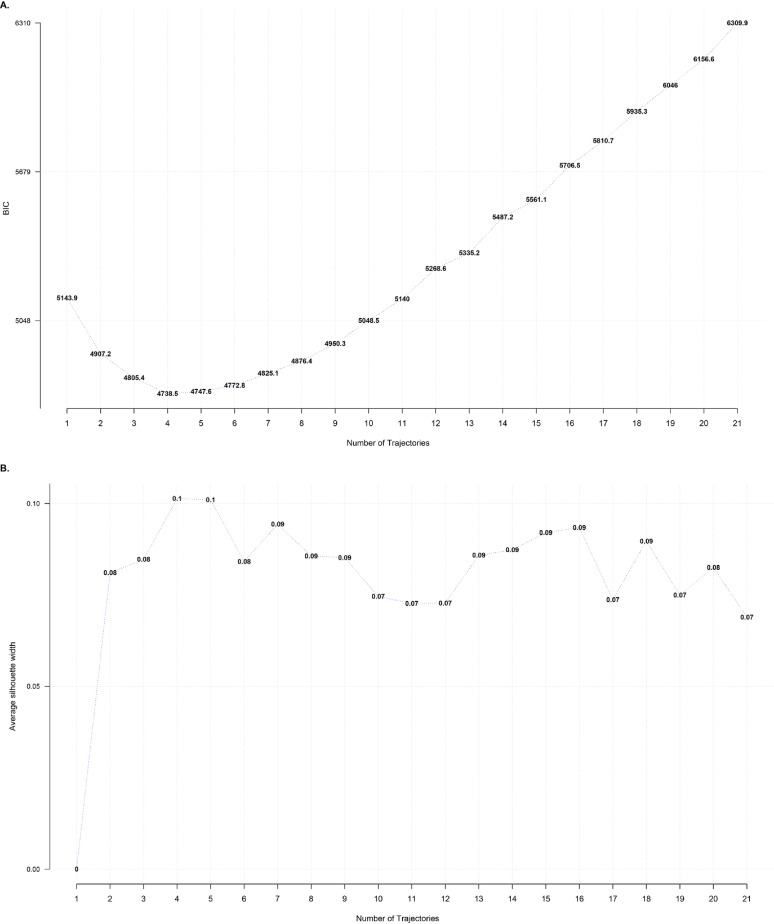
Results: Of the 4 microbiome trajectories identified, a Staphylococcus-dominant microbiome in the first 6 months of life was associated with increased risk of recurrent wheezing by age 3 years and asthma that persisted throughout childhood. In addition, this trajectory was associated with the early onset of allergic sensitization. During wheezing illnesses, detection of rhinoviruses and predominance of Moraxella were associated with asthma that persisted throughout later childhood.

Conclusion: In infancy, the developmental composition of the microbiome during healthy periods and the predominant microbes during acute wheezing illnesses are both associated with the subsequent risk of developing persistent childhood asthma.

Keywords: Microbiome; asthma; birth cohort; children; development.


Figures

Fig 1
Fig 1
Composition of nasopharyngeal microbiome in COAST subjects, and relationship to acute respiratory illness. A, Clustering of microbiomes into microbiome profile groups (MPGs), by relative abundances of ASVs within each sample, as described in the Methods section. The heat in the heatmap represents relative abundance of each ASV (rows, color-coded on the right), arranged by samples (columns) clustered into MPGs (top bar separated by colors of dominant ASV). B, MPG association with respiratory illness, calculated from GEE models with sex, age, and season as covariates. Points (color-coded as per [A]) represent the estimates as natural logarithms of odds ratios (ORs) for association of each MPG with samples from patients with illness versus samples from healthy individualsl, whereas error bars represent 95% CIs for estimates. Numeric results are given in Table E2, A.
Fig 2
Fig 2
Longitudinal trajectories of nasopharyngeal microbiome. Multiple factor analysis and k-means cluster analysis separated children into trajectories (vertical facets) based on similar patterns of “baseline” microbiome from routine samples from healthy or ill patients in the first 2 years of life. A, Distribution of MPGs as proportions of routine samples (vertical axis) across each trajectory with time point of sampling (horizontal axis). Time points labeled by approximate time of routine visit (eg, 2 months refers to time period spanning 0 to 3 months, 4 months refers to 3 to 5 months, etc). Note the distinctive patterns observed for MPGs in each trajectory, especially in the first 6 months of life. B, Proportion of samples with MPG present during acute wheezing illness in the first 3 years of life among individuals assigned to each baseline, routine sample-based microbiome trajectory as in (A).
Fig 3
Fig 3
Association of nasal microbiome trajectories with the frequency of wheezing illnesses. Number of wheezing illnesses in years 1, 2, and 3 of life was determined for individuals in each of the 4 nasal microbiome trajectories (A, B, C, and D). Microbiome trajectory C, dominated by early Staphylococcus.29eb, was associated with an increase in the number of wheezing illnesses over time (Kruskal test, P = .0006 for trajectory C).
Fig 4
Fig 4
Association of nasal microbiome trajectories with asthma. Nasal microbiome trajectory C dominated by early Staphylococcus.29eb is associated with higher frequency of asthma at each scheduled assessment (A). P values were obtained by using the chi-square test across all trajectories (top, in black) or post hoc Bonferroni-corrected comparisons for trajectory C versus all other trajectories (A + B + D [bottom, in purple]). Nasal microbiome trajectory C had a higher proportion of children with a persistent asthma phenotype than the other trajectories did (B) (trajectory C vs the other trajectories; P = .08).
Fig 5
Fig 5
Association of microbial pathogen detection during illnesses with asthma. Detection of rhinovirus during wheezing illnesses was associated with increased risks of developing asthma at multiple ages (A). Wheezing illnesses during the second and third years of life were most strongly related to persistent asthma (B). Similar patterns were noted for Moraxella d253 (C and D). P < .001 for all comparisons; Fisher exact test.
Fig 6
Fig 6
Associations between nasal microbiome trajectories and indicators of atopy. Nasal microbiome trajectory C consistently had a higher proportion of children who were sensitized to at least 1 aeroallergen (A), with similar nonsignificant trends for total IgE (B) and blood eosinophil (C) levels. ∗P < .05 for trajectory C versus other all the trajectories.
Fig E1
Fig E1
Fig E2
Fig E2
Fig E3
Fig E3
Fig E4
Fig E4
Fig E5
Fig E5
Fig E6
Fig E6
Fig E7
Fig E7
Fig E8
Fig E8
Fig E9
Fig E9
Fig E10
Fig E10

References

    1. Zahran H.S., Bailey C.M., Damon S.A., Garbe P.L., Breysse P.N. Vital signs: asthma in children - United States, 2001-2016. MMWR Morb Mortal Wkly Rep. 2018;67:149–155. - PMC - PubMed
    1. Bisgaard H., Hermansen M.N., Bonnelykke K., Stokholm J., Baty F., Skytt N.L. Association of bacteria and viruses with wheezy episodes in young children: prospective birth cohort study. BMJ. 2010;341:c4978. - PMC - PubMed
    1. Teo S.M., Tang H.H.F., Mok D., Judd L.M., Watts S.C., Pham K. Airway microbiota dynamics uncover a critical window for interplay of pathogenic bacteria and allergy in childhood respiratory disease. Cell Host Microbe. 2018;24:341–352.e5. - PMC - PubMed
    1. Kloepfer K.M., Lee W.M., Pappas T.E., Kang T.J., Vrtis R.F., Evans M.D. Detection of pathogenic bacteria during rhinovirus infection is associated with increased respiratory symptoms and asthma exacerbations. J Allergy Clin Immunol. 2014;133:1301–1307.e3. - PMC - PubMed
    1. Bashir H., Grindle K., Vrtis R., Vang F., Kang T., Salazar L. Association of rhinovirus species with common cold and asthma symptoms and bacterial pathogens. J Allergy Clin Immunol. 2018;141:822–824.e9. - PMC - PubMed

Publication types

Substances